Across the social sciences the greatest challenge confronting researchers and practitioners is explaining and/or predicting the behavior of complex adaptive systems, which have many parts that interact in non-simple ways (e.g., multiple possible causes for an effect, feedback processes and non-linear effects, and time delays between causes and effects).
In such systems, behavior emerges from these complex interactions, not just from the rules followed by any individual agent. Moreover, as the agents that populate these systems constantly adjust their beliefs and behavior to achieve their (sometimes conflicting) goals, the structure of a complex adaptive system itself constantly evolves; more technically, such systems are “non-stationary” data-generating processes, in which an understanding of the past does not automatically confer an ability to accurately predict the future. In sum, complex adaptive systems are organic, not mechanistic, and are far more likely to produce outcomes whose distribution is best described by a power law, rather than the more familiar bell curve.
Explanation and prediction challenges become exponentially more difficult as more than one complex adaptive systems are interconnected. For example, our model of “global macro” includes changes in six key areas: technology, the economy, national security, society, politics, and financial market structure and behavior. We also recognize the potential for substantial “wildcard” effects from less predictable changes in the areas of health and infectious disease; energy and the environment; and cyber and solar events.
There are a number of different approaches that can be used to address the challenge of predicting the behavior of complex adaptive systems.
One approach is directly modeling them (albeit at a high level). For example, Monte Carlo and System Dynamics are top down quantitative modeling approaches based on underlying causal beliefs. The former captures the impact of variation in the values of key variables, while the latter focuses on the impact of feedback effects and stock/flow constraints (e.g., a bathtub that eventually catastrophically overflows if the rate of water inflow exceeds the rate of water outflow). In contrast, agent-based modeling is a bottom-up technique that seeks to identify the outcomes that emerge from the interaction of agents who follow a limited number of assumed goals rules to guide their behavior. In some cases, aspects of these techniques are combined (e.g., see, “Agent-Based Stock-Flow Consistent Macroeconomics: Towards a Benchmark Model” by Caiani et al, and papers by Giovanni Dosi, Didier Sornette, Doyne Farmer, Brian Arthur, Xavier Gabaix, and Car Hommes – to name just a few of the growing number of researchers in this area).
Another family of quantitative approaches to the prediction challenge is associative, rather than causal, and based on statistical methods. These include a wide range of econometric techniques that seek to reduce the dimensionality of the problem, for example by identifying a limited number of factors whose variation, at least in the past, can account for a substantial portion of the variation in a much larger number of outcomes (e.g., using Fama-French factors to forecast equity returns).
Finally, uncertainty about the nature of relationships between the variables in the system being modeled, and/or multiple conflicting goals can often be managed through so-called “ensemble modeling”, which combines the results of multiple runs of different models to estimate the full range of possible system outcomes.
In contrast to the hypothesis testing method that underlies econometrics, “machine learning” approaches (including deep learning artificial intelligence techniques) seek to maximize predictive accuracy without making any assumptions about the underlying causal model. In effect, these methods analyze historical or synthetic data to create extremely complex statistical models to predict a target outcome from a very diverse set of inputs. A key issue with such models is whether end users will trust their outputs if they cannot easily understand how they were derived (hence the growing popularity of “explainable AI”).
Qualitative methods are also used to predict the behavior of complex adaptive systems. Perhaps the most familiar is the use of historical analogies (e.g., “applied history” techniques, or the case method). Another widely used approach is the scenario method, which derives alternative future narratives from the interaction of relatively predictable trends and a limited number of critical uncertainties.
At the Index Investor, we use an approach that combines some of these techniques. Fist, we specify our forecasting goal: accurately estimating the probability that the global macro system will be in one of four regimes at some point in the future (e.g., in 12 and 36 months). Based on our analysis of economic and financial market history, we define these regimes as normal times (which equities and high yield debt deliver the highest relative returns); high inflation (when inflation linked bonds, property, and commodities like gold and timber perform best); high uncertainty (usually a transitory regime in which short term government securities, gold, and the Swiss Franc usually outperform); and persistent deflation, as we have seen in Japan over the past thirty years (where long term government and high quality corporate bonds and consumer staples equities should outperform). These four different regimes can be thought of as “macro factors” that drive the relative returns on broadly defined asset classes.
We assume that the emergence of these regimes reflects the interaction of five six macro drivers, including changes in technology (including healthcare and education as two critical “social technologies”); the economy; national security; social values, beliefs, and behavior; politics; and the structure of financial markets. As noted above, we also recognize the potential for “wildcard” effects on regime probabilities from changes in the areas of health and disease; energy and the environment; and cyber and solar events.
Critically, our model assumes that the effects produced by these drivers occur in a rough chronological pattern (albeit with many feedback loops), in which changes in technological possibilities drives changes in the economy and national security (with an interaction between those two), which produce social changes that have a significant impact on political changes. These interact with changes in the structure of financial markets (e.g., increases algorithmic trading, increased connectivity between global markets, new products like ETFs, increased assets committed to private capital strategies, etc.) to determine the macro (broadly defined) regime we are in at any point in time.
To reduce the complexity of these drivers, we employ a scenario approach, based on the interaction of two critical uncertainties. This generates four possible outcomes for each of our five key drivers (technology, the economy, national security, society, and politics). Mathematically, this simplifying approach generates a still unwieldy 1,024 (4 to the 5th power) possible scenarios – without considering the wildcards or changes in financial market structure.
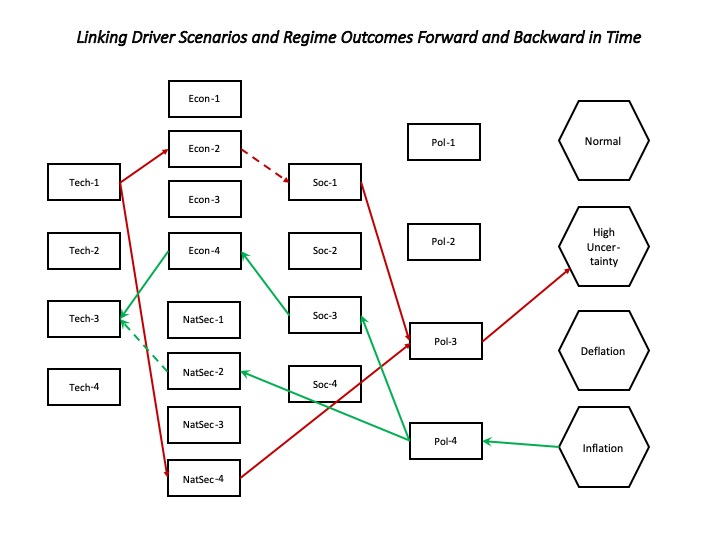
To further simplify our forecasting problems, we employ the Bayesian concept of Likelihood. Working either backward in time from future regimes through different drivers (i.e., “prospective hindsight”) or forward in time starting with technology drivers, we ask whether, given our starting scenario, one scenario in the next set of drivers is significantly more likely than others. For example, slow economic growth and worsening inequality make it less likely that immigration problems will be resolved and social capital renewed. To be clear, this method does not make causal assumptions, as all of our scenario outcomes emerge from complex processes that can at best be imperfectly understood. Rather, our approach is associative, and is based on our estimate of the extent to which a scenario outcome for a given driver is more likely to be observed than others for that driver assuming a specific scenario for another driver occurs.
We use this method to construct a limited number of logically and chronologically coherent pathways through the 1,024 possible scenarios that lead to different regime outcomes. Finally, given variations in the likelihood ratios, some pathways will appear more and less uncertain that others, which in turn helps us to focus our information collection efforts.
The graph below presents a visual overview of this methodology. The red arrows show a narrative pathway proceeding forward in time from a technology scenario, while the green arrows show a pathway that proceeds backwards in time from an assume future regime outcome. The dashed lines represent weak likelihood ratios.
Let’s now turn to the current assumptions we are using in our analytical model, beginning with the two uncertainties that underlie our four scenarios for each macro driver:
Technology
Fast versus slow development and deployment of automation and artificial intelligence technologies.
Strong versus weak productivity growth in healthcare and education, the two key “social technologies” that now account for almost 25% of US GDP.
Economy
Faster versus slower growth in aggregate demand.
Increasing or declining inequality.
National Security
More cooperative or more conflict driven US-China relations.
Increase versus either no change or decrease in China’s military power relative to the United States and its allies.
Society
Consensus solution to immigration problem is implemented, or no solution is arrived at and conflict over this issue worsens.
Social capital increases, or continues to decrease, as it has in recent years.
Politics
The relative strength of the center strengthens or weakens.
The popular legitimacy of government institutions strengthens or weakens.
The construction of our narrative pathways connecting different driver scenarios to regime outcomes is based on a set of beliefs about likely associations that we try to make explicit (not always an easy task). The most important are summarized below:
Fast development and deployment of automation and artificial intelligence technologies will be associated with higher demand growth, all else being equal, via productivity improvement. Slower D&D of A&A is associated with slower demand growth.
Faster healthcare and education productivity improvement (and hence reduced cost/price and pressures and improved outcomes) is associated with reduced inequality. Slower productivity improvement in these areas is associated with increased inequality.
All else being equal, slower development and deployment of automation and artificial intelligence technologies in the US is associated with weakening of national power vis-a-vis China. Faster D&D of A&A maintains or improves the balance in favor of the US.
Falling inequality in the United States is associated with a reduction in the level of conflict in the US-China relationship, which in part based on the search for an external “other” to blame for worsening domestic conditions. Rising inequality is associated with a higher level of conflict.
Faster demand growth and reduced inequality are associated with reduced conflict over immigration (which, as in the case of China, provides an external “other” to blame for worsening domestic conditions). Slower growth and increasing inequality are associated with increased conflict over immigration issues.
Weakened US national power vis-a-vis China is associated with increasing social capital in the face of a potentially dangerous external threat. Increasing national power vis-à-vis China is not associated with increasing social capital.
Weakened US national power vis-a-vis China is associated with increasing institutional legitimacy (assuming this leads to higher degrees of cooperation and better institutional functioning in the face of a strengthening external threat). Increasing national power vis-à-vis China is not associated with increasing institutional legitimacy.
Reduced inequality is associated with increasing social capital. Worsening inequality is associated with declines in social capital.
Strengthened social capital is associated with the relative strengthening of the political center. Weakened social capital is associated with further weakening of the political center.
Reduced conflict over immigration is associated with strengthened institutional legitimacy. Continued or worsening conflict over immigration is associated with further weakening of institutional legitimacy.
Key Elements of Four Pathway Narratives
Pathway #1
Technology
Fast Automation and AI Development and Deployment
Strong Productivity Growth in Healthcare and Education
Economy
Faster demand growth
Declining inequality
National Security
Improving US-China relations
No or negative change in China’s relative power
Social
Consensus solution to immigration
Increase in social capital
Political
Relative strength of the center increases
Institutional legitimacy increases
Macro Regime
Return to Normal
Pathway #2
Technology
Fast Automation and AI Development and Deployment
Slow Productivity Growth in Healthcare and Education
Economy
Faster job displacement leads to falling demand
Rising inequality
National Security
Worsening relations with China
Either no or negative change in China’s relative power
Social
No consensus solution to immigration
Decrease in social capital
Political
Increased popularity of extremes; further collapse of center
Decreased institutional legitimacy
Macro Regime
Deflation
Pathway #3
Technology
Slow Automation and AI Development
Slow Productivity Growth in Healthcare and Education
Economy
Slow demand growth
Increasing inequality
National Security
Increasing US-China conflict
China gaining relative power
Social
Immigration not resolved
China perceived as a unifying external threat, increasing social capital
Political
Increased popularity of extremes; further collapse of center
Institutional legitimacy (defense and security) increases
Macro Regime
High Uncertainty
Pathway #4
Technology
Slow Automaton and AI Deployment
Fast Productivity Growth in Healthcare and Education
Economy
Slow growth
Declining inequality
National Security
Improving relations with China
China also gaining relative power
Social
Immigration not revolved
But social capital increases
Political
Center strengthens
Whether institutional legitimacy recovers depends on balance between fear of increasing relative Chinese power versus slow growth and failure to resolve immigration
Macro Regime
High Uncertainty
To summarize, both quantitative and qualitative methods can be used to forecast the behavior of complex adaptive systems. All of these methods are imperfect, and at best will provide a “coarse grained” understanding of the system’s dynamics and possible outcomes.
In the case of the complex “system of system” that we call “global macro” we prefer to base our forecasts on the structured, scenario-based approach we have described. It has the virtues of flexibility and explainability, while also providing a systematic way to incorporate both experience and new information.
Most importantly, perhaps, our approach is sufficiently different from the methods used by other macro forecasters that combining our estimates with those based on other approaches will almost certainly improve overall forecast accuracy.
If you have any questions about anything we have written in this issue, please don’t hesitate to get in touch, at contact@indexinvestor.com