Feature Article: COVID's Impact in 2023: Trends, Uncertainties, Scenarios, and Forecast Probabilities
As a former student of Shell’s Pierre Wack, I have long appreciated the value of scenarios as a way of reasoning about a range of possible and plausible future outcomes driven by interacting trends and uncertainties. As a humble veteran of the Professor Philip Tetlock’s Good Judgment Project, I also know the power (and ego risks) of making forecasts that include specific probability estimates for verifiable outcomes. And above all, over 40 years I have seen time and again that complex adaptive systems generate a non-linear distribution of tail risks that are usually underestimated (in likelihood, speed, and impact), if they are recognized at all.
With those caveats in mind, this month I will build on a number of our previous Index Investor feature articles (e.g., “Global Macro Risk Dynamics in the 2020s and Beyond”, “The Next Downturn: How Different, How Deep? How Long?”, and “What Do We Know About Escaping the Persistent Deflation Regime?”) to provide some specific forecasts about the impact of the COVID19 pandemic on what the world will look like in 2023.
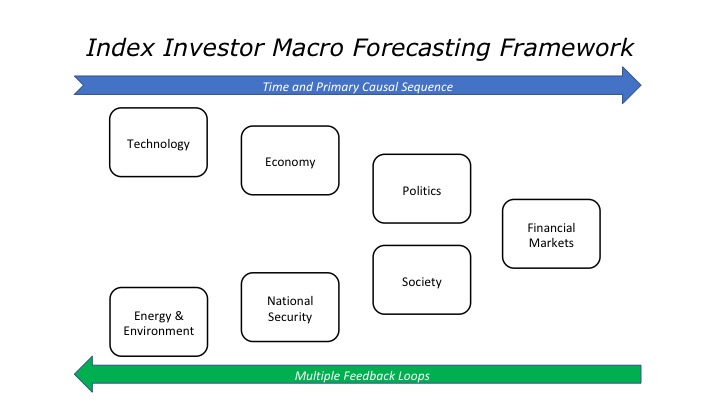
As a reminder, as we have often described in The Index Investor, our approach to global macro forecasting assumes that the changes we eventually observe in asset class valuations and returns are the end result of a roughly chronological process (albeit one with many feedback loops).
At the earliest stage of this process there are changes in technology and in the areas of energy and the environment (which also includes health related wildcards like disease and pandemics).
These fundamental drivers have a significant impact on subsequent changes in the economy and national security, which in turn affect social and political outcomes.
In taking this approach, our goal is to better capture the roles of time and speed, and to make second and third order consequences (and important forecasting questions) easier to discern.
At the end of December 2019, our recommended asset allocation was already highly defensive, based on our conclusion that rising stresses in many areas would eventually produce a sharp and very likely extended downturn in the global macro system.
Technology
• Poorly performing (but increasingly expensive) education systems, which slowed labor productivity growth and strengthened employers’ incentive to invest more in rapidly improving automation and artificial intelligence technologies. This limited wage growth and contributed to increasing inequality.
• In developed countries, the rising cost of health and social care systems that were struggling to effectively and efficiently serve populations that were both aging and suffering from a rising number of chronic ailments (e.g., diet and obesity related hypertension and type 2 diabetes).
Energy and the Environment
• Emission reductions in western nations were being more than offset by increases in China and other nations, resulting in accelerating changes in average global temperatures, rainfall, storm intensity, and other effects whose negative impact (in terms of both velocity and impact) was still highly uncertain.
• The marginal cost of producing traditional forms of fossil energy (e.g., the energy return on energy investment) was rising, while the full suite of technologies (e.g., grid control, utility scale battery storage, market design, etc.) needed for widespread deployment of cost effective solar electricity generation was not yet mature, and there was still considerable popular resistance to increased use of nuclear generation.
Economy
• A variety of forces were increasing downward pressure on aggregate demand growth, leading to a state of “secular stagnation”. These included (1) An aging population; (2) Declining labor share of GDP; (3) Worsening income and human capital inequalities; (4) Weak productivity growth; (5) Rising marginal cost of fossil fuel production; and (6) High debt levels, whose sustainability in an era of slow growth depended on the maintenance of historically low interest rates.
National Security
• Worsening relations between China and the United States, and, to varying degrees, between China and other nations.
• Slowing growth and very high levels of debt in China’s economy, which was very likely creating increasing pressures on the Xi Jinping regime, with very unpredictable consequences.
• Accelerating weakening of the European Union (e.g., Brexit).
Society
• Growing economic pressures on, and the shrinking size of the middle class in many developed countries.
• Even stronger pressures on the growing working class, as evidenced by a range of economic and social indicators, including disintegrating social networks, withering institutions, and rising “deaths of despair”.
• In many countries, growing alienation, falling confidence in traditional institutions (except the military), and intensifying popular anger at increasingly detached and ineffective elites.
Politics
• Rise of Left and Right Populism, growing polarization, and increasingly bitter political conflict in many developed countries, as traditionally stabilizing center left and right parties lost support.
• Growing evidence that governments were incapable of addressing critical issues, due to a combination of weakness in policy development, gridlock in policy debates due to interest group competition, and the increasing ineffectiveness of ossifying public sector bureaucracies in policy implementation.
Financial Markets
• Extremely high valuations across most asset classes, especially ten years into the post-2008 expansion, due to over-reliance on monetary policy and low interest rates to stimulate economies suffering from worsening structural problems.
• Very high government, personal, and corporate debt levels, with much of the latter provided outside the banking system, via high yield bonds, leveraged loans held in Collateralized Loan Obligation (CLO) structures, and credit hedge funds. Compounding the problem, a significant portion of this relatively illiquid corporate debt was held in vehicles (e.g., Exchange Traded Funds) that promised investors daily liquidity, which increased the risk of cascading market panic and debt deflation in a downturn.
At the end of December 2019, we here at The Index Investor were waiting for the arrival of the proverbial straw that would break the camel’s back. Instead, we got a boulder, in the form of a global coronavirus pandemic.
In the following sections, we will assess the potential impact of COVID19 on the key uncertainties we identified in our January 2020 feature, “Global Macro Risk Dynamics in the 2020s and Beyond.” This will include probability forecasts for specific questions related to the broad uncertainties we identified, and probability forecasts for the scenarios that could be produced by the interaction of these uncertainties.
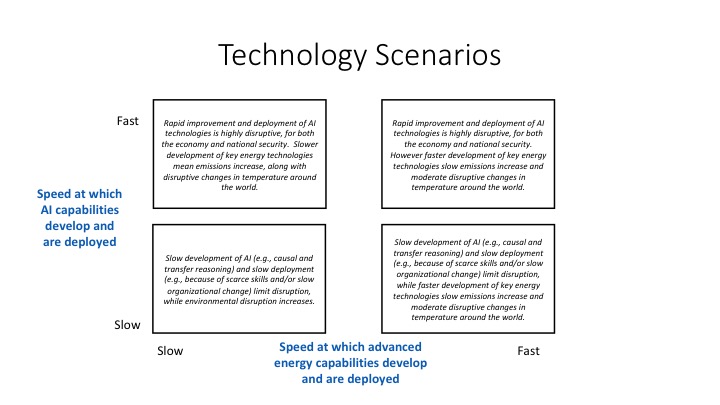
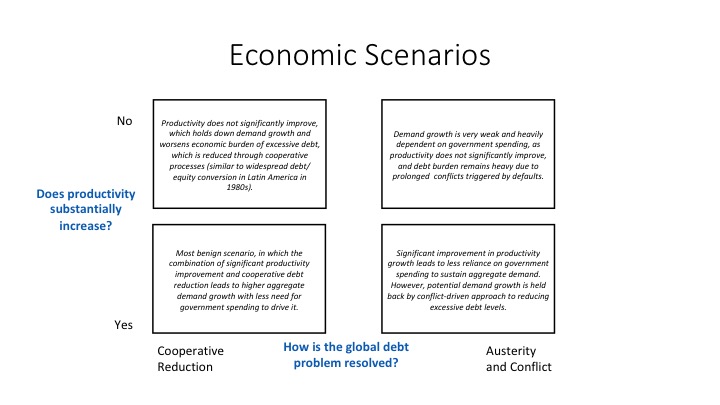
As you will see, the scenarios that follow are consistently presented, so that the most benign outcome is in the lower left quadrant, and the most challenging is in the upper right quadrant.
Technology: The two uncertainties driving these scenarios are:
(1) The speed at which artificial intelligence capabilities (possibly enhanced by quantum computing technologies) develop and are deployed (e.g., their deployment will increase the speed at which many activities and processes are carried out, and may also, depending on the rate at which education systems improve, require fewer human workers).
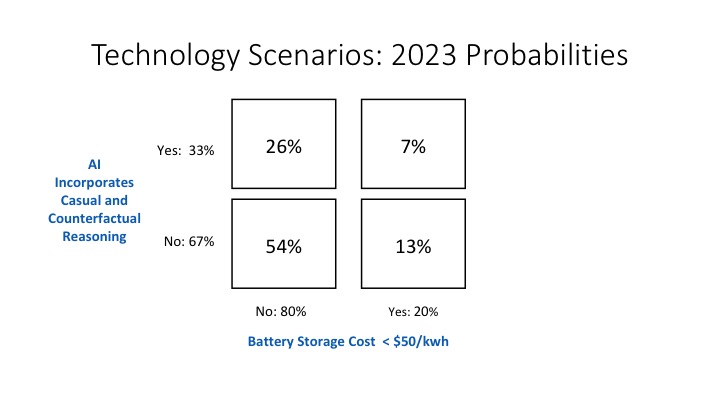
a) Forecasting Question: What is the probability that, by the end of 2023, AI will have acquired a general capacity for causal and counterfactual reasoning that can easily be applied in evolving (non-stationary) environments? This will almost certainly lead to much more widespread deployment of AI. Outcome test: both Gary Marcus and Judea Pearl (two leading authorities in this area) will agree that these capabilities have been developed.
b) Impact of COVID19: Minimal on development. However, if there are still many people unemployed in 2023, if this goal is reached its actual deployment could be constrained.
c) Forecast: 33%. The achievement of this goal will very likely be based on significant departures from the currently dominant paradigm in AI, which is based on neural networks and deep learning. Instead it will require substantial development in symbolic representation and manipulation, which are not areas that today receive nearly as much funding as the dominant paradigm.
(2) The speed at which advanced energy technologies (e.g., batteries and other energy storage, grid control, solar, and carbon capture) are developed and reach a level of cost effectiveness that allows them to be effectively deployed at scale without sharply increasing consumer energy prices.
a) Forecasting Question: What is the probability that the capital cost per kilowatt-hour of utility scale battery storage will be less than or equal to $50 by the end of 2023. Based on recent research, this is the threshold required in order for combined solar/storage electric generation to begin to displace significant amounts of fossil fuel and nuclear generation capacity (see, “Storage Requirements and Costs of Shaping Renewable Energy Toward Grid Decarbonization”, by Ziegler et al).
b) Impact of COVID19: Minimal, unless subsequent rounds of government stimulus spending accelerates the deployment of alternative battery storage technologies.
c) Forecast: 20%. Cost projections for utility scale battery storage forecast best-case capital costs of about $170/kwh by 2025 (“Cost Projections for Utility-Scale Battery Storage” by NREL and “The New Rules of Energy Storage” by McKinsey). However, other, though less mature, storage technologies (e.g., flow and solid state batteries) have the potential to deliver substantially lower costs.
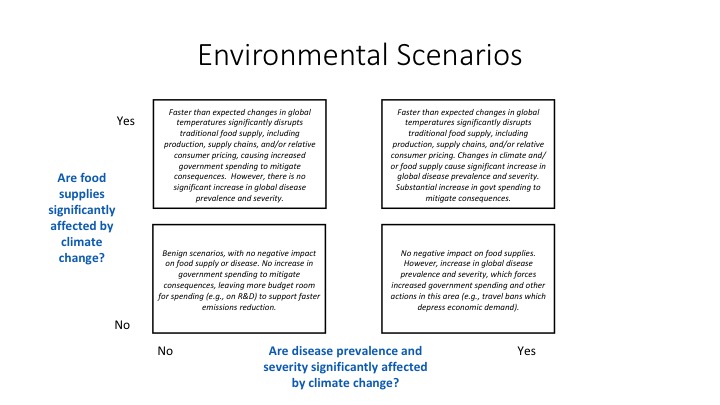
(1) Whether food supplies are significantly affected by climate change.
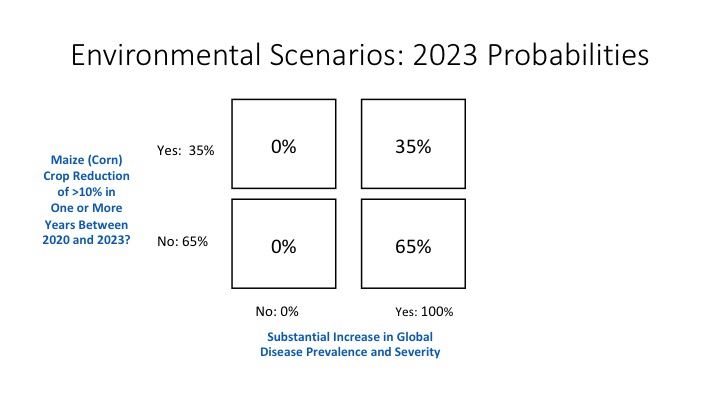
a) Forecasting Question: What is the probability that maize (corn) production in the world’s four largest producing countries (US, China, Brazil, and Argentina) will experience a decline of 10% or more at any time between 2020 and 2023?
b) Impact of COVID19: Slow global recovery from the coronavirus pandemic should reduce the annual increase in emissions and, in the absence of increased solar activity, global warming.
c) Forecast: In “Future warming increases probability of globally
synchronized maize production shocks”, Tigchelaar et al find that if average global temperature increases by 2 degrees Celsius versus the 1850-1900 baseline, there will be a 7% chance each year that corn production in the world’s four larges producers will decline by more than 10%. Below 2 degrees, the probability is estimated to be minimal. In its most recent Decadal Forecast, the UK Met Office estimates that there is a 10% chance that the increase in global temperature versus the 1850-1900 baseline will exceed 1.6% by 2024.
Conservatively, assume that the annual probability of a 10% production decline equals 7% x 10% or about (rounding up) 1% per year. This leads to a probability of not experiencing a crop production decline is therefore 1-(.994), or about 4%.
However, NASA projects that the 2020 to 2025 solar cycle will be the weakest in the last 200 years, which could lead to lower than average temperatures that could also cause crop losses (e.g., see, “Do Sunspot Cycles Affect Crop Yields?”, by Vernon Harrison of the US Department of Agriculture, which found annual falls in Illinois and Nebraska corn yields of between 8% and 10% during years of low solar activity). Based on this limited solar data (which does not include the impact on maize output in China, Brazil, and Argentina), I increase the annual probability of a 10% decline in annual maize production between 2020 and 2025 to 10%. This increases the cumulative probability of a decline of 10% or more in annual maize production in any year between 2020 and 2023 to 35%.
(2) Whether infectious disease prevalence and severity are significantly affected by climate change.
a) Forecasting Question: Will the world experience a substantial increase in global disease prevalence and severity between 2020 and 2023?
b) Impact of COVID19: It has increased the probability to 100%.
c) Forecast: 100%
(1) Whether and to what extent the average rate of productivity growth increases.
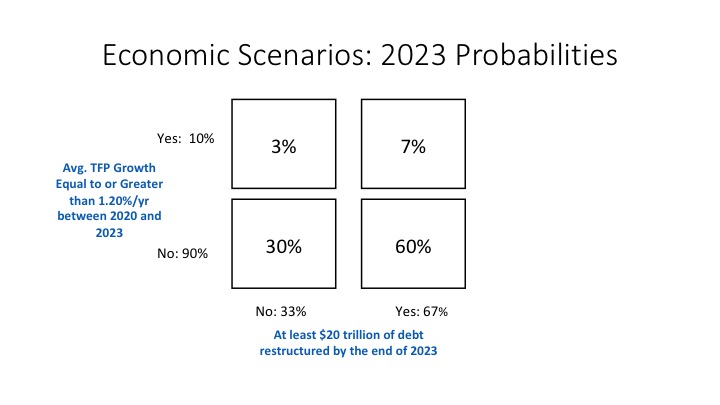
a) Forecasting Question: Given an aging population and (in the absence of immigration) shrinking workforce, increasing productivity growth is critical to raising living standards. Between 2009 and 2018, US total factor productivity growth averaged 0.84% per year, compared to 1.19% in the previous decade (based on OECD data). What is the probability that between 2020 and 2023, average US total factor productivity growth will equal or exceed 1.20% per year?
b) Impact of COVID19: Thus far, the arrival of COVID19 has been a massive negative shock to productivity, due to quarantining and the implosion of global demand. Between 2020 and 2023, its impact on productivity will depend on how soon productivity reducing factors like quarantines and social distancing are reduced, how fast both aggregate supply and demand recover, and the changes that are made to economic processes (e.g., home vs. office working, government support for innovation, industry structure, regulations, etc.).
c) Forecast: 10%. There is considerable tail risk associated with the time required to develop and deploy an effective coronavirus vaccine, which could result in intermittent social distancing. The slow recovery of the economic demand and employment could also result in constraints on the deployment of productivity increasing automation and artificial intelligence technologies if they were likely, on a net basis, to destroy jobs. To a substantial degree, this depends on the extent to which the US education system improves its results, since more capable workers speed the absorption across the economy of productivity increasing innovations. Unfortunately, there are substantial institutional barriers to improving US education results, and base rate data suggests they will not be significantly overcome before 2023, even in the wake of a dramatic increase in remote learning after COVID198 arrived.
(2) How the global debt problem (including governments’ off balance sheet liabilities for future pension and healthcare costs) is resolved.
a) Forecasting Question: Before COVID19 arrived, there were many signs that excessive debt had become a significant driver of weakening aggregate demand growth, which, (along with central bank monetary policy) had in the short term led to extremely low interest rates that made the growing debt burden sustainable. Based on Bank for International Settlements (BIS) data (the IMF has another debt dataset), at the end of September 2019, Emerging markets nations owed USD $57 trillion in debt (15 government, 29 non-financial corporate, and 14 household), while advanced countries owed $124 trillion (47, 43, 34). In total, this amounted to $181 trillion in debt, or 2.1x global GDP of USD $86 trillion.
Assume the average nominal interest rate on this debt was around 6.5% (say, 3.0% real) annual interest payments alone on this debt mountain required about 12% of global nominal GDP. And since, before COVID19, real global GDP was only growing at about 3% or so per year, the world was already very close to the threshold of the “debt trap” (where the real interest rate is greater than the real growth rate) in which outstanding debt would grow uncontrollably. Commentators like William White (formerly of the BIS and now at OECD) believed that these global debt levels had reached a level where prospective economic growth could not sustain them, and that massive restructuring (e.g., via write-offs and/or debt/equity conversions) would be necessary to return to the global economy to a health and sustainable growth path.
In light of this, here is our forecast question: By the end of 2023, at the global level, will at least USD $20 trillion dollars in individual, corporate, and emerging market debt (of all kinds) have been restructured (including write-offs, extensions, and debt/equity conversions)? Note that this amounts to about 15% of emerging markets plus advanced non-financial corporate and household sector debt. In comparison, in the case of the 1980s Latin American debt crisis, private lenders wrote off or converted to equity about 33% of the debt they were owed.
b) Impact of COVID19: The pandemic has dramatically increased government issuance of new debt (and to a lesser extent corporate issuance). Much of this newly issued new government debt has been monetized by central banks and held on their books. The sharp reduction in global demand has almost certainly made it extremely difficult or impossible for borrowers to service a substantial – but as yet unknown – portion of the global debt load.
c) Forecast: 67%. Fundamentally, there are only four ways to solve the problem of excess debt: (1) Grow your way out of it. Given the headwinds already facing global aggregate demand before COVID19, and its negative impact, this approach is very unlikely to succeed. (2) Impose prolonged austerity to facilitate debt repayment. In today’s political environment, this would very likely be suicidal. (3) Inflate it away. This only works when debt has a relatively long average maturity, and is denominated in the currency of the country trying to inflate away its debt. For a substantial portion of outstanding global debt, these conditions do not hold. In addition, imposing high inflation on an economy after the COVID19 shock would almost certainly have negative social and political consequences. That leaves (4) writing off, converting to equity, or otherwise restructuring a portion of outstanding debt to reduce the burden it imposes on the economy, and free up funds to stimulate spending and renewed economic growth.
On the other hand, it is undeniable that creditors have a substantial amount of political power, and will likely try to use it to minimize debt write-downs. However, as we have seen in Japan, avoiding debt restructuring keeps alive many so-called “zombie” companies whose continued existence tends to depress productivity growth.
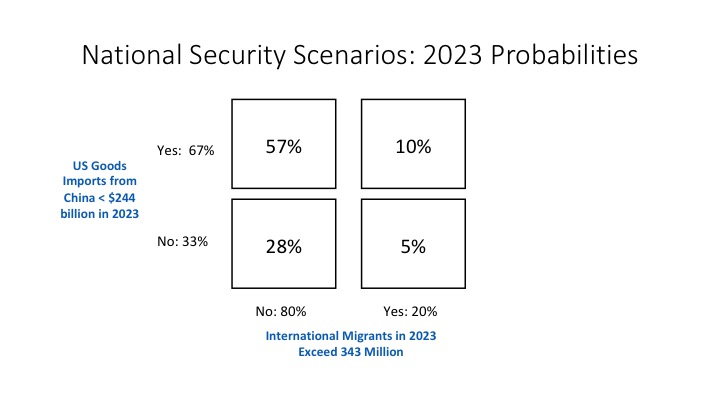
(1) Whether the China-US conflict intensifies.
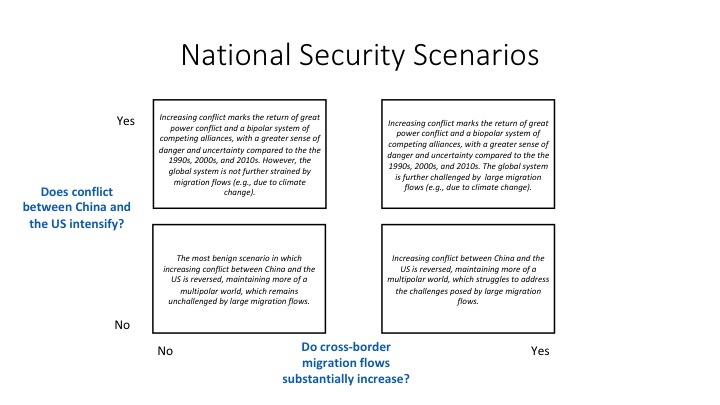
a) Forecasting Question: While there are many dimensions of the US-China conflict, one of the easiest to measure is trade in goods. Over the five years ended in 2019, the US spent an average of $488 billion per year on goods imported from China. If the conflict between the two nations intensifies, these flows should shrink. Hence, our forecasting question is this: In 2023, will US imports from China (expressed in 2019 dollars) be less than $244 billion (i.e., 50% lower than the five year average)?
b) Impact of COVID19: The pandemic has increased distrust between the US and China, and should also convince many companies to shorten their supply chains and produce more previously imported goods in the United States. Worsening relations between the two nations, and increasingly onerous Chinese regulatory requirements (e.g., sharing of intellectual property) had already spurred the movement of production out of China and into other Asian countries (e.g., Vietnam). Worsening US-China relations after COVID19 should accelerate this trend.
c) Forecast: 67%. If this forecast turns out to be wrong, the most likely reason will be a change in both nations’ leadership. However, this would also require a substantial change in many policies China has put in place in recent years (which may not be politically possible, even for a new leader). It would also require reversal of US attitudes towards China, which in recent years have considerably hardened across the political spectrum.
(2) Whether cross-border migration flows substantially increase.
a) Forecasting Question: Between 2010 and 2019, international migration flows (as estimated by the UN, in their “International Migrant Stock” database) grew at a compound rate of 2.92% per year, with the number of migrants reaching 272 million in 2019. Will the number of international migrants in 2023 exceed 343 million (compound growth of 6% per year between 2019 and 2023)?
b) Impact of COVID19: If the pandemic has a substantial impact on countries in Africa, the Middle East, Latin America, and South Asia, it will very likely increase motivations to migrate.
c) Forecast: 15%. COVID19’s effects will almost certainly increase resistance to inward migration in nations many migrants seek to reach (e.g., because of fears of importing disease, and/or continuing high unemployment in a still weak economy). Border conflicts will very likely increase, which will discourage large-scale migrant flows.
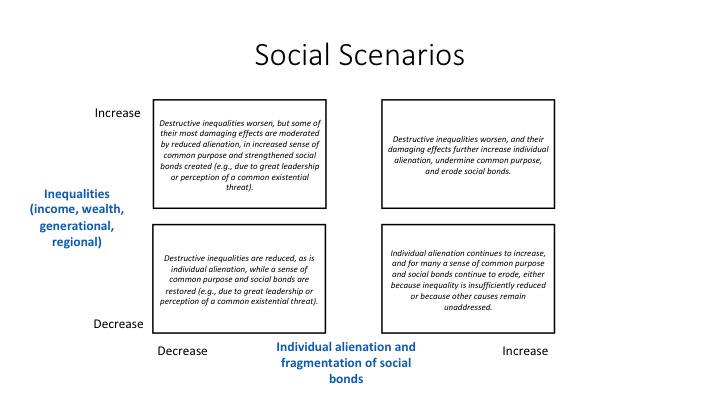
(1) Whether income, wealth, generational, and regional inequalities decrease or increase.
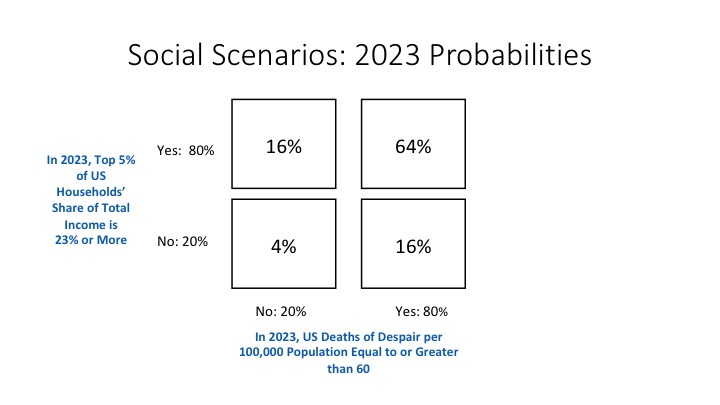
a) Forecasting Question: Based on Census data, in the United States the top 20% of Households earned 44% of Household Income in 1980. The top 5% earned 17%, and the next 15% earned 27%. By 2018, the top 20% share was 52%, with the top 5% share 23% and the next 15% share 29%. It is interesting to note that almost all (five out of six percent) of the increase in the top 5%’s share came between 1980 and 2000, with just another 1% increase coming between 2000 and 2018. This suggests that the financialization of the economy may have had a bigger impact on the top 5%’s income share than did globalization and the growth of “winner take all” technology-driven markets since 2000.
Our forecasting question is this: In 2023, will the top 5%’s share of US income still be equal to or greater than 23%?
b) Impact of COVID19: Extended weak economic growth would very likely cause declines in asset values, reducing capital gains, interest, and dividend income of the top 5%, and in some cases, their labor income as well. Lower earners will also suffer income losses. Tax rates on top earners will almost certainly increase if the Democrats win the White House and both houses of Congress. Even if this doesn’t occur, a tax increase is likely, given the amount of debt being incurred by the US government to fund its response to COVID19.
c) Forecast: 80%. First, because of their political donations, top earners will be able to effectively resist calls for much higher taxes. Second, COVID19 will very likely cause a great reduction in incomes in the middle and lower quintiles of the US income distribution than it will at the top. This may even result in an increase in the top 20% and 5%’s share, despite absolute declines in their income.
(2) Whether the level of individual alienation and fragmentation of social bonds and cohesion decreases or increases.
a) Forecasting Question: The Social Capital Project of the Joint Economy Committee of the US Congress (JEC) has created a data set measuring annual “Deaths of Despair” per 100,000 population. The theory advanced by Anne Case and Angus Deaton (in their book, “Deaths of Despair and the Future of Capitalism”) is that these deaths are closely related to the deterioration of prevailing social and psychological conditions. The JEC report on “Long Term Trends in Deaths of Despair” found that, “In 2000, there were 22.7 deaths of despair per 100,000 Americans — not that different from the 1970 rate of 21.5. By 2017, the rate had doubled to 45.8 per 100,000.” In 2018 it dipped slightly to 45.3. Between 2009 (the first year after the Great Financial Crisis) and 2018, Deaths of Despair per 100,000 at a compound annual rate of 4.5%.
Our forecasting question is this: In 2023, will the rate of Deaths of Despair, as measured by the JEC, be equal to or greater than 60 per 100,000? This number assumes that the rate grew by 4.6% per year through 2019, and then increased by 50%, to 6.75% per year, between 2019 and 2023.
b) Impact of COVID19: The social distancing and quarantining required to combat the coronavirus pandemic, and its likely economic aftermath, will probably further weaken many people’s social bonds and worsen their psychological stress and mental health.
c) Forecast: 80%.
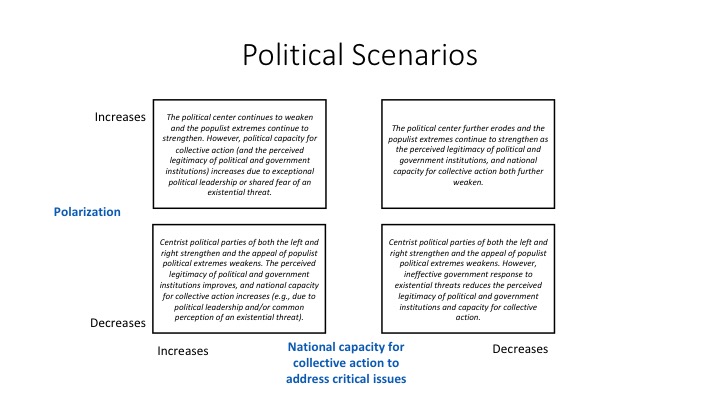
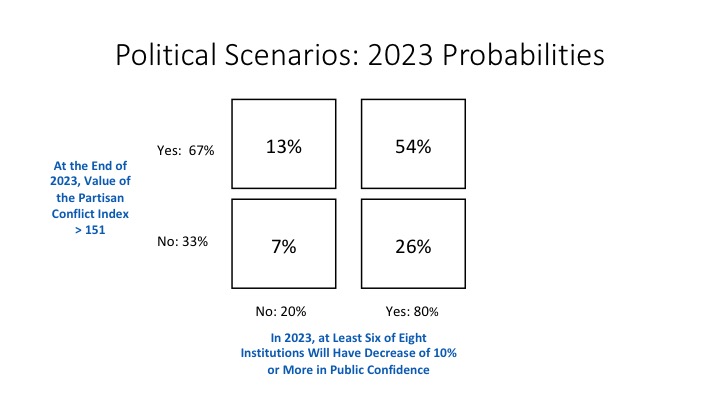
(1) Whether political polarization increases or decreases.
a) Forecasting Question: There is evidence that worsening political polarization (what some have called “the cold civil war”) has had a significant negative impact on investment, output, and employment in the United States (see, “The Political Polarization Index” by Marina Azzimonti of the Federal Reserve Bank of Philadelphia). For example, the Philadelphia Fed’s monthly “Partisan Conflict Index” had an average value of 94 between its start in January 1981 and December 2007. However, between January 2008 and December 2015, its average increased to 130, indicating rising partisan conflict. Azzimonti’s research has shown that this increased uncertainty, which in turn contributed to the slow recovery from the Great Recession). Most recently, between January 2016 (the start of the last presidential campaign) and February 2020, the index average rose even higher, to 167. At the end of February 2020, it stood at 151.
Our forecasting question is this: Between February 2020 and the end of December 2023, will the average value of Partisan Conflict Index be greater than 151?
b) Impact of COVID19: It is not obvious how COVID19 will affect partisan conflict in the United States. We have already seen such conflict over the way the pandemic has been handled thus far. A key question is whether conflict will intensify during and after the November election, as it did in the lead up to and years since the 2016 election. It seems likely that, regardless of who wins in November, much will depend on the effectiveness of America’s evolving response to COVID19 between now and December 2023.
c) Forecast: 67%. For a growing number of people, in recent years their political orientation has evolved from one of many identifies to a meta-identity that is more closely correlated with other identities (e.g., class, race, gender, geographic location, the sector in which one works, religion, consumer preferences, etc.) than ever before. This suggests that a higher degree of partisan conflict is now “hardwired” into the American political system, and indeed into the culture itself. It is possible that, as was the case in America after 9/11 or New Orleans after Katrina, a very effective national response to COVID19 could reduce political polarization, at least for a time. But it seems unlikely.
(2) Whether national capacity for taking collective action to address critical issues increases or decreases.
a) Forecasting Question: National capacity for taking effective national action in the face of potentially existential threats is not only a critical element of national power, but also a key driver of public respect for and belief in the institutions of government and society more broadly. COVID19 is currently testing this capacity in many nations.
Each year, Gallup polls Americans’ confidence in various institutions. In 2019, the percentage expressing “a great deal” or “quite a lot” of confidence in different institutions was a follows: (1) The Presidency 38%; (2) Congress 11%; (3) Medical System 36%; (4) Banks 30%; (5) Big Business 23%; (6) Public Schools 29%; (7) TV News 18%; and (8) Organized Religion 36%.
Our forecasting question is this: In 2023, will at least six of these institutions see an decrease of 10% or more in the percent of people expressing a great deal or quite a lot of confidence in them?
b) Impact of COVID19: Institutions’ response to COVID19 will have a very substantial, and likely lasting impact on the public’s confidence in them, and thus on national capacity for collective action in the face of future threats.
c) Forecast: 80%. Popular frustration with various institutions has been increasing since the number of COVID19 cases began to exponentially increase. If this forecast turns out to be wrong, it will be due to (a) the election in the United States of a broadly acceptable centrist government, (b) that placed in positions of leadership practical leaders of acknowledged competence, integrity, and empathy, who collectively worked to (c) enact and implement policies that addressed the deep structural problems that, before COVID19, led to a recognized increase in “secular stagnation.”
There is still a very high degree of uncertainty about how the COVID19 crisis will evolve, and the impact it will have on the global macro system, broadly defined.
Through the use of trend and scenario analysis, as well as specific forecasting questions, this article has provided a structured framework for evaluating the uncertainties that underlie the high level of anxiety about the future that most of us feel today.
The conclusions that emerge from this analysis are neither as bad nor as good as they could be.
Between 2020 and 2023, it seems unlikely that we will see the deployment and scaling of substantially improved artificial intelligence and efficient utility scale battery storage technologies, both of which would have disruptive impacts on employment.
In the area of the environment and health, the global pandemic that we previously cited as a critical uncertainty has arrived. The other major uncertainty is a possible disruptive reduction in food supplies due to environmental changes. This could increase food prices and trigger social and political unrest. The specific forecasting question focused on a fall of 10% or more between 2020 and 2023 in the production of maize/corn, the world’s largest grain crop. We believe this is more probable than most people realize, in part because of the impact of the impending low solar cycle on global temperatures.
In the critical area of the economy, we conclude that the probability of a significant increase in average productivity growth between now and 2023 is, unfortunately, low. If the focus of governments’ response to COVID19 remains returning the economy to the December 2019 status quo ante, any victory won will be Pyrrhic, as that economy was facing multiple headwinds that were intensifying a “secular stagnation” that eventually would have triggered a global crisis. If the economy is to recover (with attendant social and political benefits), government interventions must address the deeper root causes at work. But there is, as yet, no sign that this is going to happen.
Compared to our bleak outlook for productivity growth, we are more confident that we will see substantial debt restructurings, equity conversions, and write-offs. However, due to the political power of creditors, we forecast that, as a percentage of total debt, the amount restructured will likely fall well short of the 33 percent of debt that was restructured to resolve the Latin American debt crisis and restore healthy growth. As a result of this policy failure, high debt levels will likely remain a structural drag on economic growth and slow or block recovery from the COVID19 shock.
In the area of national security, we conclude that conflict between the US and China will continue to increase. The good news is that the lingering effects of COVID19 in China are likely to restrain its external ambitions, and perhaps eventually trigger a change of leadership.
We also conclude that stricter (and more conflict laden) control of developed nations’ borders will ultimately limit the international migration flows (and domestic disruption in destination countries) that the devastating impact of COVID19 would otherwise likely trigger.
With respect to social uncertainties, we do not expect a reduction in current levels of inequality in the United States. We also expect that COVID19 will accelerate the fraying of the social fabric, and result in an increase in deaths of despair. Social pressures will likely intensify.
Politically, the net result of all these developments is likely to be increased polarization and partisan conflict (supercharged by what promises to be a uniquely bitter presidential campaign), as well as further declines in public confidence in many institutions. Together, these developments will further sap national capacity for collective action.
The bottom line is that we believe that investors (and the valuations to which their beliefs give rise) are currently over-optimistic, and have not given sufficient weight to a scenario in which recovery from the COVID19 shock will be far more difficult, and take much longer than many now believe.
Finally, two caveats are in order.
The first is that these forecasts must be updated in light of new high value information, including high likelihood indicators and surprises. We will do that, and update these forecasts in future issues.
The second is that the accuracy of a forecast is usually increased when it is combined with other forecasts that are based either on a different methodology and/or different information inputs. As always, we strongly recommend that forecasts made by The Index Investor be combined with those obtained from other sources.
If you have any questions about anything we have written in this issue, please don’t hesitate to get in touch, at contact@indexinvestor.com