The Index Investor
September 2019
Market Stress Indicators
Macro Regime Forecast
Tactical Asset Allocation Implications of Our Forecasts
Pre-Mortem Analysis
Critical System Thresholds/Tipping Points Analysis
Combining and Extremizing Forecasts to Improve Predictive Accuracy
High Value Information Observed Last Month
Feature Article: Future Labor Productivity Growth: The Supply Side Secular Stagnation Story
Appendix: Anticipatory Thinking and Forecasting Methodologies
Asset Class Valuation and Momentum Indicators (@31Aug19)
| Asset Class (ETF) | Valuation | 1 Month Return | Conclusion |
| US Real Return Govt Bond (TIP) | Likely Overvalued* | 2.33% | Increasing Overvaluation |
| US Nom Return Govt Bond (GOVT) | Likely Overvalued* | 3.34% | Increasing Overvaluation |
| US Investment Grade Credit (LQD) | Close to Fairly Valued* | 3.88% | Close to Fairly Valued |
| US High Yield Credit (HYG) | Almost Certainly Overvalued* | 0.69% | Increasing Overvaluation |
| US Commercial Property (VNQ) | Likely Undervalued* | 3.75% | Decreasing Undervaluation |
| US Equity (VTI) | Likely Overvalued* | (2.08)% | Decreasing Overvaluation |
| Foreign Developed Mkt Equity (VEA) | Very Likely Undervalued* | (1.88)% | Increasing Undervaluation |
| Emerging Markets Equity (VWO) | Very Likely Overvalued* | (3.26)% | Decreasing Overvaluation |
| Timber (WY) | Almost Certainly Undervalued* | 3.54% | Decreasing Undervaluation |
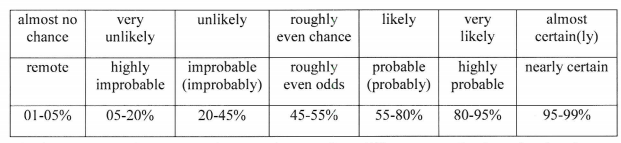
Note: The language we use to describe our estimated likelihood of asset class over or undervaluation is based on US Intelligence Community Directive 203 on Analytic Standards, which includes the following table:
Market Stress Indicators (@31Aug19)
| Market Stress Indicator | This Month vs Last Month |
| Asset Class Returns Autocorrelation (this month versus last month). Higher autocorrelation is an indicator of higher market stress. | .29 vs (.46) last month. Indicates a lower level of market stress compared to last month. |
| Economic Policy Uncertainty Index (how many days over the last 30 was index in top quartile of values since 1985?) | On 16 days the index was in the top quartile of daily values since 1984 (the 86th percentile of all rolling 30 day counts). This is a significant increase from last month. |
| AAA Rated Bonds Spread over 10 Year Treasury Yield (month end). Higher spreads indicate rising concern about market liquidity. | 1.35% (54th percentile since 1983), up from 1.24% last month. This is also considerably higher than in April 2018 when the liquidity spread was only 1.00%. |
| BB Rated Bonds Spread over 10 Year Treasury Yield (month end). High spreads indicate increasing credit risk. | 2.35% (19th percentile since 1996), essentially unchanged since last month. Extremely low after ten years without a recession. |
| Gold Price per Ounce in US Dollars (month end). Rising gold prices are an indicator of increasing market uncertainty and stress. | $1,526 vs $1,431, up 6.7% from last month. At the end of 2017, we estimated the "disaster premium" in the gold price was 47% (see our methodology in the Appendix). At the end of last month, the estimated premium was 65%. |
At the end of August, four out of our five indicators showed a higher level of underlying market stress. The lack of movement in the very low BB spread while gold prices significantly rose was particularly notable.
Macro Regime Forecast Probabilities (@31Aug19)
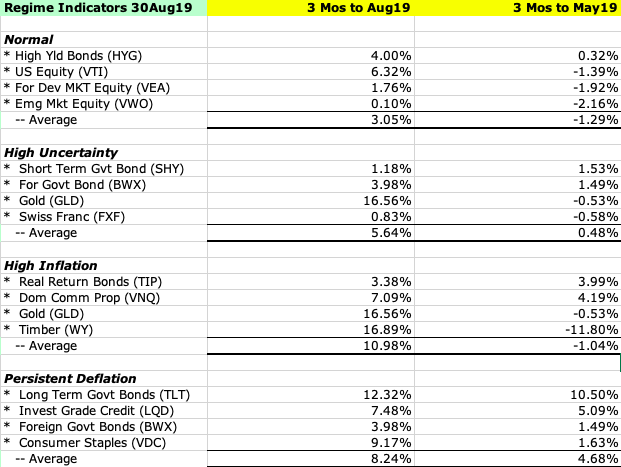
The Current State of Quantitative Regime Predictors
Our quantitative forecast methodology focuses on the level and change in three-month returns, over the most recent and previous three-month periods, for those asset classes, which should perform best under different regimes (in this sense, our regimes can be regarded as macro factors). We assume that higher returns are associated with a higher underlying probability for the relevant macro regime.
Qualitative Considerations
This month’s Evidence File (see below) summarizes the high value indicators and surprises we observed this month in the areas of technology, the economy, national security, society, politics, and investor and financial market behavior. Here are the most important ones that affected how we updated our regime probabilities this month.
As has often (but not always) been the case in my life, market action in August was relatively muted, which gave many observers time to reflect on bigger picture issues, and the overall state of the global system. Of the reflections that were published this month, few if any were uplifting or optimistic.
Instead, they have likely reinforced readers’ already heavy sense of foreboding, and fears that the complexity of today’s challenges outstrips the capacity of current political governance systems to successfully address them. As we wrote in last month’s feature article, a regime change is coming that will very likely be one the world has not seen for many years.
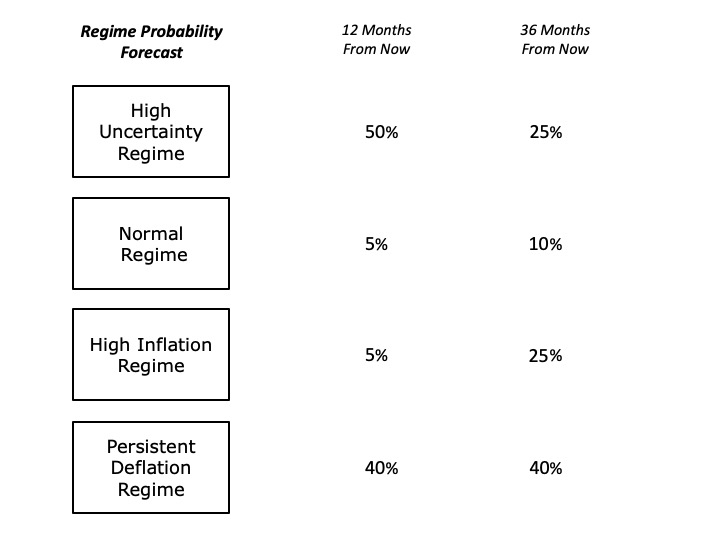
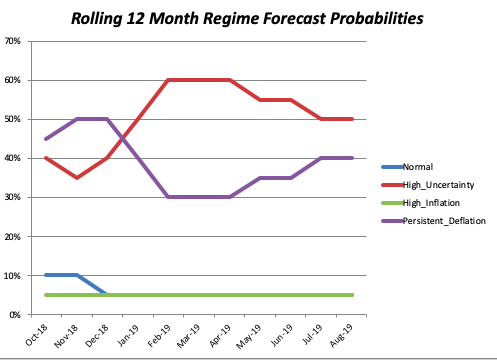
That said, there was not sufficient new evidence this month to justify any changes to our current probability forecasts for different macro regimes.
Tactical Asset Allocation Implications of Our Forecasts
Based on subscriber requests, this month we are re-introducing a feature from the previous version of The Index Investor: Tactical Asset Allocation Implications from our analyses.
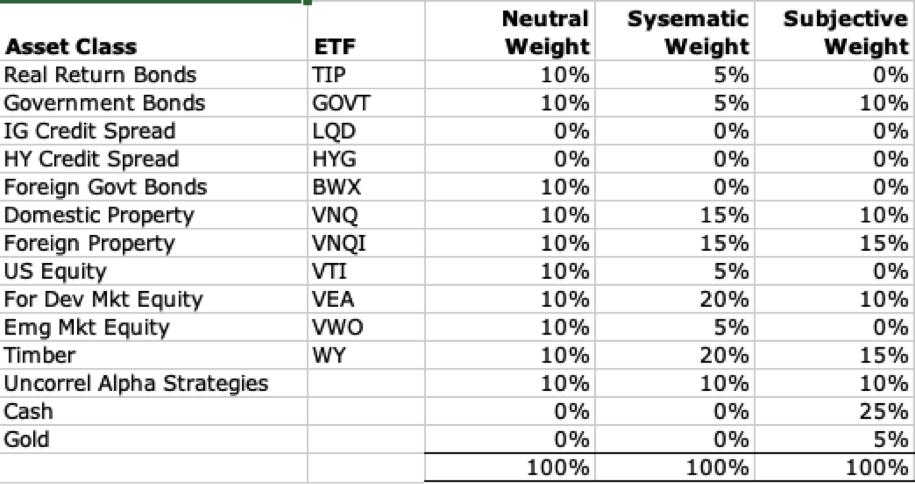
These take two forms. The first takes a systematic approach, and is based on relative asset class valuations. Our starting point is our “neutral” model portfolio, which is equally weighted across nine broad asset classes, and also includes a 10% allocation to alpha strategies (equity market neutral and global macro) that are designed to have a low correlation to returns on broad asset classes. Based on asset class valuations, we systematically vary the asset class weights (but not the active strategy weight), increasing from 10% to 15% when an asset class is likely undervalued, and 15% when it is very likely undervalued. In the case of overvaluations, we go to 5% and then into cash, if there are no undervalued asset classes with room for an increase. In effect, this replicates the systematic rebalancing strategy we used for 15 years in our previous model portfolios.
The second tactical approach is based on our subjective view not only of current asset class valuations, but also of the implications of the broader macro trends and uncertainties that we analyze each month. Importantly, this subjective view reflects our primary goal of avoiding large downside losses, rather than seeking large upside gains.
Two final notes. First, with respect to US fixed income, we include credit products (investment grade and high yield) in the same asset class as government debt, and will shift into the former when their valuations become attractive. Second, we regard gold not as a separate asset class to be held long-term, but rather as a complement to cash, into which we shift in periods of substantial overvaluation across multiple asset classes.
Here are our tactical asset allocation views at the start of September:
Pre-Mortem Analysis
One of the most important forecasting disciplines is to ask yourself why your forecast could be wrong. Dr. Gary Klein’s research has shown that a very powerful and insightful way to do this is via a “pre-mortem analysis.” This method asks you to assume that it is a point in the future, and your forecast has been proven wrong (or your strategy or company has failed). You are then asked to look backward from this imagined point in the future, to explain why you failed, what you missed, and what you could have done differently to avoid your fate.
The pre-mortem method takes advantage of the fact that humans reason much more concretely and in more detail when explaining the past than they do when trying to forecast the future.
So let us assume that it is one year from now, and our current forecast has turned out to be wrong.
How did this happen? What developments did we fail to anticipate? Here are three possibilities:
The leaders of the world’s three major powers – Xi Jinping, Donald Trump, and Vladimir Putin are all facing weakening economies and declining political popularity. History teaches us that this can lead to increased “foreign adventurism” to distract the public from worsening domestic conditions, as a nation rallies around its leader in a period of heightened external conflict. Should a “kinetic” conflict develop between China and the United States, or between Russia and one or more European countries, it would generate a sharp increase in uncertainty that would likely cause an equally sharp economic slowdown and, given high debt levels, speed the arrival of the Persistent Deflation Regime.
As we have previously noted, while the probability is remote, a supply side shock of some type could produce a sudden increase in inflation – the most likely scenario being a reduction in oil supplies due to a kinetic conflict in the Middle East (e.g., escalation of the current US-Iran conflict) that produced a prolonged disruption in global oil supplies, or, less likely, an infectious disease pandemic or major crop failures (e.g., due to climate change and/or disease).
While we believe it is very unlikely, we can envision a scenario in which for a range of possible reasons, both Xi Jinping and Donald Trump leave their current roles, and are replaced by leaders who are more committed to lessening conflicts both between China and the United States and in the international system as a whole. This would likely provide a strong boost to confidence (and thus lead to an equally strong reduction in uncertainty). Whether this would also create an opening for a reduction in domestic political conflict in the United States, and thus progress on policy reforms to address weak growth and rising inequality isn’t clear.
System Tipping Points/Critical Threshold Analysis
Like Professors Andrew Lo, Doyne Farmer and others, we regard financial markets as a complex adaptive system (CAS), that exist as part of a larger macro system comprised of other CAS between which there are multiple feedback loops. These other systems include those that produce technology innovations, and economic, environmental, national security (including cyber), social, demographic, and political outcomes.
We also find that these systems tend to operate and generate effects in a rough chronological sequence, albeit with many feedback loops between them. The following chart highlights that the changes we observe in different areas at any point in time are actually part of a much more complex evolutionary process.
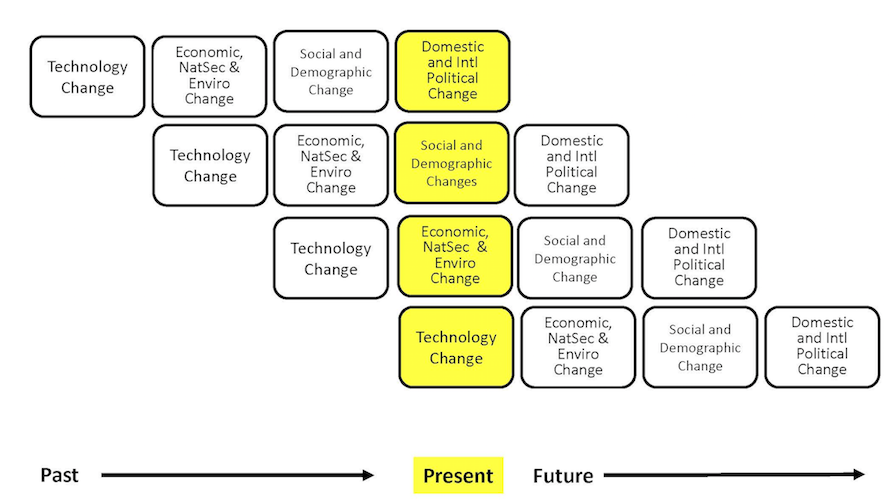
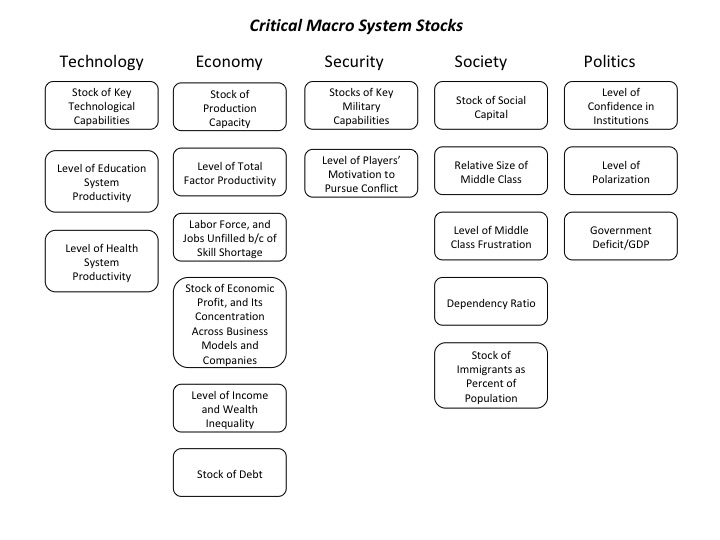
While most media coverage of these systems focused on flows (e.g., the size of the government deficit), rapid non-linear change in complex adaptive systems is often caused by a key stock (e.g., the amount of outstanding government debt) exceeding a critical threshold.
The next table highlights the key macro system stocks that we monitor.
In the next section, we will discuss information received over the past month that is related to these stocks, and which we believe is significant to our assessment of the probabilities that a critical threshold will be reached and a regime change will occur. We will conclude with our estimate, at the end of this month, of how close the macro system is to these critical thresholds, and the implications for financial market regime change probabilities.
How Close is the Macro System to One or More Critical Thresholds?
As we have noted, the macro drivers of financial market regime changes typically follow a rough chronological sequence, from technology to economic, security, social, and political causes and effects. Yet there are many feedbacks loops between them, creating complex root causes for many of the critical thresholds we have identified.
Understanding the time dynamics in this complex system is critical to avoiding substantial downside investment risk.
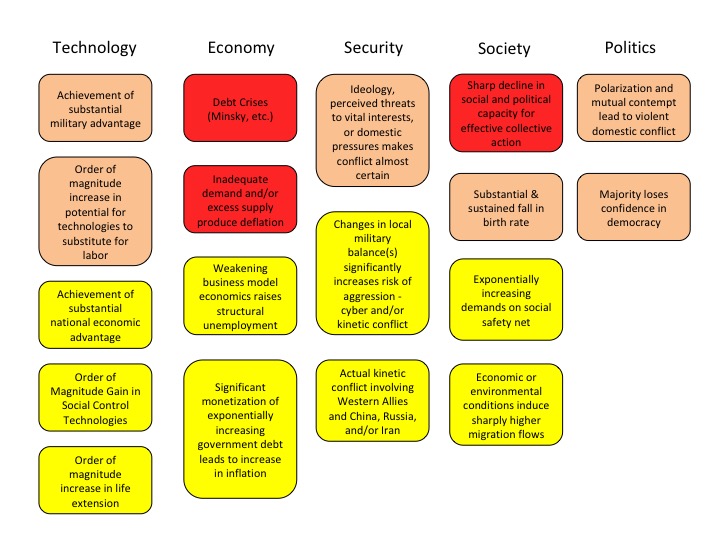
We use the UK Met Office Warning Model to communicate our assessment of these time dynamics. We estimate the time remaining before a critical macro system threshold is reached that could trigger a regime change, which is usually accompanied by substantial changes in asset class valuations.
The model uses three increasingly serious levels of warning, from “Be Aware” (condition yellow), to “Be Prepared” (condition orange), to “Take Action” (condition red).
For our purposes, we denote as “Be Aware” (yellow) critical thresholds that we assess to be three or more years away. We estimate that “Be Prepared” (orange) thresholds could be reached within 1 to 3 years. “Take Action” thresholds are very likely to be reached within one year.
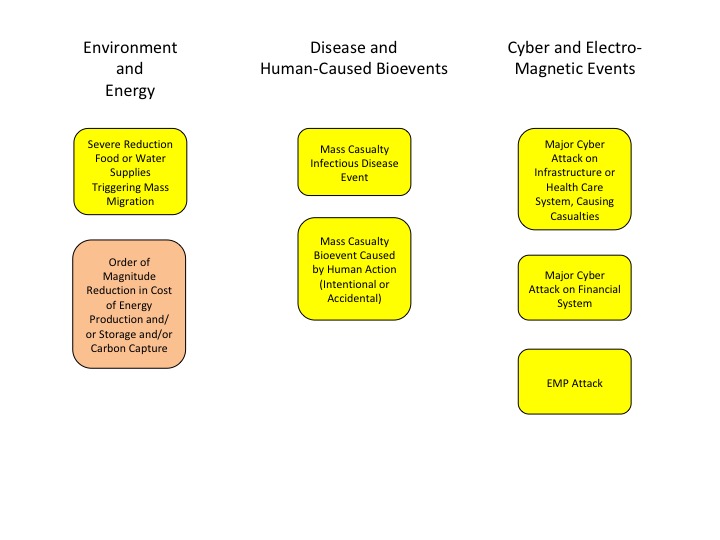
Given their nature, we also note that in our three “wildcard” areas (Environment and Energy related; Disease and Human Caused Bioevents; and Cyber and Electromagnetic Events), our forecasts have higher levels of uncertainty.
The following charts summarize our current estimate of the time remaining before different critical thresholds will be reached.
At the highest level, we believe the complex adaptive global macro system can be in one of four states, based on its degree of order versus disorder, and degree of social cooperation versus conflict. A very coarse-grained reading of history suggests that these states evolve in a predictable cycle, from ordered/cooperative, to disordered/cooperative, to disordered/conflicted, to ordered/conflicted.
We believe that the system is currently in its most uncertain state, characterized by high degrees of underlying disorder and social conflict, both domestically and internationally. Beyond some point, intensifying conflict eventually increases the degree of order in the system. That appears to be happening now, via the increasing conflict between China, Russia, and Iran and the United States and other Western nations.
Note: Combining Our Forecasts with Others From Other Sources and Extremizing the Result Should Increase Your Predictive Accuracy
Research has found that three steps can improve forecast accuracy. The first is seeking forecasts based on different forecasting methodologies, or prepared by forecasters with significantly different backgrounds (as a proxy for different mental models and information). The second is combining those forecasts (using a simple average if few are included, or the median if many are). The final step, which significantly improved the performance of the Good Judgment Project team in the IARPA forecasting tournament, is to “extremize” the average (mean) or median forecast by moving it closer to 0% or 100%.
Forecasts for binary events (e.g., the probability an event will or will not happen within a given time frame) are most useful to decision makers when they are closer to 0% or 100% than the uninformative “coin toss” 50%. As described by Baron et al in “Two Reasons to Make Aggregated Probability Forecasts More Extreme”, forecasters will often shrink their probability estimates towards 50% to take into account their subjective belief about the extent of potentially useful information that they are missing.
When you average multiple forecasters’ estimates, you are including more information, which should increase forecast confidence and push the mean estimate closer to 0% or 100%. However, this doesn’t happen when you use simple averaging. For this reason, forecast accuracy is increased when you employ a structured “extremizing” technique to move the mean estimate closer to 0% or 100%.
You can download an extremizing model from our website to use when combining the forecasts you use in your decision process.
The extremizing factors in our model are those that the Good Judgment Project found maximized the accuracy of combined forecasts. Note that the extremizing factor is lower when average forecaster expertise is higher. This is based on the assumption that a group of expert forecasters will incorporate more of the full amount of potentially useful information than will novice forecasters.
High Value Information Observed In August 2019
In our methodology, we classify new information as significant and highly valuable if either it (1) is an “indicator”, which reduces or increases our uncertainty about the value of a parameter in our mental model for making sense of the dynamic macro system, or (2) it is a “surprise” which increases our uncertainty about, and causes us to revaluate the structure of our mental model.
| New Technology Information: Indicators and Surprises | Why Is This Information Valuable? |
| “Understanding Model Behavior Using Loops that Matter”, by Shoenberg et al | SURPRISE Systems Dynamics models complex non-linear behavior as a function of system structure, in particular interactions between system stocks (e.g., the level of water in a bathtub) and flows (e.g., the rates at which water is flowing into and out of the tub), and interactions between many positive and negative feedback loops. Up to now, discerning the dynamic impact of feedback loop interactions has been more art than science. This paper “presents a new and distinct method to find the 'loops that matter' in generating model behavior. This is a numeric method capable of determining the impact for every loop in a model and identifying which dominate behavior at each point in time.” This new development, in combination with automation and artificial intelligence technologies, should accelerate our ability to model and explain the operation of complex systems. However, SD is a top down modeling approach, unlike Agent Based Modeling, which is a bottom up method. As such, it cannot capture the evolving strategies of individual agents, and the way they drive the evolution of system structure. Still, this new method is still a significant advance. |
| “Learning to Transfer Learn”, by Zhu et al from Google | SURPRISE Transfer learning – the ability to learn concepts in one context and apply them to significantly different contexts – is a fundamental aspect of fluid human intelligence that has thus far resisted replication via technology. This new paper highlights a new technique that has demonstrated a significant improvement in this area, which is critical to the continued development of artificial intelligence as a general purpose technology that can substantially increase productivity across the economy. |
| “Competitive Multi-Agent Deep Reinforcement Learning with Counterfactual Thinking”, by Wang et al | The authors note that a core challenge in improving artificial intelligence methods in complex real world applications involving multiple agents is, “to find the optimized action policies for AI agents with limited knowledge about their environment… traditional single-agent reinforcement learning approaches ignore the interactions and the decision strategies of other competitors.” The authors describe a new method that enables agents to speed their learning about the complex environment by generating counterfactual strategies and estimating not the reward they would have produced, but the amount of regret for not having chosen them. They use deep reinforcement learning to optimize agent decisions by minimizing expected regret, mimicking, in some ways, the cognitive and emotional processes of (some) human decision makers. This is another example of how progress in relatively narrow technical areas is laying the groundwork for much faster improvement in integrated AI methods in the future. |
| “Massive Multi-Agent Data-Driven Simulations of the GitHub Ecosystem”, by Blythe et al | This paper reports the results of one of the winning teams in a recent DARPA competition to use agent-based modeling and AI methods to accurately forecast the behavior of a very complex socio-technical system. It provides an excellent unclassified benchmark for the current state of development in this critical area. That said, there are two limitations to keep in mind while reading it. First, the forecast horizon was relatively short – one month. However, this involved the very complex interactions of three million agents. Second, the behaviors of most of these agents changed only slowly, unlike many other complex socio-technical systems (e.g., financial markets) in which behavior can change much faster, and is subject to non-linear jumps. |
| “Playing a Strategy Game with Knowledge-Based Reinforcement Learning”, by Voss et al | This is another excellent benchmark paper, that focuses on the use of another key technology: the integration of existing knowledge (including causal knowledge) into reinforcement learning. In this case, the target environment is FreeCiv, which is a version of the complex game Civilization, which is familiar to many and is more similar to complex real world challenges than simpler games like chess. Reinforcement learning is used as a method to efficiently integrate the knowledge of multiple experts into strategy development, and to learn and increase that knowledge over time. Again, the potential future application to complex real world challenges is clear; the key issue, into which this paper provides insight, is how fast these methods are maturing and approaching the point at which they can be deployed in financial, commercial and other applications. |
| “DeepMind’s Losses and the Future of Artificial Intelligence” by Gary Marcus | Gary Marcus has consistently questioned a lot of the hype that surrounds the current AI boom, and his writing is always thought-provoking. In his latest column, Marcus notes that, “DeepMind has been putting most of its eggs in one basket, a technique known as reinforcement learning. That technique combines deep learning, primarily for recognizing patterns, with reinforcement learning based on reward signals, such as a score in a game…The trouble is, the technique is very specific to a narrow range of circumstances…Current systems lack flexibility, and are unable to compensate if the world changes, sometimes even in tiny ways” (a point we have also often made). He also notes that an even more important issue is the difficulty, and often impossibility of explaining the results reached by deep learning algorithms (which are based on the very complex patterns it identifies in a data set), and thus the difficulty in persuading human decision makers to trust AI’s recommendations, particularly in an evolving environment. Marcus pointedly notes that because most challenging real world problems exist in complex, evolving environments, “DeepMind has yet to find any large-scale commercial application of deep reinforcement learning.” To his credit, Marcus also considers another conclusion: “it could simply be an issue of time” before commercial applications appear as AI technology improves. |
| | |
| | |
| | |
| | |
| | |
| | |
| | |
| New Economic Information: Indicators and Surprises | Why Is This Information Valuable? |
| Wharton Dean Geoffrey Garrett’s speech to incoming students was a sobering and succinct summary of the challenges we face today. | He noted “three intersecting geo-economic and geo-political trends: (1) After four decades of ever-increasing engagement between China and the United States, the world’s two leading powers seem increasingly determined to decouple their economies from each other—making a second Cold War a reality and superpower war more likely. (2) Notwithstanding that past technological revolutions have improved both the quality of life and the world of work, the combination of robots and AI threatens to destroy many more jobs than it creates—undermining the foundations of a good life based on a good job. (3)While it remains tempting to dismiss the recent rise of anti-establishment politics as an aberration, the roots of populism run much deeper and stronger—weakening the foundations of democracy and increasing the chances of international conflict.” “In my darkest moments, I fear that 2019 is looking more like 1929. Ninety years ago, economic inequality was at an all-time high in America and Europe. The seeds of authoritarian nationalism were sprouting in Asia, Europe and Latin America. World War I had destabilized the old global order without creating a new one. Against this backdrop, the stock market crash of October 1929 then ignited the horrendous cascade of depression, fascism and World War II—arguably the worst 15 years in history.” “The notion that we could even remotely be near such a global paroxysm may seem unthinkable today. But I bet that is how everybody living the life of The Great Gatsby and Downton Abbey in the late 1920s felt, too.” |
| Coverage of the Federal Reserve Bank of Kansas City’s annual conference at Jackson Hole, Wyoming focused on the growing belief that, as the FT put it, “central banks are out of ammo” with sovereign yields turning negative and the next downturn looming. | As Adair Turner noted in his FT column of the same title, “central banks have lost much of their clout…It has been clear since the 2008 global financial crisis that when short and long-term interest rates are already very low, further cuts make little difference to real economic activity.” Clearly, fiscal policy (and structural reform) should play a much larger role when the next downturn occurs. Yet whether the political will exists for this to happen remains unclear. For example, this month the US Congressional Budget Office stated that in the face of rapidly growing deficits, US government debt is on an “unsustainable course.” Moreover, as Turner notes, “large fiscal deficits and forms of monetary finance are already major drivers of global growth...Triggered by the Trump administration’s 2017 tax cuts, the US fiscal deficit has risen to today’s 4.5 per cent of gross domestic product. China’s fiscal deficit has grown from 2.8 per cent of GDP in 2015 to 6 per cent in 2019, with some of this financed by People’s Bank of China lending to state owned banks to buy public bonds. Japan has run large deficits for a decade, fully matched by Bank of Japan purchases of government bonds, which will never be sold back to the private sector. And while Germany has stuck to the path of fiscal rectitude, its growth has relied on exports to these profligate rule breakers.” These stories, and many more like them, reflect a growing fear that political leaders are either unwilling or unable to reverse the “secular stagnation” and “Japanification” that are descending upon the developed world, which may culminate in a deflationary trap that once entered will extremely difficult to escape. |
| “The Three Big Issues and the 1930s Analogue” by Ray Dalio | Dalio asserts that the three most important forces now at work in the world political economy are: (1) the end of the long-term debt cycle (or supercycle, as some have called it); (2) the large wealth gap and political polarization; and (3) a rising world power (China) challenging the existing world power (United States). Together, these have created dangerous conditions reminiscent of the 1930s. Dalio’s concern, repeated here again, is that these conditions will lead to a sharp increase in deficit spending and debt monetization that will eventually lead to a sharp increase in inflation. The critical uncertainty is whether this may be delayed for a long time by the emergence of a Japan-style deflationary trap, or perhaps avoided through various forms of debt writedowns. |
| “Inflation Dynamics: Dead, Dormant, or Determined Abroad?” by Kristin Forbes | “Over the last decade, the performance of standard models used to understand and forecast inflation has deteriorated. When growth collapsed during the 2008 Global Financial Crisis (GFC), inflation in most countries fell less than expected. Since then, as economies have largely recovered and unemployment fallen—even to record lows in some countries—inflation has not picked up as expected. A burgeoning literature has proposed a range of possible explanations for these puzzles…” Forbes concludes that global factors including, “higher commodity prices, higher oil prices, exchange rate depreciations, less world slack, and weaker global value chains are all associated with higher CPI inflation, and the role of this set of variables—particularly commodity prices—has increased.” |
| | |
| | |
| | |
| | |
| | |
| | |
| | |
| | |
| New National Security Information: Indicators and Surprises | Why Is This Information Valuable? |
| “The Coming Automation of Propaganda” by Adkins and Hibbard | “As U.S. policymakers remain indecisive over how to prevent a repeat of the 2016 election interference, the threat is looming ever more ominous on the horizon. The public has unfortunately settled on the term “bots” to describe the social media manipulation activities of foreign actors, invoking an image of neat rows of metal automatons hunched over keyboards, when in reality live humans are methodically at work. While the 2016 election mythologized the power of these influence-actors, such work is slow, costly, and labor intensive. Humans must manually create and manage accounts, hand-write posts and comments, and spend countless hours reading content online to signal-boost particular narratives. However, recent advances in artificial intelligence (AI) may soon enable the automation of much of this work, massively amplifying the disruptive potential of online influence operations. “This emerging threat draws its power from vulnerabilities in our society: an unaware public, an underprepared legal system, and social media companies not sufficiently concerned with their exploitability by malign actors.” |
| “The Weaponization of Information is Mutating at an Alarming Rate”, by Sophia Ignatidou in The Guardian 19Aug19 | “Communication has been weaponised, used to provoke, mislead and influence the public in numerous insidious ways. Disinformation was just the first stage of an evolving trend of using information to subvert democracy, confuse rival states, define the narrative and control public opinion. Using the large, unregulated, open environments that tech companies once promised would “empower” ordinary people, disinformation has spread rapidly across the globe. The power that tech companies offered us has become a priceless tool in propagandists’ hands, who were right in thinking that a confused, rapidly globalising world is more vulnerable to the malleable beast of disinformation than straightforward propaganda.” “Whatever we do, however many fact-checking initiatives we undertake, disinformation shows no sign of abating. It just mutates. While initially countries that were seasoned propagandists, such as Russia and North Korea, were identified as the main culprits, the list of states employing disinformation is growing.” |
| “Hostile Social Manipulation”, by Mazarr et al from RAND | “The role of information warfare in global strategic competition has become much more apparent in recent years. Today’s practitioners of what this report terms hostile social manipulation employ targeted social media campaigns, sophisticated forgeries, cyberbullying and harassment of individuals, distribution of rumors and conspiracy theories, and other tools and approaches to cause damage to the target state. “This emerging practice reflects an updated and modified version of many long-established forms of influence, including propaganda, “active measures,” disinformation, and political warfare, a group of techniques sometimes referred to with the overarching term measures short of war…These emerging tools and techniques represent a potentially significant threat to U.S. and allied national interests… “The analysis examines these issues through a detailed assessment of available evidence of Russian and Chinese social manipulation efforts, the doctrines and strategies behind such efforts, and evidence of their potential effectiveness…” The authors conclude that, “it is now undeniable that leading autocratic states have begun to employ information channels for competitive advantage—plans that remain in their initial stages and that could unfold in several ways…[While] there is as yet no conclusive evidence about the actual impact of hostile social manipulation to date…the marriage of the hostile intent of several leading powers and the evolution of several interrelated areas of information technology has the potential to vastly increase the effectiveness and reach of these techniques over time.” |
| “Averting Crisis: American Strategy, Military Spending, and Collective Defence in the Indo-Pacific”, by Townshend, Thomas-Noone, and Steward of the University of Sydney | SURPRISE This new study by a team of Australian researchers reaches some very sobering conclusions: “America no longer enjoys military primacy in the Indo-Pacific and its capacity to uphold a favourable balance of power is increasingly uncertain…” “Over the next decade, the US defence budget is unlikely to meet the needs of the [US] National Defense Strategy owing to a combination of political, fiscal and internal pressures…” “America has an atrophying force that is not sufficiently ready, equipped or postured for great power competition in the Indo-Pacific — a challenge it is working hard to address…” “A strategy of collective defence is fast becoming necessary as a way of offsetting shortfalls in America’s regional military power and holding the line against rising Chinese strength.” |
| “An Attack Against Them All?” by Binnendijk and Priebe from RAND | SURPRISE “This report provides an analytical framework for understanding allies’ willingness to contribute to a military response to Russian attacks on a North Atlantic Treaty Organization (NATO) member…” The authors conclude that, “The factors likely to drive allies’ decision making could vary substantially depending on whether Russia uses conventional or unconventional means. For example, widely discussed proposals to counter Russian influence attempts against the public and policymakers would be particularly important during an unconventional conflict or phase. [In contrast], the value that allied political elites place on the perpetuation of NATO is likely to be a determinative factor in a decision to commit forces to a conventional conflict with Russia.” |
| “Speed and Security: Promises, Perils, and Paradoxes of Accelerating Everything”, by Bouskill et al from RAND | “Technological developments and social dynamics are working in tandem to shift society into hyperdrive, which can usher in unprecedented security concerns… “Speed is an elusive, often paradoxical concept. In this work, speed is a heuristic designed to represent accelerated development and implementation of technologies across a host of domains: production, movement and transportation, communication, high-frequency trading and financial transactions, cognitive processing, data-sharing, information and knowledge transfer, weapon (e.g., missile) deployment, natural selection and evolution, computational processing, collective social organization, and cultural change…” “As the velocity of information—and just about everything else—accelerates, leaders face immense pressure to act or respond quickly…Nothing has had a more profound effect on government and the challenges of government.” |
| The evolving situation in Hong Kong was aptly summed up in two Financial Times headlines: “Hong Kong Protestors Play Dangerous End Game with China” (16Aug), and “Hong Kong’s Water Revolution Spins Out of Control” (2Sep19) | 16Aug: “Events over three dramatic days have threatened the long-held assumption that Beijing would never do anything that might jeopardise Hong Kong’s status as a leading international financial centre…the Chinese government might have no other choice but to intervene if Hong Kong’s 30,000-strong police force cannot contain what has become a “flash mob” rebellion, with fleet-footed, lightly clad protesters routinely running circles around clunkily armoured police in the city’s notorious summer heat and humidity.” 2Sep: “Much of the analysis of the Hong Kong unrest has focused on economics. While unaffordable housing and extreme inequality contribute to popular anger, it is condescending and misleading to blame these factors entirely. Many of the radicals are wealthy and highly educated. When they scatter to avoid police they often escape in luxury cars. Polling among protesters consistently shows that economic factors are less important to them than ideas…” The protestors’ “idealism has been fueled by constant references to historical liberation movements…If Beijing continues with its ultra-hardline approach, it is possible Hong Kong will descend into a situation resembling the Northern Irish “Troubles” of the 1970s and 1980s. That would mark the end of the city as a global financial centre. But it would not end the water revolution, which could easily spill across the border into mainland China, as IRA attacks did in the UK.” |
| Events in Hong Kong have sparked an increase in articles seeking to put the protests – and China’s trade war with the United States – into a larger context. | An excellent example is “Hong Kong Shows the Flaws in China’s Zero-Sum Worldview”, by Michael Schuman. He observes that both the trade war and Hong Kong protests “have similar roots deep within Beijing’s view of the world: Fixated on promoting their own power, Chinese leaders struggle to accommodate the interests of others. They often speak of “win-win” cooperation that benefits all parties, but their approach to the world around them is, in the end, zero-sum.” He also notes that, “China finds altering course especially difficult, mainly because of how its domestic political system functions. As an authoritarian regime—and one that is more and more centered on a personal cult surrounding Xi Jinping— admitting fault is perceived as a threat to credibility. Nor is it clear how much bad news filters up to top decision makers through a bureaucracy fearful that policy disagreements could be mistaken for disloyalty.” |
| “Party Man: Xi Jinping’s Quest to Dominate China”, by Richard McGregor in Foreign Affairs | SURPRISE McGregor observes that, “in the years since he took power, Xi has harshly suppressed internal dissent, executed a sweeping anticorruption campaign, and adopted a bold, expansive foreign policy that has directly challenged the United States. Few foresaw the extent of Xi’s ambition before he took over as leader...” “By the time he took office, Xi seemed possessed by a deep fear that the pillars of party rule—the military, the state owned enterprises, the security apparatus, and the propaganda machine—were corrupt and crumbling. So he set out on a rescue mission…” “Xi has chosen to govern China as a crisis manager. That might help him in China’s immediate rivalry with the United States. But along the way, his enemies at home and his critics abroad have piled up…There is good reason to think, as many Chinese officials and scholars do, that Xi’s overreach will come back to haunt him before the next party congress, in late 2022, especially if the Chinese economy struggles…Sooner or later, as recent Chinese history has shown, the system will catch up with him. It is only a question of when.” |
| | |
| | |
| | |
| | |
| | |
| New Health and Disease Information: Indicators and Surprises | Why Is This Information Valuable? |
| | |
| | |
| New Social Information: Indicators and Surprises | Why Is This Information Valuable? |
| “Will More Workers Have Non-Traditional Jobs as Globalizatoin and Automation Spread?” by Ruttledge et al from the Center for Retirement Research at Boston College | SUPRRISE The authors find that globalization has had a much smaller impact than automation on the increase in non-traditional jobs (e.g., gig work) characterized by higher income instability and a lack of healthcare and retirement benefits. Moreover, older workers are disproportionately affected by this trend. Their conclusion has substantial social and political implications: “As automation continues to increase, jobs that offer retirement savings, health insurance, and stable income may continue to decline, and the impact is likely to be particularly felt by older workers who may need these benefits the most.” |
| “Where Has the Money Gone?” by Phillip Sprincin, and “The Cost of Bad Intentions”, by Steve Malanga, both in City Journal | The accelerating decline of the once great City of San Francisco is both a national tragedy and a potent example of many of the pathologies at work in America’s large cities, including, as Sprincin notes, bureaucratic mismanagement and political indifference to efficient and effective public administration. To cite one example: The city’s budget (in constant 2019 dollars) has essentially doubled since 2000, with the average city employee now making $175,004/year in salary and benefits. Yet on multiple measures, quality of life in the City by the Bay is rapidly deteriorating. For example, as Malanga notes, San Francisco now has the highest property crime rate of any major city in America. Examples like this, which unfortunately abound, go a long way to explaining American’s cynicism about and anger at government and elites, which only grows more fervent when they are exposed to well-run cities, like many across their northern border. Malanga’s longer article uses a broader range of examples to show how the progressive ideology of many urban leaders has led to enactment of a series of policies that, based on the evidence, are making things worse, not better. |
| “Five Decades of US, UK, German, and Dutch Music Charts Show that Cultural Processes are Accelerating”, by Schneider and Gros in Royal Society Open Science | The authors find that “the evolution of album lifetimes and of the size of weekly rank changes provide evidence for an acceleration of cultural processes. For most of the past five decades number one albums needed more than a month to climb to the top, nowadays an album is in contrast top ranked either from the start, or not at all. Over the last three decades, the number of top-listed albums increased as a consequence from roughly a dozen per year to about 40.” “The distribution of album lifetimes evolved during the last decades from a log-normal distribution to a power law, a profound change.” |
| “This Will Be Catastrophic: Maine Families Face Elder Boom, Worker Shortage in Preview of Nation’s Future” by Jeff Stein in the Washington Post | SURPRISE “Last year, Maine crossed a crucial aging milestone: A fifth of its population is older than 65, which meets the definition of “super-aged,” according to the World Bank. By 2026, Maine will be joined by more than 15 other states, according to Fitch Ratings, including Vermont and New Hampshire, Maine’s neighbors in the Northeast; Montana; Delaware; West Virginia; Wisconsin; and Pennsylvania…” “With its 65-and-older population expected to grow by 55 percent by 2026, Maine needs more nurses, more home-care workers and more physicians than ever to keep pace with demand for long-term-care services. But the rising demand for care is occurring simultaneously with a dangerously low supply of workers.” |
| “The Future of Fentanyl and Other Synthetic Opioids”, by Pardo et al from RAND | SURPRISE “The number of opioid-related deaths in the United States is truly astounding. There were on the order of 50,000 opioid-involved overdose fatalities in 2018…Ten years ago, few would have predicted that illicitly manufactured synthetic opioids from overseas would sweep through parts of Appalachia, New England, and the Midwest. As drug markets are flooded by fentanyl and other synthetic opioids, policymakers, researchers, and the public are trying to understand what to make of it and how to respond… “The history of drug use and drug problems has been marked by a sequence of epidemics, but the synthetic opioid problem is different. Whereas previous epidemics often were spurred by growing demand, the transition to fentanyl and other synthetic opioids appears to be a supplier-led phenomenon…Thus, the traditional epidemic framework largely fails to capture the dynamics of the problem… “Fentanyl and other synthetic opioids kill on a scale that is unprecedented among illegal drugs. The causes, dynamics, and likely future course are fundamentally different from other modern drug problems. These differences are not widely appreciated, and they matter in terms of how policymakers and society should respond. Existing strategies remain important, but they are not enough.” |
| “Modular Structure in Labour Networks Reveals Skill Basins”, by O’Clery et al | SURPRISE The authors use innovative network analysis methods to produce important new insights about the operation of modern labor markets. Specifically, they “find workers from finance, computing, and the public sector rarely transition into the extended economy. Hence, these industries form isolated clusters which are disconnected from the broader economy, posing a range of risks to both workers and firms.” |
| | |
| | |
| | |
| | |
| | |
| | |
| | |
| New Political Information: Indicators and Surprises | Why Is This Information Valuable? |
| “U.S. Views of China Turn Sharply Negative Amid Trade Tensions”, Pew Research, 13aug19 | “Unfavorable opinions of China have reached a 14-year high. Today, 60% of Americans have an unfavorable opinion of China, up from 47% in 2018 and at the highest level since Pew Research Center began asking the question. Americans also increasingly see China as a threat. Around a quarter of Americans (24%) name China as the country or group that poses the greatest threat to the U.S. in the future, twice as many as said the same in 2007. China is tied with Russia (24%) as the country or group most cited as a threat to the U.S…” “While both Republicans and Democrats have unfavorable views of China, Republicans’ opinions are somewhat more negative: 70% of Republicans and independents who lean Republican have an unfavorable opinion of China today, compared with 59% of Democrats and Democratic-leaning independents.” |
| “The Limits of My Conservatism”, by Andrew Sullivan in New York magazine | Sullivan writes that the “distinction between a reactionary and a conservative is an important in this particular moment.” He defines this “core divide” as “between those who see the social, cultural, and demographic changes of the last few decades as requiring an assault and reversal, and those who seek to reform its excesses, manage its unintended consequences, but otherwise live with it.” The first Sullivan calls a reactionary; the second, a conservative. He goes on to opine that, “a conservative is worried about the scale and pace of change, its unintended consequences, and its excesses, but he’s still comfortable with change. Nothing is ever fixed. No nation stays the same. Culture mutates and mashes things up. And in America, change has always been a motor engine in a restless continent…” “One question conservatives are always asking themselves is whether these changes can be integrated successfully into a new social fabric, so we do not lose cohesion as a nation; another is whether this change is largely being imposed from above by ideological fiat, or whether it’s emerging from below as part of an emerging spontaneous order…” Sullivan goes on to observe that, “A conservative who becomes fixated on the contemporary left’s attempt to transform traditional society, and who views its zeal in remaking America as an existential crisis, can decide that in this war, there can be no neutrality or passivity or compromise.” He concludes that “The smugness, self-righteousness, and dogmatism of the current left is a Miracle-Gro of reactionism.” |
| In Germany, state elections in Brandenberg and Saxony confirmed the shrinkage of the center left (Social Democrats) and center right (Christian Democrats) parties, with gains for both the greens (on the left) and AFD (on the right). | While neither the Greens nor the AFD made a decisive breakthrough, this election provided further evidence of fragmentation in German politics, which will very likely continue as the economy worsens. |
| In the UK, the Corbyn led Labour party proposed that, if it takes power, it would seize ten percent of the shares in many companies and redistribute them to workers (“a 300 billion pound raid on shareholders” according to FT calculations), while banning financial services employee bonuses. In the coming UK election, the UK will face a stark choice between a Conservative Party that is forcing out (“deselecting” to run for their current office) its moderate “Remainer” MPs, Nigel Farage’s Brexit party, Corbyn’s Labour, and the Liberal Democrats, which of late have picked up a number of moderate Labout MPs who have left the party out of disgust with its growing anti-Semitism. All signs point to a transformative election and realignment of UK politics. | SURPRISE As the Financial Times noted on 2 Sep19 “At the heart of everything is one word: redistribution. Redistribution of income, assets, ownership and power. The mission is to shift power from capital to labour, wresting control from shareholders, landlords and other vested interests and putting it in the hands of workers, consumers and tenants. “We have to rewrite the rules of our economy,” says [Shadow Chancellor] John McDonnell” (“Jeremy Corbyn’s Plan to Rewrite the Rules of the UK Economy”). This has provoked strong reactions. “To [Corbyn’s] opponents and those likely to be at the sharp end of such a programme — high-earners, business owners, investors and landlords, it is alarming. “Whenever we hold events I always ask, ‘what are you more worried about, a Corbyn government or a no-deal Brexit?’” says one business lobbyist. “Now the universal answer is Corbyn.”” |
| | |
| | |
| | |
| | |
| | |
| | |
| New Financial Markets and Investor Behavior: Indicators and Surprises | Why Is This Information Valuable? |
| | |
| | |
| | |
| | |
| | |
| | |
| | |
| | |
Feature Article: Future Labor Productivity Growth: The Supply Side Secular Stagnation Story
“Productivity isn’t everything, but in the long run it is almost everything.” – Paul Krugman, 1994
Consider what has happened over the twenty-five years since Krugman said this. In the United States, the average increase in the size of the potential labor force was 0.91% per year. Over the same period, the average increase output per hour worked (a measure of labor productivity) in private non-farm businesses was 2.1% per year. Combining these two, the potential output of private non-farm businesses grew by about 3% per year. The actual growth of real GDP averaged 2.7% per year.
In other words, actual growth was relatively close to the “speed limit” imposed by the growth of the labor force and labor productivity. Growing faster than this would risk triggering higher inflation. In point of fact, we were probably closer to the speed limit than these data indicate, because labor productivity growth in sectors of the economy outside of private non-farm businesses has actually been much lower – some have estimated that it may actually be negative in healthcare and education, which together account for almost 25% of America’s GDP.
Contrast this with the period 1960 – 1979, when US GDP growth averaged 3.9% per year, and ask yourself how much easier it would be to either avoid or solve many of the problems we face today if GDP had kept growing at that rate.
Today, labor force growth is projected to grow much more slowly than in the past, which makes increasing labor productivity more important than ever before as the driver of increased potential output and GDP growth.
Before delving into the challenges and uncertainties this entails, it is important to first clear up some of the definitional issues that surround the general concept of labor productivity.
Historical labor productivity has been calculated in terms of growth in output per labor hour, by dividing GDP by the total hours that were worked to produce it. However, measuring productivity this way introduces a number of uncertainties.
The first is the extent to which GDP accurately captures the total value of an economy’s output (e.g., the value of many free services provided by technology companies in exchange for their access to our browsing and social media data, or the value of outputs produced in the home by unpaid labor – e.g., loads of laundry done).
The second is the accuracy of the labor hours worked measure (e.g., it doesn’t capture the time people spend on work emails when they are doing that laundry). Studies that have examined these measurement issues have concluded that while they introduce a measure of uncertainty into labor productivity estimates, the size of potential measurement error is small relative to the slowdown in productivity growth that has occurred in recent years (e.g., see, “Does the United States have a Productivity Slowdown or a Measurement Problem?” by Byrne et al).
A potentially more serious problem is caused by differences in the rates at which GDP and hours worked change over time. For example, if GDP is falling, but businesses at first hesitate to lay off their employees, this will create the appearance of a fall in labor productivity in the data, even though the productivity of those worker in terms of their ability to potentially produce a maximum quantity of output (assuming demand for it exists) has not changed at all. Conversely, if GDP increases by management delays the rehiring of previously laid off workers, the data may give the appearance of an increase in labor productivity when, in potential output terms, none has occurred.
The key point is that we have to separate historical labor productivity growth from growth in potential output, or aggregate supply. In this analysis, we are focused on the latter (we covered aggregate demand related issues in last month’s feature on the coming economic downturn).
Let us turn now to the key uncertainties we confront when estimating the rate at which labor force productivity (and thus potential output) will likely grow in the future.
We’ll start with the health of what will be an aging labor force. Poor health reduces labor productivity.
Today, Medicare (for people 65 and older) and Medicaid (for people below a certain level of income) pay lower prices to health care suppliers that private sector insurers pay, and far less than what people without insurance pay. In healthcare, the law of one price doesn’t apply, and prices and quality measures are far from transparent. In effect, the current system facilitates the cross-subsidization of Medicare and Medicaid clients by people who purchase private health insurance, either directly or through their employer.
As the population ages, and if the gig economy grows and income inequality continues to worsen, this business model will come under even more strain that it is today. As Herbert Stein famously observed, “if something cannot go on forever, it will stop.” Time will tell what will come next, and whether the next US healthcare business model will result in a healthier workforce.
Beyond their health, the knowledge and skills of the labor force are critical to productivity growth. Recent research into productivity differences across companies has highlighted why this is the case. Companies with highly skilled and knowledgeable employees have a two-edged advantage. Not only can they absorb and apply new productivity enhancing technologies faster than other companies, but they are also better at creating innovative new technologies, products, and business models. This translates into a productivity advantage, whose benefits can be divided between customers (via more attractive offerings and/or lower prices), employees (via higher compensation), and investors (via higher returns to equity and less credit risk for lenders). Observers have also noted that, in so far as these benefits go to employees, they are also a driver of worsening income inequality.
This is why, in survey after survey, CEOs are placing their ability to attract and retain talent near the top of the list of the risks facing their companies. It is also why, across more and more industries, we are seeing the emergence of a top tier of “winner take most” firms, that are generating substantial economic value, and leaving most other firms in their industry (which lack the deep talent base, advanced technology, and high productivity) with economic returns that barely cover their cost-of-capital and leave little or no room for employee compensation increases (e.g., see, “The Global Productivity Slowdown, Technology Divergence And Public Policy: A Firm Level Perspective”, by Andrews et al from the OECD, “Management as a Technology” by Bloom et al, and “A Bad Time To Be Average”, by Burkner et al from BCG).
Unfortunately, the poor current state of student achievement in America’s K-12 education system (and its seemingly intractable resistance to substantial change), the questionable results being produced by significant parts of its university system, and its fragmented and ineffective workforce development and lifetime learning programs, collectively lead to a sense of pessimism that the average knowledge and skill level of the US labor force will see a dramatic improvement anytime soon.
Labor productivity can also be boosted by capital investment. Some observers have noted the decline in business capital investment in the wake of the 2008 Global Financial Crisis and continuing uncertainty about future demand as important contributors to weak labor productivity growth.
Others have claimed that this decline may be overstated, due to the lower capital needs of many businesses today (e.g., being able to use cloud services rather than purchase their own servers), and increasing spending on R&D (which is often treated as an expense rather than an investment, even though its benefits are expected to extend over many years). However, other researchers have pointed to the decline in government funding for basic scientific research, and a fall in the productivity of private sector R&D spending (e.g., see “Are Ideas Getting Harder to Find?” by Bloom et al).
A more optimistic argument is that, like general purpose technologies that substantially increased labor productivity in the past (e.g., electricity), it will take many years before the benefits of some of today’s technologies (e.g., automation and artificial intelligence) have a similar impact, due to the long time companies need to adjust processes, systems, structure, staff, and often business models to take full advantage of them (but again, that process is constrained by the availability of human talent).
A final uncertainty with respect to overall labor productivity growth has its roots in the sectoral shifts in employment that have taken place in the U.S. economy. As agriculture became mechanized and labor productivity increases, workers moved from the farm into the factories, where mechanization increased their productivity there too. More recently, however, increasing manufacturing productivity and offshoring have forced more and more workers into service sectors where labor productivity growth has been much slower. Today, agriculture accounts for only 1.4% of American employment, and manufacturing just 7.9%.
In contrast, healthcare and social assistance are at 12.4%, state and local government at 12.2% (to which educational services adds another 2.3%), leisure and hospitality at 10.2%, and retail trade at 9.8%. Collectively, these areas account for 47% of U.S. employment – and all are areas where labor productivity growth has lagged far behind agriculture and manufacturing.
For example, between 1987 and 2017, it averaged only 1.4% per year in hotels, 0.4% per year in restaurants, and was (some have claimed) negative in both healthcare and education.
These sectoral shifts in employment have significantly contributed to the lower overall level of labor productivity growth in the U.S. economy. Unfortunately, absent substantial changes in these sectors (particularly healthcare and education business models), it seems unlikely that we will see substantial aggregate labor productivity improvements in the future.
As this analysis has shown, the “secular stagnation” narrative is about supply as much as demand. After weighing the evidence that is available today, it seems very likely that U.S. labor productivity growth (and thus growth in potential GDP) will remain weak over the next 5 – 7 years. However, there is an even chance that it will accelerate thereafter, as the full impact of new technologies emerges across more sectors of the economy. Whether this will translate into an equally substantial increase in actual GDP growth will depend on whether the demand side challenges we analyzed last month are successfully met.
For more reading:
“The Case for An American Productivity Revival” by Branstetter and Sichel of the Peterson Institute for International Economics
“Is Slow Still the New Normal for GDP Growth?”, by Fernald and Li of the Federal Reserve Bank of San Francisco
“Productivity Puzzles”, by Andrew Haldane, Chief Economist of the Bank of England
“The Rise and Fall of American Growth”, by Robert J. Gordon
If you have any questions about anything we have written in this issue, please don’t hesitate to get in touch, at contact@indexinvestor.com
Appendix: Anticipatory Thinking and Forecasting Methodologies
Our process is based on methods and tools developed over the past seven years at our affiliate, Britten Coyne Partners, which provides consulting services and education courses to executive teams and boards on strategic risk governance and management.
At The Index Investor, we engage in both anticipatory thinking to identify what could happen (e.g., different macro regimes and related events), and forecasting, to estimate the probability that events and regimes will happen, and the impact they will have if they do (e.g., on macro variables and broad asset class returns).
With respect to what could happen, we are acutely conscious of the conclusion reached by a 1983 CIA study of failed forecasts: "each involved historical discontinuity, and, in the early stages…unlikely outcomes. The basic problem was…situations in which trend continuity and precedent were of marginal, if not counterproductive value."
When it comes to forecasting, we know that in complex socio-technical systems that are constantly evolving, the accuracy of statistical or machine learning based forecasting methods declines exponentially as the time horizon lengthens, since the historical data set on which they were trained will (depending on the speed and effectiveness of any retraining cycle) bear less and less resemblance to the distribution of outcomes the system is likely to produce in the future.
Under these circumstances, forecast accuracy over longer time horizons depends on causal and counterfactual reasoning about the possible future effects of multiple interacting trends and uncertainties that are hard to quantify.
And we are acutely aware of the economist Rudi Dornbusch's famous warning: "Crises take a much longer time coming than you think, then happen much faster than you would have thought."
Our forecasting process also draws on lessons Tom Coyne learned from spending four years as a member of the Good Judgment Project team, which won the Intelligence Advanced Research Projects Activity’s forecasting tournament with forecast accuracy that was more than 50% better than the tournament's control groups (the team's experience is described in Professor Philip Tetlock's book, “Superforecasting").
Our analysis focuses on the probability of the global macro system being in four possible macro regimes 12 and 36 months from the date of our forecast: (1) Normal Times, where equity asset classes perform well; (2) a High Uncertainty regime that is usually short and transitory, where asset classes like short-term government bonds perform best and equities suffer significant declines; (3) High Inflation (which we deem 5% or more, year-on-year), where commercial property, real return bonds and other traditional hedges are favored; and (4) Persistent Deflation (a year-on-year decline in the US CPI), which up to now has only been seen in Japan, and in which the relative performance of different asset classes remains uncertain, but will likely favor high quality bonds and the consumer staples equity sector.
In response to subscriber requests, we have added a 36-month regime forecast to our existing 12 month forecast. The logic is that, in a complex evolving system like global macro, a longer forecast horizon gets beyond the “detection range” of algorithmic forecasting approaches, and therefore raises probability that a manager/investor can gain an edge in identifying emerging threats and opportunities.
That said, because evolving (i.e., “non-stationary”) complex systems populated by highly connected human agents are also capable of sudden non-linear changes (with which are hard for algorithmic approaches to predict), we are also keeping our 12 month forecast.
Our forecasting methodology starts with base rate/reference case data about the historical probability of large changes in equity and bond valuations. We then analyze the current situation from both a quantitative and qualitative perspective. In the latter, we focus on the key endogenous drivers of macro regime change, including technological, economic, national security, social, and political trends and uncertainties. We also focus on three potential sources of exogenous shocks that could also produce a macro regime change, caused by environmental, disease, and cyber related events.
While most of our attention typically focuses on various flows (e.g., economic growth, change in the price level, sales, earnings, job creation, etc.), endogenously caused regime changes result when those flows push key stocks beyond a critical threshold or tipping point, often setting off non-linear reactions across multiple areas. As noted by Hyman Minsky and others, a classic example is the steady accumulation of outstanding debt until it reaches the point where it can no longer be serviced and triggers a crisis.
Base Rate Data
Since the end of World War Two, there have been fifteen months where a downturn in the US equity market began that eventually reduced asset class value by 20% of more. That is a hazard rate of about 1.75% per month. Put differently, in any given month there is a 98.25% probability that a 20%+ downturn won’t occur, or, in a given year, an 81% probability.
However, as the time without a 20%+ downturn extends, the compound probability that one will not occur shrinks. At the end of August 2018, it is more than nine years since the last equity market decline of 20% or more. The probability of that happening is only 15%.
To estimate the base rate for a 20% fall in bond prices (which historically has been caused by a sharp increase in inflation, as we saw in the late 1970s and early 1980s), we analyzed monthly historical AAA bond yields since 1919. For consistency, we used them to calculate the price of a ten-year zero coupon bond. We then calculated the probability of a price decline of 20% or more over three different holding periods: 12, 18, and 24 months. In any month, the annualized probability of a decline of 20% or more over the subsequent 12 months is 12%; over 18 months, 20%, and over 24 months, 25%.
Market Stress Indicators Methodology
We view financial markets as a complex adaptive system. The size of changes generated by such a system follows a power law rather than a normal (Gaussian) distribution. The critical point is that large changes are much more common in complex adaptive systems than most people’s intuition leads them to believe.
While predicting the behavior of complex adaptive systems remains far more art than a science, various researchers have found that large changes in such systems are often preceded by subtle warning signs, as stress accumulates within them. While this research is not definitive, we believe that five warning signs are worth monitoring as potential indicators of growing stress within financial markets that could suddenly give rise to large changes in asset class valuations.
Our first indicator is the month-to-month autocorrelation of broad asset class returns (i.e., the relationship of this month’s returns to last month’s). A system under increasing stress loses resiliency, causing it to take longer to recover from perturbations; hence, autocorrelation increases as it approaches a critical transition (see, “Early Warning Signals for Critical Transitions” by Scheffer, et al).
The second market stress indicator we monitor is the Economic Policy Uncertainty Index published by the Federal Reserve Bank of St. Louis (via its FRED economic database), which is based on research by Baker, Bloom, and Davis (see their paper, “Measuring Economic Policy Uncertainty”). The index is based on automated text analysis of leading newspapers and magazine publications, to identify the frequency with which words and phrases are used that indicate uncertainty.
In humans’ evolutionary past, when uncertainty increased the probability of survival was enhanced by staying close to a group. All of us still have that instinct. Research has found that as uncertainty increases, we have an unconscious bias towards higher conformity of our own views with those of a larger group (i.e., reduction in cognitive diversity). Behaviorally, heightened uncertainty induces more “social copying” of others, likely due to both conformity bias and the rational belief that others may be acting on the basis of superior information. This increase in conformity and copying makes a social system more ordered as uncertainty increases, and also reduces its responsiveness to perturbations (i.e., increases autocorrelation) because of delays in the social copying process.
The key point is that increasing uncertainty induces more, not less order in social systems, and in so doing primes them for sudden non-linear change.
Our third market stress indicator is the spread between the yield on AAA rated bonds and the 10-year US Treasury. This is a proxy for the level of investor concern about financial system funding liquidity.
Our fourth market stress indicator is the yield spread between speculative BB rated bonds and the ten-year US Treasury. Throughout history, excessive credit growth has been a root cause of many financial crises. An indicator of such growth is falling credit spreads, particularly in the case of riskier borrowers. In contrast, rising BB spreads indicate growing investor concern about the consequences of such growth, and the financial distress lower rated companies could experience in an economic downturn.
Our fifth market stress indicator is what we term the “political risk premium” that is implicit in the price of gold. Our starting point for estimating this premium is the three different roles that gold plays. First, gold is a store of value in a world of fiat currencies. When the rate of money supply growth exceeds the growth of nominal GDP, gold’s price should increase to maintain its purchasing power. Between 2007 and 2017, the US money supply (M2) grew by about 86%, while nominal US GDP grew by 35%. The stock of gold grew by 18%, based on mine production over this period. We therefore infer that 33% of the increase in the price of gold represented the maximum potential gold price change that could be attributed to a desire to hedge inflation risk (86% less 35% less 18%).
Second, gold is a unit of account. We take this to mean that the annual change in GDP expressed in terms of physical gold (i.e., nominal GDP divided by the price of gold) should equal the change in real GDP calculated using the GDP price deflator to account for actual inflation over the period. A key challenge is the point at which to start this calculation.
We chose the price of gold in 1995/1996. In that period, the change in real global GDP measured using the IMF’s price deflator just about equaled the change in GDP measured in terms of physical gold. We interpret that coincidence as indicating that at that point in time, concerns about future inflation and political risk were minimal, and the change in the price of gold was mostly driven by its role as a unit of account. We calculated a subsequent series of gold prices that would produce the same change in “gold GDP” as the actual real GDP as calculated by the IMF. Between 2007 and 2017, “gold as a unit of account” warranted a 21% increase in its price.
Gold’s third role is as a hedge against inflation and what we term “political disaster” risk. We subtract the 21% estimated compensation for actual inflation from the 33% “gross” inflation risk hedge to derive an apparent 12% increase in the gold price that reflected the true risk premium to hedge against possible future inflation. However, between 2007 and 2017 the price of gold actually increased by 81%. This implies that 48% of this (81% less 21% less 12%) represented a premium for some other type of uncertainty at the end of 2017. The interesting question is the nature of the uncertainty for which gold is believed by some investors to be a superior hedge than traditional ports in a storm like short-term US government securities, or similar securities issued by other developed countries.
The logical inference is that the uncertainty in question must reflect a situation in which short term US Treasuries would be a less effective hedge than gold. This could be a world of widespread hyperinflation, capital controls, and/or radical changes in nations’ governments (of course, this would also imply a preference for investing in gold coins rather than bullion, as while the latter may be a store of value, it is far less convenient as a means of paying for transactions).
To put this in further perspective, this gold price “disaster risk” premium sharply increased from 2008 to 2012, then declined before sharply increasing again after 2016. Arguably, a significant part of the former increase reflects concerns about the potential inflationary consequences of dramatic quantitative easing by central banks. But this is not likely to be the case after 2016.