The Index Investor
May 2021
Recent Quantitative Indicators
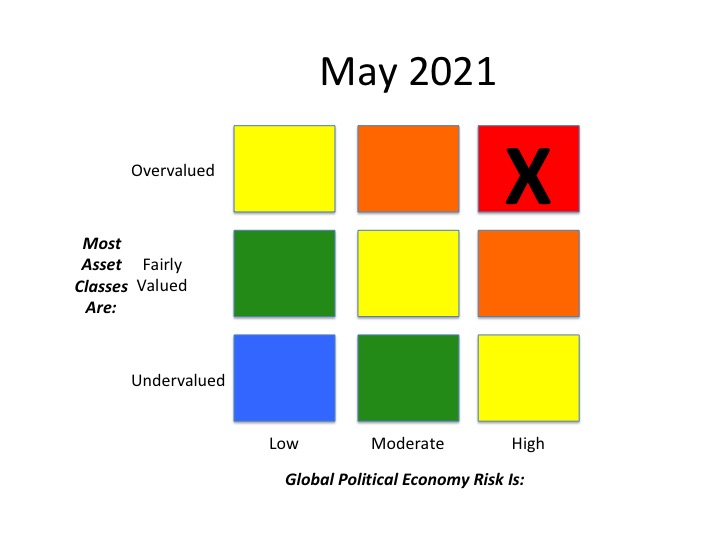
Tactical Asset Allocation Implications of Our Forecasts
Forecast Pre-Mortem Analysis
Combining and Extremizing Forecasts to Improve Predictive Accuracy
Feature Article: Faster Productivity Growth Is Critical. But Will It Happen?
High Value Information Observed Last Month:
- Technology
- Energy and Environment
- Health and Disease
- Economy
- National Security
- Society
- Politics
- Financial Markets and Investor Behavior
Critical System Thresholds/Tipping Points Analysis
Appendix: Anticipatory Thinking and Forecasting Methodologies
Current Macro Forecast
This month, we’re taking a slightly different approach. In the tables that follow, we lay out the key pieces of evidence that have led us to our current 12 and 36 month regime probability forecasts.
We hope that this approach will help you to better understand our forecast logic, and make it easier to see where it may differ from your own.
We use two techniques to avoid getting overwhelmed by information overload. First, we use two criteria to evaluate new information: (1) High value evidence has a higher probability of being observed (or not observed) in one or two regimes, but not the others. (2) Surprising information warns that our mental model is incomplete.
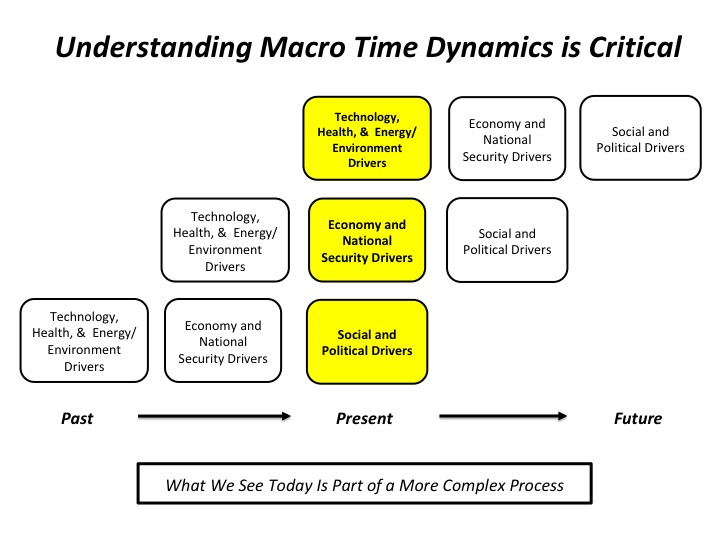
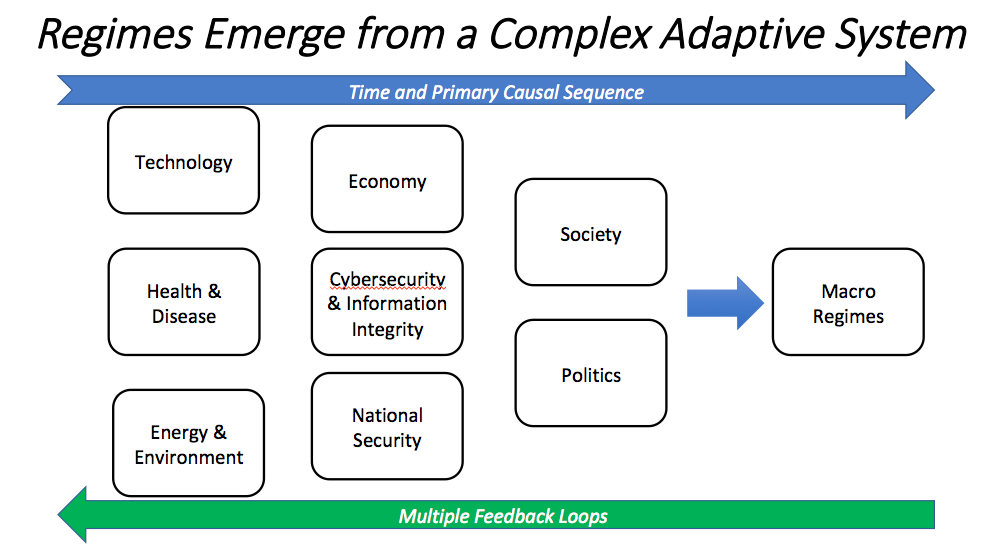
Second, we organize evidence using a model of the causal time dynamics (albeit with many feedback loops) at work in the complex global macro system from which regimes emerge:
.
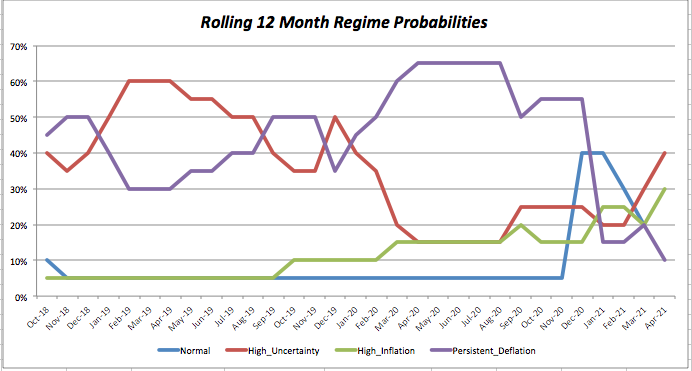
12-Month Forecast
| Key Evidence | Normal Regime | High Inflation | Persistent Deflation | High Uncertainty |
|---|---|---|---|---|
| Technology | | | | Colonial Pipeline ransomware attack highlighted vulnerability of critical infrastructure to cyber attack. |
| Energy and Environment | | | | Surprise announcement by Biden Administration of much more aggressive greenhouse gas reduction targets. Impact is uncertain. |
| Health | 58% of US adults have received at least one vaccination shot. | | Increasing evidence of the scope and severity of “long COVID.” | Rising percentage of US COVID cases are due to new variants. Also, pace of vaccination has slowed, with more people refusing to get a shot. |
| Economy | US and EU Fiscal Stimulus Plans. The critical assumption is that all this demand stimulus will provoke a strong domestic (not imported) supply response and thus avoid a sharp increase in inflation while driving the growth of job creation, higher wages, and reduction of inequality in the US. | Labor and other supply constraints are pushing up prices as demand recovers. | Uncontrolled COVID in India, Brazil and elsewhere raises probability of debt crises. Leverage remains high in US, where increasing interest rates and/or end of governments support programs could trigger more defaults. | Recovery in demand is still uneven, and the extent to which spending patterns have permanently changed remains uncertain. Domestic supply response is uncertain. Political consequences if additional supply comes largely through US imports (with weak domestic job and wage growth) is also uncertain, but very likely negative. |
| National Security | | Increasing evidence that SARS-CoV-2 pandemic was triggered by lab accident in Wuhan will further intensify US-China conflict, and potential threat to global supply chains. | | In Afghanistan, Taliban attacks increase ahead of Sept. US withdrawal, raising spectre of fall of Saigon in 1975. |
| Society | | | | Few signs of broad increase in public trust in elites and institutions. |
| Politics | | | | Extent to which proposed Biden stimulus plans will be approved, and degree of political conflict this process will trigger are uncertain. |
| Financial Markets | | | Valuations in many asset classes are at or near all-time highs, which has substantially increased crash risk. | |
| 12-Month Regime Probability | 20%, down 10% from last month. | 30%, up 10% from last month. | 10%, down 10% from last month. | 40%, up 10% from last month. |
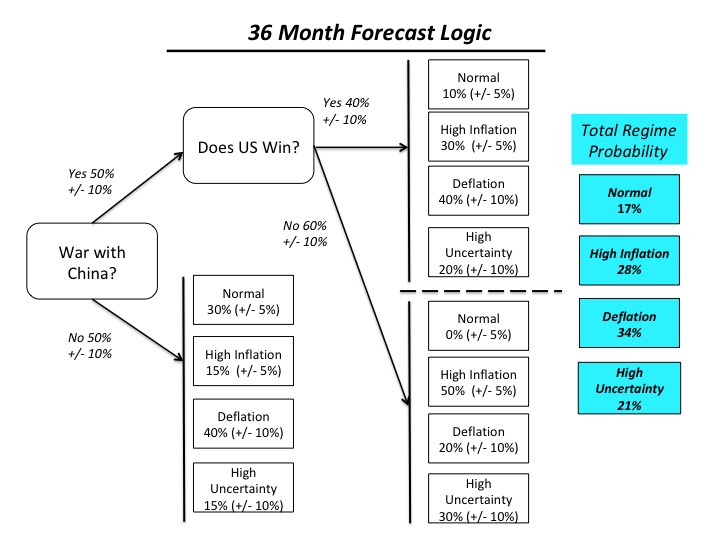
36-Month Forecast
.
| Key Evidence | Normal Regime | High Inflation | Persistent Deflation | High Uncertainty |
|---|---|---|---|---|
| Technology | Improvements in technology could increase productivity and growth – provided that investment and the supply of talent both increase. | | Faster improvement in automation than human capital quality would trigger job losses and worsen inequality. | |
| Energy and Environment | Key pieces of Biden Infrastructure Plan – e.g., increased access to broadband, upgrade to US electrical grid, boost in science research spending – provide one basis for higher growth. | As happened in Germany, if not carefully managed Biden’s environment initiatives could sharply increase energy prices, and, depending on post-COVID labor market tightness, trigger a wage/price feedback loop. | Increasing temperature variability reduces economic growth. | |
| Health | | | “Long-COVID” could significantly raise healthcare costs, reducing spending in other areas | |
| Economy | Biden stimulus plan (if all parts are passed, and if nothing goes wrong elsewhere), combined with impact of EU stimulus plan later this year, and with not-yet announced structural reforms (e.g., banning stock buybacks), and weakening of supply side constraints could produce the normal regime. | Continued US deficits and increase in debt increase the risk of a collapse of confidence in the US Dollar, provided that there are more attractive alternatives | High debt levels and potential for solvency crisis (debt deflation process) – in US, EU, China, and Emerging Markets High inequality weakens demand relative to supply Better technology enables more offshoring of high value added jobs Weakening world trade Reduced level of competition in many markets dominated by superstar effects. Low probability of significant improvement in productivity growth (see May Feature Article) | |
| National Security | | Massive disruption of global supply chains in the case of US-China war over Taiwan | Russian attack on Baltics would have a smaller impact on supply chains, but would sharply increase uncertainty and depress demand | |
| Society | | Slow growth in labor force could push up wages – but, increasing automation and globalization of supply for high value added jobs will offset this | Ageing population reduces consumption demand | Few signs of broad increase in public trust in elites and institutions. |
| Politics | | Rise of left or right populism would almost certainly lead to higher levels of debt financed government spending, with much of that debt purchased by central banks | | |
| Financial Markets | | | Valuations in many asset classes are at or near all-time highs, which has substantially increased crash risk. No sign yet of any policy proposals to reverse the “financialization” of the US economy, which is very likely a necessary condition for increases in private sector capital investment. | |
| | | | | |
This not only slows the diffusion of new information throughout social systems like economies and financial markets, but also causes these systems to coalesce around a small number of narratives. However, as tension increases on various fault lines in the global macro system, the dominant narrative or narrative grows increasingly fragile.
Under these conditions, rapid, non-linear changes are very likely to occur, that are out of proportion to the apparent trigger that sets them off.
Forecast Logic: Quantitative Indicators
Implications of the Most Recent Three Month Asset Class Returns
Our forecasting methodology also includes quantitative analyses of asset class valuations, market stress indicators, and the level and change in three-month returns, over the most recent and previous three-month periods, for those asset classes, which should perform best under different regimes (in this sense, our regimes can be regarded as macro factors).
We assume that that the rolling three month returns reflect investors’ views regarding the relative probability that a given macro regime will develop in the future.
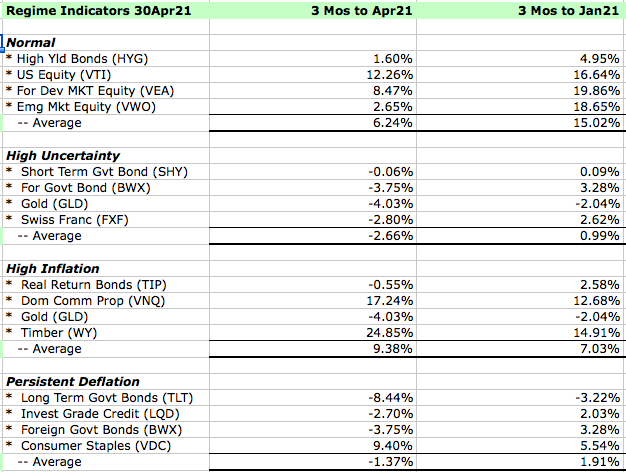
We disagree with the probability for the Normal Regime that is implied by relative returns on different asset classes in the three months to the end of March. We think it is too optimistic.
Asset Class Valuation and Momentum Indicators (@30Apr21)
| Asset Class (ETF) | Valuation | 1 Month Return | Conclusion |
| US Real Return Govt Bond (TIP) | Likely Overpriced* | 1.43% | Increasing Overvaluation |
| US Nom Return Govt Bond (GOVT) | Fairly Priced* | 0.72% | Fairly Valued |
| US Investment Grade Credit (LQD) | Top of Fairly Priced Range* | 1.04% | Fairly Valued |
| US High Yield Credit (HYG) | Almost Certainly Overpriced* | 0.64% | Increasing Overvaluation |
| US Commercial Property (VNQ) | Likely Overpriced* | 7.86% | Increasing Overvaluation |
| US Equity (VTI) | Almost Certainly Overpriced* | 5.04% | Increasing Overvaluation |
| Foreign Devel Mkt Equity (VEA) | Likely Overpriced* | 3.05% | Increasing Overvaluation |
| Emerging Markets Equity (VWO) | Almost Certainly Overpriced* | 1.79% | Decreasing Overvaluation |
| Timber (WY) | Likely Underpriced | 8.90% | Decreasing Undervaluation |
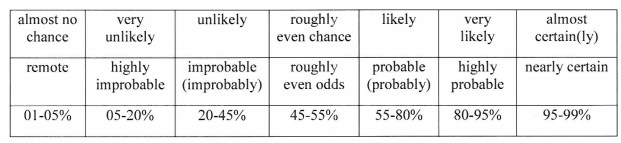
Note: The language we use to describe our estimated likelihood of asset class over or undervaluation is based on US Intelligence Community Directive 203 on Analytic Standards, which includes the following table:
Market Stress Indicators (@30Apr21)
| Market Stress Indicator | This Month vs Last Month |
| Asset Class Returns Autocorrelation (this month versus last month). Higher autocorrelation is an indicator of more tightly coupled and fragile markets. | .39versus .53 the previous month. This indicates a decreasing level of market stress. |
| Economic Policy Uncertainty Index (how many days over the last 30 was index in top quartile of values since 1985?). A higher number equals more market stress. | On 9 days last month the index was in the top quartile of daily values since 1985 (the 66th percentile of all rolling 30-day periods), a substantial decrease from 20days the month before. |
| AAA Rated Bonds Spread over 10 Year Treasury Yield (month end). Higher spreads indicate rising concern about market liquidity. | 1.29% (51st percentile since 1983), unchanged from last month. |
| BB Rated Bonds Spread over 10 Year Treasury Yield (month end). High spreads indicate increasing credit risk. | 2.37%, (20th percentile) down from 2.44% last month, indicating a low level of stress. Given our Regime forecast, this is almost certainly inadequate compensation for the risk being taken with BB rated bonds. |
| Gold Price per Ounce in US Dollars (month end). Rising gold prices are an indicator of increasing market uncertainty and stress. | $1,768 versus $1,685, up 4.95% from the previous month. At the end of 2017, we estimated the “disaster premium” in the gold price was 47% (see our methodology in the Appendix). At the end of last month it was 83%, up from 77% the previous month. Given our forecast, this still seems too low. |
Portfolio Allocation Implications of Our Forecast
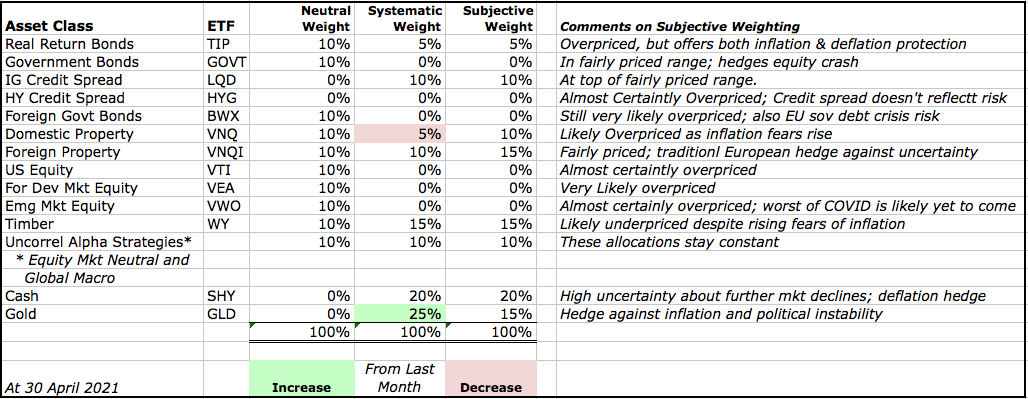
We take two approaches to deriving the tactical asset allocation implications from our analyses (i.e., deviations from our "neutral" or base case model portfolio).
The first takes a systematic approach, and is based on relative asset class valuations. Our starting point is our neutral model portfolio, which is equally weighted across nine broad asset classes, and also includes 5% allocations to alpha strategies (equity market neutral and global macro) that are designed to have a low correlation to returns on broad asset classes.
Based on asset class valuations, we systematically vary the asset class weights (but not the active strategy weight), increasing from 10% to 15% when an asset class is likely undervalued, and 15% when it is very likely undervalued. In the case of overvaluations, we go to 5% and then into cash, if there are no undervalued asset classes with room for an increase. In effect, this replicates the systematic rebalancing strategy we used for 15 years in our previous model portfolios.Based on subscriber requests, this month we are re-introducing a feature from the previous version of The Index Investor: Tactical Asset Allocation Implications from our analyses.
The second tactical approach is based on our subjective view not only of current asset class valuations, but also of the implications of the broader macro trends and uncertainties that we analyze each month. Importantly, this subjective view reflects our primary goal of avoiding large downside losses, rather than seeking large upside gains.
Three final notes: First, with respect to US fixed income, we include credit products (investment grade and high yield) in the same asset class as government debt, and will shift into the former when their valuations become attractive.
Second, we regard gold not as a separate asset class to be held long-term, but rather as a complement to cash, into which we shift in periods of substantial overvaluation across multiple asset classes.
Third, we continue to be deeply concerned by the distortion in asset class valuations that have been created by negative real interest rates on sovereign bonds, which are the foundation of most asset pricing models. In August, we decided to address this distortion by using in our asset class valuation models our estimate of the economically logical real yield on inflation protected US government bonds (TIPs). This brings our quantitative valuation conclusions much closer to those based on our qualitative analysis.
More information about our investment beliefs, including our core philosophy, approach to asset allocation (including our model portfolios and their long-term track record), and views on various approaches to active and passive management can all be found here.
Here is our latest asset allocation view:
Pre-Mortem Analysis
One of the most important forecasting disciplines is to ask yourself why your forecast could be wrong. Dr. Gary Klein’s research has shown that a very powerful and insightful way to do this is via a “pre-mortem analysis.” This method asks you to assume that it is a point in the future, and your forecast has been proven wrong (or your strategy or company has failed). You are then asked to look backward from this imagined point in the future, to explain why you failed, what you missed, and what you could have done differently to avoid your fate.
The pre-mortem method takes advantage of the fact that humans reason much more concretely and in more detail when explaining the past than they do when trying to forecast the future.
So let us assume that it is one year from now, and our current forecast has turned out to be wrong.
How did this happen? What developments did we fail to anticipate?
- Following the election of Joe Biden, the removal from office Xi Jinping could lead to a reduction in the dangerously growing conflict between the US and China. The impact of this surprise seems uncertain. To the extent that reduced external threat reduces the perceived urgency of implementing structural reforms in the US, it would increase the probability of the High Inflation Regime. Yet at the same time, it could accelerate economic and political reforms in China, which would increase economic growth there, creating a more dangerous medium term situation for the United States.
- A supply side shock of some type – beyond the disruption of global supply chains caused by COVID-19 -- could produce a sudden increase in inflation. The most likely scenario is a reduction in oil supplies due to a prolonged kinetic conflict between Iran and the US. An unlikely scenario could be major crop failures associated with the next solar cycle, which NASA forecasts will be the weakest in 200 years. McKinsey recently concluded that the probability of such a failure has increased due to changes in the environment, and now stands at about 10% over the next five years ("Will the World’s Breadbaskets Become Less Reliable?”).
Note: Combining Our Forecasts with Others From Other Sources and Extremizing the Result Should Increase Your Predictive Accuracy
Research has found that three steps can improve forecast accuracy. The first is seeking forecasts based on different forecasting methodologies, or prepared by forecasters with significantly different backgrounds (as a proxy for different mental models and information). The second is combining those forecasts (using a simple average if few are included, or the median if many are). The final step, which significantly improved the performance of the Good Judgment Project team in the IARPA forecasting tournament, is to “extremize” the average (mean) or median forecast by moving it closer to 0% or 100%.
Forecasts for binary events (e.g., the probability an event will or will not happen within a given time frame) are most useful to decision makers when they are closer to 0% or 100% than the uninformative “coin toss” 50%. As described by Baron et al in “Two Reasons to Make Aggregated Probability Forecasts More Extreme”, forecasters will often shrink their probability estimates towards 50% to take into account their subjective belief about the extent of potentially useful information that they are missing.
When you average multiple forecasters’ estimates, you are including more information, which should increase forecast confidence and push the mean estimate closer to 0% or 100%. However, this doesn’t happen when you use simple averaging. For this reason, forecast accuracy is increased when you employ a structured “extremizing” technique to move the mean estimate closer to 0% or 100%.
You can download an extremizing model from our website to use when combining the forecasts you use in your decision process.
The extremizing factors in our model are those that the Good Judgment Project found maximized the accuracy of combined forecasts. Note that the extremizing factor is lower when average forecaster expertise is higher. This is based on the assumption that a group of expert forecasters will incorporate more of the full amount of potentially useful information than will novice forecasters.
Feature Article: Faster Productivity Growth Is Critical. But Will It Happen?
In a simple sense, economic growth is a function of two variables: The rate at which the labor force grows (due to rising births and/or immigration) the rate at which output per labor hour (labor productivity) grows. In the US and Europe, declining births and political resistance to higher levels of immigration mean that the labor force is growing much more slowly than in decades past. As a result, productivity growth is more important than ever to the future rate of economic growth.
Unfortunately, productivity growth has also sharply slowed in recent years.
Multi or Total Factor Productivity (MFP or TFP) is the percent of observed growth in output that cannot be explained by changes in the quantity of labor and capital inputs. A simple explanation of the meaning of this residual is that it measures the change in the efficiency with which labor and capital inputs are used.
A more detailed explanation interprets the growth of MFP as the net impact of many factors, including the breadth and rate of technological innovation (including approaches to management), the rate at which such innovations are incorporated into and improve the quality of the labor force and capital stock, the rate at which these improvements diffuse (spread) across industries and companies within them, and changes in institutions (e.g., regulations, financial markets, etc.) and changes in the relative weight of different sectors in the economy.
The following table (from the OECD) shows the average annual rate of MFP growth for a sample of countries over two periods: 1988 to 2007, and 2008 to 2019.
.
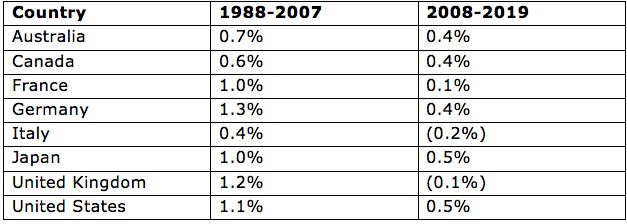
Looking further back, Robert Shackleton from the US Congressional Budget Office estimates that annual MFP growth was between 2.0% and 3.0% in the 1920s and 1930s as new general purpose technologies (like electricity and the internal combustion engine) spread throughout the economy). From 1950 to 1973 TFP grew by closer to 2.0% per year.
Following the 1973 and 1979 oil price and inflation shocks, MFP grew by less than 1.0% per year before recovering to more than 1.0% per year in the 1990s as new information and communication technologies were developed and diffused across industries and firms within them.
The annual rate of TFP growth slowed again in the early 2000s, and then plummeted in the years following the 2008 Global Financial Crisis (“Total Productivity Growth in Historical Perspective”).
Potential Root Causes of the Productivity Slowdown
A number of in-depth analyses have been undertaken to identify the causes of this decline.
Last month the US Bureau of Labor Statistics published “The US Productivity Slowdown: And Economy-Wide and Industry-Level Analysis”. The goal of this study was “to clarify potential sources of the productivity slowdown, through an analysis of labor productivity and its component series—multifactor productivity, contribution of capital intensity, and contribution of labor composition—at both the economy-wide and industry levels, complemented with a survey of the contemporary productivity literature.”
Key findings included the following:
• “Not only has the productivity slowdown been one of the most consequential economic phenomena of the last two decades, but it also represents the most profound economic mystery during this time, and though many economists have grappled with the issue for over a decade and even created some innovative research approaches to address the question, we still cannot fully explain what brought on this situation.”
• “The productivity slowdown of the past decade and a half has left the U.S. economy in a weaker position — yielding a sizable loss of potential output during these years—and perhaps even more importantly, it has also left the economy in a weaker position going forward.”
• “Reduced growth in MFP growth and capital intensity were the key contributors to the recent slowdown in labor productivity growth” (output per labor hour).
• “Throughout the historical period since WWII, the majority of the variation in labor productivity growth from one period to the next was from underlying variation in MFP growth.”
• “Something unprecedented about these recent periods was the additional contribution from variation in the contribution of capital intensity. The contribution of capital intensity had previously remained within a relatively small range (0.7 percent to 1.0 percent) during the first five decades of post-WWII periods, but then in the 1997–2005 period, the measure nearly doubled, from 0.7 percent up to 1.3 percent, followed by nearly halving to 0.7 percent in the 2005–18 period.”
• “Tighter financial constraints on firms during the recovery from the Global Financial Crisis (and higher levels of perceived uncertainty) may have reduced their investment in research and development and the commercialization of new technologies, which could have slowed MFP growth. Firms’ willingness to make these investments could also have been dampened by slow demand growth as the US recovered from the GFC” [see also, “Corporate Indebtedness and Low Productivity Growth of Italian Firms”, by the IMF].
• “Productivity dispersion in the United States has expanded in recent years, which means that a wider gap exists between these leading firms and the laggards.” While there are many questions about why this has occurred, the overall effect has been to depress MFP growth.
• Economists like Robert Gordon and John Fernald, “assert that the information technology (IT)-based innovations of recent decades are no match for the world-changing impacts of widespread electricity, the internal combustion engine, and indoor plumbing that emerged in the late 1800s and early 1900s. They claim that productivity growth cannot be expected to sustainably continue on the same high-growth trend that previously had been seen as of the mid-20th century. Furthermore, they regard the productivity speedup of the late 1990s and early 2000s as the true outlier and the subsequent low productivity growth as merely the expected case in this relatively lower innovation era. One underlying rationale for this potential story is provided by Joseph A. Tainter. This author offers that, in general, as complexity in a society increases following initial waves of innovation, further innovations become increasingly costly because of diminishing returns.”
• “Nicholas Bloom, Charles I. Jones, John Van Reenen, and Michael Webb [in their paper, “Are Ideas Getting Harder to Find?”] offer supporting evidence for this view regarding the United States, asserting that given that the number of researchers has risen exponentially over the last century—increasing by 23 times since 1930—it is apparent that producing innovations has become substantially more costly during this period”. See also, “A Global Decline in Research Productivity? Evidence from China and Germany” by Boeing and Hundermund, who find that, “diminishing returns in idea production are a global phenomenon, not just confined to the US.”
The productivity slowdown has occurred in most of the world’s economies. In 2017 the IMF its own investigation of this phenomenon, in “Gone with the Headwinds: Global Productivity.”
The key findings of this analysis included:
• “As in previous deep recessions, the aftermath of the global financial crisis in advanced economies has displayed “TFP hysteresis”—persistent TFP loss from a large and seemingly temporary shock. Three interrelated factors appear to be behind this pattern:
• “First, in contrast to past recessions, weak corporate balance sheets, combined with tight credit conditions, have undermined TFP growth, partly by constraining investment in intangible assets in distressed firms. In a number of advanced economies, the boom-bust financial cycle and its corollary of weak corporates and banks has also increased misallocation of capital within and across sectors.
• “Second, an adverse feedback loop of weak aggregate demand, investment, and capital-embodied technological change seems to have afflicted the advanced economies.
• “Third, elevated economic and policy uncertainty may have further weakened TFP growth, partly by tilting investment away from higher-risk, higher-return projects.”
• “Crisis-related factors added to important structural headwinds that have been dragging down global TFP growth since before the crisis, particularly including a waning information and communication technology (ICT) boom in the most advanced economies and its spillovers to other economies; an aging workforce, especially in advanced economies; slower human capital accumulation; and slowing global trade integration—including the maturing of China’s integration into world trade.”
• Over the medium term, productivity prospects are highly uncertain. A revival driven by artificial intelligence and other breakthroughs is conceivable, although its magnitude and timing are difficult to predict. Until then, and even if crisis legacies are addressed, productivity growth is unlikely to return to the higher rates of the late 1990s (for advanced economies) or the mid-2000s (for emerging and developing economies) given the structural headwinds.”
A third investigation of the causes of slowing productivity growth was conducted by the Bank of England in 2017. It’s key findings were reported in a speech (“Productivity Puzzles”) by Andrew Haldane, its Chief Economist.
Key findings included:
• “The global productivity slowdown is clearly not a recent phenomenon. It appears to have started in many advanced countries in the 1970s.”
• “The empirical evidence suggests a long tail of countries and companies with low, slow productivity growth. These productivity laggards have been unable to keep-up, much less catch-up, with frontier countries and companies.7 At the same time, an upper tail of companies and countries has maintained high and rising levels of productivity. These productivity leaders are pulling ever-further away from the lower tail. Or, put differently, rates of technological diffusion from leaders to laggards have slowed, and perhaps even stalled, recently.”
• “This empirical pattern sheds light on the two great macro-economic debates. It helps explain why we might see the co-existence of secular innovation (among leaders) and stagnation (among laggards). It helps account for the fall in productivity growth rates – namely, slower rates of diffusion of new innovation to the long lower tail of companies. And it helps explain the widening dispersion in households’ incomes, as the mirror-image of widening productivity differences across firms.”
• Haldane addressed the claim by some that, because of the changed nature of the digital economy (e.g., services like Facebook are given away for free in exchange for individuals’ data), actual productivity growth may be higher than what captured using current metrics. “It certainly seems likely that official statistics underestimate economic activity to some, perhaps significant, degree and with it potential productivity gains. For example, a recent review concluded that productivity growth in the UK might be under-estimated by around 0.5 percentage points per year, as a result of the failure fully to capture elements of the digital economy.
• “That said, most studies have also found that mismeasurement alone is unlikely to account for the majority of the productivity puzzle, whether in the UK or internationally. Many of the mismeasurement problems already existed long before productivity started slowing. These problems would need to have increased dramatically – and probably unrealistically – to explain fully the productivity slowdown. Consistent with that, the slowdown in productivity appears to be largely unrelated to the penetration of information technologies across sectors and countries.”
• “There is plenty of evidence to suggest that financial crises can have a permanent, or certainly persistent, scarring effect on output and productivity in economies. This time’s crisis [the GFC], the largest in at least a generation, is unlikely to buck that historical trend. There are several channels through which financial crises might permanently damage corporate sector productivity.
• “A collapse in credit availability is likely to constrict the financing of both new and existing companies and hence constrain their investment plans. It may hit particularly hard young companies, without access to alternative sources of finance, for whom productivity growth is often fastest. Empirical evidence from the crisis suggests these channels were potent, in the UK and internationally. As credit conditions have eased recently, however, this has become a less compelling explanation for persisting productivity problems.
• Another channel through which the crisis might have slowed productivity is by hindering resource reallocation between firms and across sectors. Flows of capital and labour between companies are one of the key channels through which technology and ideas are diffused. Since the crisis, rates of labour market churn between companies have been low and the dispersion in rates of return across sectors has been high. Both are consistent with lower rates of factor reallocation having contributed to low productivity.”
• Haldane also addressed the hypothesis that by keeping alive “zombie companies” that would other wise have failed (in order to avoid a potential “debt deflation”), central have contributed to the productivity slowdown. “Some have contended that productivity may have been held back by the actions of the authorities, in particular regulatory forbearance and accommodative monetary policies. By supporting low-productivity companies who would otherwise have failed, policy actions may have prevented the “creative destruction” of firms. Certainly, the level of company liquidations and firm exits has remained low in many countries since the financial crisis, probably lower than would have been expected given the path of GDP.”
• “Some economists believe that the type of technological progress behind productivity growth over the past two centuries may not continue at the same pace in the future. One argument is that the current wave of innovation, grounded in ICT [Information and Communication Technologies], does not have the same potential as past innovations. A second is that the ICT revolution is already quite mature and that future progress is likely to be slower. A third is that, with world population expected to peak this century, so too might the pace of innovation.
• “These arguments are contentious and have been the subject of lively debate. Some have argued that the ICT revolution has already had a greater impact on productivity than the steam engine. Others have argued that the ICT revolution is still in its infancy and has vast potential for further disruptive innovation. And a third contends that there are many emerging technologies with the potential to revolutionise the economy, such as robotics, artificial intelligence, Big Data and the human genome.”
• Haldane pays particular attention to the potential impact of slowing technology diffusion across industries and companies on their respective rates of productivity growth. “One way of understanding this global productivity slowdown comes from decomposing it into changes in rates of innovation among countries operating at the productivity frontier and changes in rates of diffusion from frontier to non-frontier countries… If the frontier country is taken to be the United States, then slowing innovation can only account for a small fraction of the global slowing, not least because the US only has about a 20% weight in world GDP. In other words, the lion’s share of the slowing in global productivity is the result of slower diffusion of innovation from frontier to non-frontier countries.”
• “There are a number of possible explanations for such a [diffusion] phenomenon. Stifled competition in certain sectors and for certain products may have prevented the trickle-down of innovation. For example, restrictions on patents and intellectual property (IP) might restrict new entrants and retard replication. A related hypothesis is that, in today’s globalised markets, network economies of scale and scope are more potent, generating natural monopolies in which single or small sets of players dominate market share.”
• “A third hypothesis is that the emergence of a long tail of non-frontier companies, failing to keep pace with innovation, is the result of management failings. For example, Nicholas Bloom and John Van Reenen have shown that weaknesses in management processes and practices go a long way towards explaining the long tail of low productivity companies… Looked at quantitatively, there is a statistically significant link between the quality of firms’ management processes and practices and their productivity. And the effect is large. A one standard deviation improvement in the quality of management raises productivity by, on average, around 10%. This suggests potentially high returns to policies which improve the quality of management within companies.”
• Note that this last point is a subset of another hypothesis. To realize the productivity benefits of the increasing sophistication of technologies, firms need employees with higher skills (e.g., see, “Literacy and Growth: New Evidence from PIAAC”, by Schwerdt et al). In so far as education and training systems are failing to provide enough of the latter, the full productivity benefits of new technologies won’t be realized. Instead, they will be concentrated in those firms that are best able to attract scarce (e.g., see “The Tech Talent Scramble” by Pedro da Costa from the IMF and “The Global Talent Crunch” by Korn Ferry). In turn, the competitive advantage provided by advanced technologies and scarce talents will enable those firms to increase market share, leading to more industry concentration (e.g., see, “Ten Facts on Declining Business Dynamism and Lessons from Endogenous Growth Theory”, and “What Happened to US Business Dynamism?” both by Akcigit and Ates).
• Other authors have found that network economic effects (in which early leads compound) and much more aggressive use of intellectual property protection have also contributed to the widening gap in many industries between leaders and laggards.
• Haldane continues, “some further insight into these puzzles comes from looking at the productivity data in more granular detail. We start by considering sectoral patterns of productivity among UK companies.
• Sectoral shifts in the economy could plausibly account for some of the fall in productivity growth. There has been a secular shift over time away from agriculture to manufacturing and now towards services…Because productivity growth in manufacturing is higher than in services, this shift could plausibly account for some of the fall in aggregate productivity growth. And even within services, there are wide productivity differences [e.g., some studies show that productivity in healthcare and education has been declining, even as they have accounted for a rising share of GDP – e.g., see “Structural Change Within the Service Sector and the Future of Baumol Disease” by Duernecker et al]. Haldane notes, however, that, “even if we correct for this compositional effect, the slowdown in UK productivity growth remains.”
• “The dispersion of productivity across industries has increased significantly over the last 40 years. And the variance in sectoral productivity gaps, relative to pre-crisis trends, also increased sharply after the 2008 crisis. Nonetheless, this pickup in the dispersion of productivity across sectors is dwarfed by the increase in productivity dispersion within sectors. This suggests that any obstacles to the movement of resources within the economy have been more important within sectors than across them.”
• “There has been a widening dispersion in the distribution of productivity across companies over time. In particular, there is a striking and widening divergence between frontier firms (say, the 99th percentile of firms) and the long tail of non-frontier companies. If we define frontier firms as the top 5% of firms by productivity performance, in line with the OECD, there is clear and widening blue water between frontier and laggard companies. In arithmetic terms, it is non-frontier companies that largely explain flat-lining productivity over recent years.
• “These dynamics cast the secular innovation versus stagnation debate in an interesting light. The distribution of UK companies’ productivity suggests both forces have been operating, albeit at different points in the distribution – innovation in the upper tail, stagnation in the lower one. Widening productivity dispersion means that secular innovation and stagnation are complementary, not competing, hypotheses.
• “For a relatively small cohort of frontier companies, secular innovation is clearly evident, with both high and rapidly-rising levels of productivity. For example, around 1% of UK firms have seen average productivity growth of around 6% per year. This poses a serious challenge to the notion that stalling innovation has been the key driver of the productivity slowdown. At the same time, for a large cohort of non-frontier companies secular stagnation is evident, with low and flat-lining levels of productivity. For example, around one-third of UK companies have seen no rise in productivity throughout this century. This is a long tail.
• “A second implication of these results, consistent with the cross-country evidence, is that rates of technological diffusion from frontier to non-frontier companies appear to have slowed. It is stalling diffusion, rather than stifled innovation, that accounts for the UK’s productivity puzzle. These patterns are not unique to the UK. They are shared by a number of other countries internationally.”
In 2018, the OECD commissioned a special report on the determinants of technology diffusion across firms (“Going Digital: What Determines Technology Diffusion Across Firms?” by Andrews et al). The authors report “strong support for the hypothesis that low managerial quality, lack of ICT skills and poor matching of workers to jobs curb digital technology adoption and hence the rate of diffusion.
* “Similarly our evidence suggests that policies affecting market incentives are important for adoption, especially those relevant for market access, competition and efficient reallocation of labour and capital.
* “Finally, we show that there are important complementarities between the two sets of factors, with market incentives reinforcing the positive effects of enhancements in firm capabilities on adoption of digital technologies.”
Another important analysis that bears on falling productivity is “The Corporate Erosion of Capitalism”, by Oren Cass. It presents “a systematic, firm-level study of declining business investment and the recent transformation of the typical American corporation’s business strategy to one that disgorges cash to shareholders while failing to replenish its capital base.” The financialization of capitalism and the decline in capital investment is almost certainly another root cause of the decline in productivity.
A final root cause was suggested by Brynjolfsson, Rock, and Syverson. In “The Productivity J-Curve” they observe that, as I saw firsthand in the eighties and nineties, the realization of the full productivity benefits of advanced technology investments took longer than many companies anticipated, because of the time it took to make necessary and complementary organizational changes (e.g., in processes, systems, structure, and staff skills). Brynjolfsson et al believe the same process is underway again today.
Consulting Firms’ Recent Analyses of the Prospects for Productivity Growth
In the past three years, consulting firms have published a number of analyses of future productivity growth. They are interesting because unlike most productivity studies by economists, they are based on firm-level data.
In 2017, McKinsey published “New Insights into the Slowdown in US Productivity Growth”. Its key findings included:
• “We have a numerator problem: Value-added growth has been declining Not all productivity growth is the same. A simple decomposition of labor productivity into two components, value added as the numerator and hours worked as the denominator, reveals there can be underlying differences in the composition of the resulting productivity growth number. Improvements in productivity can be achieved by efficiency gains, reducing inputs for a given output, or increasing the volume or value of output for any given input. An economy needs both to spur robust growth and prosperity. Efficiency gains are important not only for cost competitiveness at the company, sector, and national levels but also for facilitating the movement of labor and capital to new and growing sectors.
• “Meanwhile, value-added growth, improving the quality and volume of goods and services, facilitates a virtuous cycle of growth whereby increases in value added drive rising incomes that in turn fuel demand for more and better goods and services.
• “Looking closely at labor productivity growth, we find differences in the role the denominator, hours-worked growth, and the numerator, value-added growth, have played in recent years. For example, the period between 1995 and 2004 is considered an era of high growth with annual productivity growth averaging about 3 percent. However, we have found two distinct periods within this decade. The first is from 1995 to 2000 when productivity growth spiked, driven primarily by an increase in growth of real value-added output. Value-added output growth for the total economy, which averaged 3.4 percent annually from 1991 to 1995, increased to 4 percent from 1995 to 2000, a period of booming consumer and IT spending. As a result, productivity growth increased from 1.4 percent to 2.0 percent.
• “The subsequent era of 2001 to 2004 was a period of continued high productivity growth, averaging 3.6 percent a year. However, the underlying driver was a decline in hours worked growth, which fell to negative 0.2 percent partly as a result of the tech crash and the restructuring wave in manufacturing of the early 2000s. So while these two periods are typically treated as a single period of booming productivity growth, we prefer to separate them as the implications for investment, industry evolution, and job expansion are very different…
• “What is striking about productivity growth after the recession ended in 2009 has been low value-added output growth compared with past periods. Growth in real value-added output has declined to 2.2 percent between 2009 and 2014. This compares to growth of roughly 3 to 4 percent in prior time periods. So far there is a lack of consensus about the reason for that stagnation. Is it due to a debt overhang from the recession? Or rising inequality reducing the share of those most likely to spend their income—in other words is consumer and household demand the problem? Or perhaps tightening regulation reducing company incentives to invest? …
• “Understanding the components of aggregate trends is important because industries vary widely in their productivity levels and growth patterns. One longer-term trend behind slower productivity growth, for example, is the shift in employment from manufacturing to service-sector jobs. We calculate that this shift reduced productivity growth by 0.2 percentage points every year for the private business sector between 1987 and 2014, as employment transitioned from high-productivity manufacturing sectors to lower-productivity sectors such as health care and administrative and support services.
• “The shift in the composition of the economy to service sectors raises important questions for productivity growth going forward. What are the drivers of productivity growth in the service sector and how can productivity in these industries be enhanced going forward?...
• “Weak capital intensity growth has occurred across all types of capital In the period from 1995 to 2004, there was a boom in capital intensity growth across most assets, particularly in information capital and software. This period is associated with high labor productivity growth. What is striking is that the most recent period, 2009 to 2014, coincides with both exceptionally low productivity growth and low capital intensity growth across all types of assets…
• “Digitization rates are uneven across sectors—the least digitized tend to be larger sectors often with relatively low productivity As productivity growth trends vary by sector, so do trends in digitization. A closer look at digitization across sectors reveals distinct variations and uneven progress… We calculate that Europe overall operates at only 12 percent of digital potential, and the United States at 18 percent, with large sectors lagging in both. While the ICT, media, financial services, and professional services sectors are rapidly digitizing, other sectors such as education, health care, and construction are not …
In 2018, McKinsey published a deeper look at this last issue, “Solving the Productivity Puzzle: The Role of Demand and the Promise of Digitization.” Key findings included:
• “We calculate that the productivity growth potential [of increased digitization] could be at least 2 percent per year across countries over the next decade. However, capturing the productivity potential of advanced economies may require a focus on promoting both demand and digital diffusion” …
•
• [The benefits of digitization] “have not yet materialized at scale. This is due to adoption barriers and lag effects as well as transition costs… While the first wave of ICT investment starting in the mid-1990s was mostly from using technology to deliver supply-chain, back-office, and later front-office efficiencies, today we are experiencing a new way of digitization that comes with a more fundamental transformation of entire business models and end-to-end operations…
• “There is no guarantee that the productivity-growth potential we identify will be realized without taking action. While we expect financial crisis–related drags to dissipate, long-term drags may continue, such as a rise in the share of low-productivity jobs and slackening demand for goods and services due to changing demographics and rising income inequality; all of these factors may be further amplified by digitization. At the same time, the nature of digital technologies could fundamentally reshape industry structures and economics in a way that could create new obstacles to productivity growth. The amplification of demand drags and the potential industry-breaking effects of digital may limit the productivity-growth potential of advanced economies…
• “There is concern that some demand drags may be more structural than purely crisis-related. There are several “leakages” along the virtuous cycle of growth. Broad-based income growth has diverged from productivity growth, because declining labor share of income and rising inequality are eroding median wage growth, and the rapidly rising costs of housing and education exert a dampening effect on consumer purchasing power. It appears increasingly difficult to make up for weak consumer spending via higher investment, as that very investment is influenced first and foremost by demand…
• “Demographic trends may further diminish investment needs through an aging population that has less need for residential and infrastructure investment. These demand drags are occurring while interest rates are hovering near the zero lower bound. All of this may hold back the pace at which capital per worker increases, impact company incentives to innovate, and thus negatively impact productivity growth, slowing down the virtuous cycle of growth…
• “New digitally enabled business models can also have dramatically different cost structures that change the economics of industry supply significantly and raise questions about whether the majority of companies in the industry and the tail will follow the frontier as much as in the past. For example, in retail, productivity growth in the late 1990s and early 2000s was driven by Tier 2 and 3 retailers replicating the best practices of frontier firms like Walmart. Today, it is unclear if many of Amazon’s practices can be replicated by most other retailers, given Amazon’s large platform and low marginal cost of offering additional products on its platform.”
In another report published in 2018, “Labor 2030: The Collision Of Demographics, Automation And Inequality”, Bain & Company raised similar concerns:
• “Demographics, automation and inequality have the potential to dramatically reshape our world in the 2020s and beyond. Our analysis shows that the collision of these forces could trigger economic disruption far greater than we have experienced over the past 60 years… By the end of the 2020s, automation may eliminate 20% to 25% of current jobs, hitting middle- to low-income workers the hardest. As investments peak and then decline— probably around the end of the 2020s to the start of the 2030s—anemic demand growth is likely to constrain economic expansion, and global interest rates may again test zero percent. Faced with market imbalances and growth-stifling levels of inequality, many societies may reset the government’s role in the marketplace.”
In March 2021, in “Will Productivity and Growth Return After the COVID-19 Crisis?” McKinsey warned that,
• “The economic shock of the pandemic and the response of companies could exacerbate long-run structural demand drags. Our sector-level evidence suggests that 60 percent of the productivity potential prioritizes efficiency over output growth. Accelerated digitization and automation by firms, added to superstar effects, could hasten income polarization and declines in labor share, leading to a “great divide” among both firms and workers.
• “Prepandemic demand, specifically consumption and investment, was structurally weak, and efficiency-focused actions could now weaken it further. After a potential initial consumer-led bounce-back, pressures on employment and income could hold back consumption, which, coupled with uncertainty, could hold back investment… Productivity growth could remain low if most firms do not invest and those that do struggle to grow.”
Finally, in a report last month, McKinsey found that the gap between digital leaders and laggards has been widening (“Tipping The Scales In AI: How Leaders Capture Exponential Returns”):
• “AI leaders hire 65 percent more AI-related workers than other companies do“…
• “Only a small number of businesses have figured out how to make AI work in these ways. Our survey of some 800 companies in the technology, media, and telecommunications (TMT) sectors globally found that just 10 percent of companies are on this path. The rest remain mired in the low to middling stages of maturity, with laggards making up 60 percent of the population and aspirants 30 percent. Underperformers can change their arc, but the window of opportunity to do so is narrowing. Waiting to redouble efforts in AI until the many disruptions of the pandemic begin to dissipate will put laggard companies at a long-term competitive disadvantage because the trajectory that leaders are on will lead to accelerating gains.”
What Policies Have Been Proposed to Overcome The Root Causes of Slow Productivity Growth?
| Root Cause | Examples of Policy Proposals |
| Weak current demand and uncertainty about future demand have inhibited R&D spending and capital investment to deploy new technologies | • Increased fiscal and monetary stimulus after COVID • Policies to reduce income inequality • Given the private sector’s shift in resources from basic science to applied research and commercialization, return government spending on basic science (as a percent of GDP) back to the levels it was at during the high productivity growth era in the 1960s. |
| Combination of need for better infrastructure (e.g., expanded high speed broadband access, both wired and wireless/5G), and need to replace old infrastructure that is in poor condition (e.g., roads, bridges, hospitals, schools). | • Biden Administration’s proposal for a substantial increase in infrastructure investment |
| Productivity of national innovation processes is declining. | • Proposals to change the way government grant funding is awarded • Proposals for direct government funding of innovation in areas that are not attractive to venture capital investors (e.g., upgrading the US electrical grid) |
| Financialization of the economy, including, for example, the rise of private equity, greater use of debt, and higher demands for return of cash to investors via stock buybacks, has reduced capital investment that embodies new technologies. | • Revert to pre-2002 ban on stock buybacks in the US • Eliminate tax deduction for interest expense • To encourage long-term investment, decrease capital gains tax rate with length of holding period (e.g., “Patient Capital” Review in UK) |
| Current debt levels inhibit capital investment that embodies new technologies as well as the efficient reallocation of resources from low to high productivity sectors and firms. | • Streamline bankruptcy and reorganization processes, including restrictions on complex capital structures, credit derivatives, and long draw out legal battles that increasingly characterize insolvency proceedings in developed countries. |
| Network Effects drive “Superstar Firm” phenomenon that reduces competition and thus investment in new productivity increasing technologies. | • Antitrust investigations are currently underway involving Facebook, Amazon, Alphabet/Google and other large technology companies that have leveraged network effects to gain large market share that, in turn, some claim created a “kill zone” within which these large players will acquire new entrants before they can become threats (e.g., see, “American Tech Giants are Making Life Tough for Startups” in The Economist). |
| Adverse changes in institutional structure and regulation (e.g., IP protection, environmental, labor, licensing, and land use regulations etc.) have resulted from an intensifying search by many companies for new barriers to competition and higher economic rents, which have reduced business dynamism and the amount of investment in new technologies. | • Proposals to reduce the complexity of the tax code and other regulatory structures, make anti-trust action easier, and put more restrictions on companies’ ability to lobby government and finance political campaigns. |
| Slow diffusion of productivity increasing innovations and technologies across industry sectors, and across firms within industry sectors (this is both an effect of other drivers, and a cause in itself). | • Weaken intellectual property protections • The UK Productivity Commission proposed making firm-level productivity data visible to the public to strengthen companies’ incentive to improve • Create the management equivalent of the US Agricultural Extension Service to help companies in the “low productivity long tail” improve their management practices |
| Talent shortages (technical and managerial) constrain the diffusion of more productive new technologies. | • Improve the performance of primary/secondary (i.e., K-12), tertiary (i.e., university), and technical education and certification programs, as well as reskilling programs and labor market information systems • Leverage lessons learned during the pandemic about “working from home” to outsource higher value added cognitive work to lower cost talent located around the world |
| Changing structure of the economy – a growing share of GDP now comes from sectors with low/no/negative productivity growth like healthcare, education, and many personal services | • Subsidize technology adoption in healthcare and education • Increase competition in these sectors |
| Reduced international trade limits pressure on companies that drives investment in productivity increasing technologies and other changes. | • Given the increasing conflict between the United States and China, and associated demands for reshoring supply chains, it does not look like increased exposure to international competition will be a future driver of productivity increases. |
| | |
| | |
The number of root causes listed in the above table, and the complexity of the proposed solutions (not to mention the obstacles to enacting them and then implementing at scale) do not paint an encouraging picture of the chances for a significant increase in productivity growth in the years ahead.
In developing alternative future scenarios, our starting point is Andrew Haldane’s conclusion, with which we strongly agree: “It is stalling diffusion, rather than stifled innovation, that accounts for the UK’s productivity puzzle. These patterns are not unique to the UK. They are shared by a number of other countries internationally.”
In turn, the diffusion of advanced technology and other innovations across sectors and companies within them fundamentally depends on two critical drivers: (1) Investments that embody them, and (2) human capital to maximize their potential benefits (with human capital broadly construed to include individual knowledge and skills, as well as organizational processes and structures).
This leads to four broad productivity scenarios based on how uncertainties involving the quantity of investment (high/low) and the supply of high quality human capital (high/low) are resolved in the future.
In May 2021, I estimate the following probabilities for how these two critical uncertainties will evolve over the next 36 months:
• Demand and Investment Growth: High (20%), Low (80%)
• Growth in Supply of Talent: High (40%), Low (60%)
This logically leads to the following four scenarios and associated probabilities:
Scenario #1: The Best of All Worlds: High Growth and Investment with an Increased Supply of Talent Leads to Sustained Increase in Productivity (Probability = 8%)
• High investment with a high supply of high quality human capital.
• High investment requires not just a shot of short-term fiscal and monetary stimulus, but also reduced uncertainty about future demand growth. In turn, this depends on the US/China conflict not worsening, and on overcoming a number of daunting obstacles facing the economy today, including high levels of inequality and indebtedness, and reversal of the intense financialization of the economy and rise of “rentier capitalism” that have developed over the past forty years. It will also very likely require more aggressive action to increase competition in some industries, which may be difficult because of network economic effects that lead to concentration in some digital industries.
• There are a number of ways the talent shortage could be overcome, including using technology like Zoom and Teams to move more high value added work offshore, increasing the number of skilled immigrants (as Canada and Australia do with their talent-based immigration systems), reskilling existing employees (a difficult challenge as we noted in last month’s feature article), and/or substantially improving the performance of America’s K-12 education system (which makes fixing reskilling look like a walk in the park).
• This scenario also requires productivity improvements in large sectors of the economy – like healthcare and education – that have, up to now, vigorously resisted them.
Scenario #2: Stronger Demand and Investment Growth, But with a Talent Constraint that Limits Diffusion and Overall Productivity Improvement (P = 12%)
• In this scenario, the benefits of stronger demand and productivity growth are largely captured by current industry leaders that continue to attract and leverage scarce talent.
• As a result inequality worsens, which eventually undermines the initial strong growth in demand and investment.
• At the same time, the initial strong growth of demand in the face of constrained productivity improvements by many suppliers would likely cause a short-term increase in inflation.
Scenario #3: Weak Demand and Investment Growth Limits the Positive Productivity Impact of an Increase in the Supply of Talent (P = 32%)
• The increase in potential supply relative to demand, along with increasing debt servicing problems, increases the strength of deflationary forces.
Scenario #4: The Worst of All Worlds: Weak Demand Growth and Constrained Talent Lead to No Increase or a Decline in Productivity (P = 48%)
• This is Larry Summers’ “Secular Stagnation” scenario.
• It would also strengthen deflationary forces, via the existing channels of rising inequality, weakening competition in many industries, and increasing debt servicing problems.
High Value Information Observed In April 2021
In our model of the complex global macro system, change drivers are arrayed across a roughly chronological process (albeit one with many feedback loops), in which technological, health, and environmental changes precede changes in the economy and national security, which in turn lead to changes in society and politics, all of which produce (albeit with multiple feedback loops) the effects we observe in investor behavior and financial market valuations and returns.
To generate alternative future scenarios and critical forecasting questions, we use this framework to identify multiple paths across these issue areas, including alternative outcomes for critical uncertainties.
In our methodology, we take a Bayesian approach, and classify new information as significant and highly valuable if either it (1) is an “indicator”, which reduces our uncertainty about the value of a parameter in our mental model for making sense of the dynamic macro system, or (2) it is a “surprise” which increases our uncertainty about either the range of potential values for a parameter or the structure of our model.
With respect to indicators, the higher our priori probability is for a regime, the more we look for indicators that it will not occur, and the lower our prior probability for a regime, the more we look for indicators that it will occur. Put differently, try to systematically search for high value indicators that disconfirm our prior views.
| New Technology Information: Indicators and Surprises | Why Is This Information Valuable? |
| “Combating Ransomware”, Final Report of the Ransomware Task Force Note that this report was published before the recent ransomware attack that shut down the Colonial Pipeline from Gulf Coast to the Northeast US | SURPRISE “Ransomware attacks present an urgent national security risk around the world. This evolving form of cybercrime, through which criminals remotely compromise computer systems and demand a ransom in return for restoring and/or not exposing data, is economically destructive and leads to dangerous real-world consequences that far exceed the costs of the ransom payments alone… “Despite the gravity of their crimes, the majority of ransomware criminals operate with near-impunity, based out of jurisdictions that are unable or unwilling to bring them to justice. “This problem is exacerbated by financial systems that enable attackers to receive funds without being traced. “Additionally, the barriers to entry into this lucrative criminal enterprise have become shockingly low. “The “ransomware as a service” (RaaS) model, allows criminals without technical sophistication to conduct ransomware attacks. At the same time, technically knowledgeable criminals are conducting increasingly sophisticated attacks. “Significant effort has been made to understand and address the ransomware threat, yet attackers continue to succeed on a broad and troubling scale. To shift these dynamics, the international community needs a comprehensive approach that influences the behavior of actors on all sides of the ecosystem, including deterring and disrupting attackers, shoring up preparation and response of potential victims, and engaging regulators, law enforcement, and national security experts. “We also need international cooperation and adoption of processes, standards, and expectations… “While we have identified some recommendations as priorities, we strongly recommend viewing the entire set of recommendations together, as they are designed to complement, and build on each other. “The strategic framework is organized around four primary goals: to deter ransomware attacks through a nationally and internationally coordinated, comprehensive strategy; to disrupt the business model and reduce criminal profits; to help organizations prepare for ransomware attacks; and to respond to ransomware attacks more effectively.” |
| “Sun Tzu Versus AI: Why Artificial Intelligence Can Fail in Great Power Conflict”, by Captain Sam Tangredi, US Navy (Retired) | “Recent Department of Defense (DoD) officials—following the thinking of political and corporate leaders—appear uniformly to perceive (or at least state rhetorically) that AI is making fundamental and historic changes to warfare. Even if they do not know all it can and cannot do, they “want more of it.” “While this desire to expand military applications of AI as a means of managing information is laudable, the underlying belief that AI is a game-changer is dangerous, because it blinds DoD to the reality that today’s battle between information and deception in war is not fundamentally, naturally, or characteristically different from what it was in the past. It may be faster; it may be conducted in the binary computer language of 1s and 0s; it may involve an exponentially increasing amount of raw data; but what remains most critical to victory is not the means by which information is processed, but the validity of the information… “That needs to be emphasized: More data will be false—in a similar fashion to the on-the-spot opinions, tweets, and conspiracy theories that increasingly clog social media. This is a significant problem for both DoD and AI development. “Much of the AI used in the corporate world—particularly concerning internet generated data—has been created with no concern about deliberate deception. However, if one assumes that a potential customer is likely to deliberately deceive a supplier as to the products or services he or she might buy, then the whole model of AI-assisted marketing crumbles. “If one assumes that companies within a supply chain might deceive the assembler as to their part specifications, the supply chain cannot function. If the data is false, AI is no longer a commercial asset for marketing or production—it becomes a liability. “For commercial AI to function, it must assume that it is not being deceived… “Whoever becomes the leader in this sphere will become ruler of the world.” The reality is that it is not the one who has the “best AI” who will dominate politico-military decision-making, but the one—all other elements of power being relatively equal—who has the most accurate, meaningful, and deception-free data.” |
| As the EU proposed new rules on the use of Artificial Intelligence, a case in the UK showed why they are needed. | As the Financial Times’ John Thornhill decribes, in the UK the Criminal Court of Appeal “quashed the conviction of 39 sub-postmasters for theft, fraud, and false accounting” based on evidence provided by a flawed computer system (“Horizon”) that tracked their accounts. “The judgment clears the way for many of the other 700 sub-postmasters prosecuted using evidence from the Horizon system to challenge their convictions” … Thornhill notes that, “from a legal perspective, the affair highlights the dangers of humans blindly accepting the output of automated systems as reliable evidence, the computer never lies mentality” (“Post Office Scandal Exposes the Risk of Automated Injustice”). The proposed EU AI regulations are groundbreaking. In “The EU Path Towards Regulation of Artificial Intelligence”, Marcia and Desouza from the Brookings Institution, explain that the EU proposal “differentiates the uses of AI according to whether they create an unacceptable risk, a high risk, or a low risk. The risk is unacceptable if it poses a clear threat to people’s security and fundamental rights and is prohibited for this reason. “The European Commission has identified examples of unacceptable risk as uses of AI that manipulate human behavior and systems that allow social-credit scoring. For example, this European legal framework would prohibit an AI system similar to China’s social credit scoring. “The European Commission defined high-risk as a system intended to be used as a security component, which is subject to a compliance check by a third party. “The concept of high-risk is better specified by the Annex III of the European Commission’s proposal, which considers eight areas. Among these areas are considered high-risk AI systems related to critical infrastructure (such as road traffic and water supply), educational training (e.g., the use of AI systems to score tests and exams), safety components of products (e.g., robot-assisted surgery), and employees’ selection (e.g., resume-sorting software). “AI systems that fall into the high-risk category are subject to strict requirements, which they must comply with before being placed on the market. Among these are the adoption of an adequate risk assessment, the traceability of the results, adequate information on the AI system must be provided to the user, and a guarantee of a high level of security. Furthermore, adequate human control must be present.” |
| | |
| | |
| | |
| | |
| | |
| | |
| | |
| | |
| | |
| | |
| New Energy and Environment Information: Indicators and Surprises | Why Is This Information Valuable? |
| The Biden Administration announced a target of cutting US greenhouse gas emissions by at least 50% by 2030 (relative to the level at 2005), to achieve net zero emissions by 2050. | SUPRRISE Treasury Secretary Janet Yellen supported the new target, observing that because of the high uncertainty inherent in current climate models, this approach is consistent with the prudence principle. Needless to say, there is much less clarity about the policy changes (and, critically, their economic costs and impact on aggregate demand growth) that will be needed to achieve this target. Equally important is the need for other countries to adopt and implement similar emission reductions in order to slow or stabilize the increasing level of CO2 in the atmosphere (and the related if uncertain increase in average global temperature). |
| “Anthropogenic Climate Change Has Slowed Global Agricultural Productivity Growth”, by Ortiz-Bobea et al | “Agricultural research has fostered productivity growth, but the historical influence of anthropogenic climate change (ACC) on that growth has not been quantified. We develop a robust econometric model of weather effects on global agricultural total factor productivity (TFP) and combine this model with counterfactual climate scenarios to evaluate impacts of past climate trends on TFP. “Our baseline model indicates that ACC has reduced global agricultural TFP by about 21% since 1961, a slowdown that is equivalent to losing the last 7 years of productivity growth. The effect is substantially more severe (a reduction of ~26–34%) in warmer regions such as Africa and Latin America and the Caribbean. “We also find that global agriculture has grown more vulnerable to ongoing climate change.” |
| “Day-To-Day Temperature Variability Reduces Economic Growth”, by Kotz et al | SURPRISE Kotz et al “show that increases in seasonally adjusted day-to-day temperature variability reduce macro-economic growth independent of and in addition to changes in annual average temperature.” On average, “an extra degree of variability results in a five percentage-point reduction in regional growth rates.” |
| | |
| | |
| | |
| | |
| | |
| | |
| | |
| | |
| | |
| | |
| New Economic Information: Indicators and Surprises | Why Is This Information Valuable? |
| Stories about supply shortages and price increases (e.g., in semiconductors) are increasingly in the news as vaccinations and fiscal stimulus drive the recovery of demand. It is important to understand the underlying dynamics, and keep three points in mind. | In complex supply chain networks, the importance of different companies often follows a power law – a problem at most of them has little impact, but a problem at some of them can have a very large impact. For example, in “Quantifying Firm-Level Economic Systemic Risk From Nation-Wide Supply Networks”, Diem et al note that, “Crises like COVID-19 or the Japanese earthquake in 2011 exposed the fragility of corporate supply networks. The production of goods and services is a highly interdependent process and can be severely impacted by the default of critical suppliers or customers. While knowing the impact of individual companies on national economies is a prerequisite for efficient risk management, the quantitative assessment of the involved economic systemic risks (ESR) is hitherto practically non-existent, mainly because of a lack of fine-grained data in combination with coherent methods.” The authors develop a new method for analyzing the entire Hungarian economy at the company level. They find that, “a tiny fraction (0.035%) of companies has extraordinarily high systemic risk impacting about 23% of the national economic production should any of them default.” Perhaps the best-known case of this today is TMSC’s large market share in the production of advanced semiconductors. The authors continue, “firm size alone cannot explain the ESR of individual companies; their position in the production networks does matter substantially.” In this regard, a key uncertainty at this point is how many of these critical suppliers have closed during the pandemic, and how long it will take to replace them. (see also, “Ten-tier and Multi-scale Supply Chain Network Analysis of Medical Equipment: Random Failure and Intelligent Attack Analysis”, by Lavassania et al). Another point to emphasize is that the supply constraints we are seeing today are a logical consequence of the pandemic’s initial shock to demand, in response to which many companies cut back on their orders from suppliers in order to conserve cash. Simultaneously, there was a shock to supply as many companies closed down (e.g., restaurants and schools). Now that they are convinced the economy is recovering, many companies are simultaneously placing new orders with their suppliers, which has resulted in a combination of price increases and delayed fulfillment. They are also trying to get their former workers to return, with varying levels of success. For example, unvaccinated workers may fear doing so, while women who were forced out of the workforce by school closings may be unable to return (and may not do so until they see what is going to happen in the autumn, when schools are scheduled to reopen). Shortages at the lower levels of industry supply chains (e.g., of semiconductor chips) are causing shortages and/or price increases at higher levels (e.g., reduced production of new automobiles, which has causes a sharp increase in demand for and prices of used cars, and a sharp increase in rental car prices, as those companies can’t get new cars to replace the ones they sold off to raise cash to survive the pandemic). A final point is that these supply chain phenomena are mostly transitory. Eventually, supply will catch up to demand and most short-term price increases will slow (whether they will reverse remains to be seen). |
| “The American Economy, Circa 2021”, by Tyler Cowen | “Spending on cars and trucks is 15.1 percent higher than it would have been on the 2019 trajectory; spending on furnishings and durable household equipment is 16.6 percent higher; and spending on recreational goods is a whopping26 percent higher. “Altogether, durable goods spending is running $348.5 billion higher annually than it would have been in that alternate universe, as Americans have spent their stimulus checks and unused travel money on physical items. “The housing sector is experiencing nearly as big a surge. Residential investment was 14.4 percent above its prepandemic trend, representing $90 billion a year in extra activity. And that was surely constrained by shortages of homes to sell, and lumber and other materials used to make them. It is poised to soar further in coming months, based on forward-looking data like housing starts. “Another bright spot is business investment in information technology. The tech industry has been comparatively unscathed by the crisis. Spending on information processing equipment in the first quarter was 23 percent higher than its pre-pandemic trend, and investment in software 7.4 percent higher. However: Spending on transportation services remains 23 percent below its prepandemic trend, recreation services 31 percent, and restaurants and hotels 19 percent. Those three sectors alone represent $430 billion in “missing” economic activity — largely equivalent, it’s worth noting, to the combined shift of economic activity toward durable goods and residential real estate.” |
| “A Policy Matrix for Inclusive Prosperity”, by Rodrik and Stantcheva | SUPRRISE This short but highly useful paper proposes a 3x3 matric to understand issues related to increasing “inclusive prosperity” in the economy. “The discussion of policies can be organized around two questions or dimensions. First, which income group is the target of the policies intended to counter inequality or economic insecurity? Is it mainly the low-income households at the very bottom of the income distribution? Or is it rather the middle classes, who have traditionally had access to good jobs, but are increasingly facing reduced standards of living and growing economic insecurity in many nations? Is it instead the high-income or high wealth households at the very top that keep concentrating more economic power – as well as political power, possibly -- individually and through stocks in large corporations? Policy priorities will naturally differ depending on whether the target is the poor at the bottom, the middle classes, or the top of the income distribution… “The second question relates to the stage of the economy where the intervention takes place. A useful and increasingly frequently used distinction, is between “predistribution” and “redistribution” policies. “In this terminology, “redistribution” policies are ex post policies, that transfer income and wealth once they have been realized (e.g., redistributive transfers, progressive taxation, and social insurance). They reshape inequalities after the economic decisions regarding employment, investments, or innovations have been made. “We will use the term postproduction policies instead to denote these policies. “Pre-distribution” policies are those that directly shape the working of and outcomes generated by markets. We find it useful to further split pre-distribution policies into two categories: pre-production and production stage policies. “Pre-production policies determine the endowments that people bring to the market, such as education and skills, financial capital, social networks and social capital. “Production-stage policies are those that directly shape the employment, investment, and innovation decisions of firms. “Overall, the resulting classification entails a three-fold distinction between preproduction, production, and post-production policies.” |
| “The EU’s Future Hinges On Italy’s Recovery Fund Reforms”, by Andrea Capussela in the Financial Times | “The government of Italian prime minister Mario Draghi is putting the finishing touches to an investment and economic reform programme that is to be powered by some €200bn in EU grants and loans. “This is likely to be the largest national allocation from the EU’s €750bn post-pandemic recovery fund for the bloc’s 27 member states. On the success of Draghi’s proposed reforms hang the prospects not just for Italy’s economic revival but for the fiscal and political integration of Europe. “The EU grants and loans should help to spur growth in Italy after a contraction in gross domestic product last year of 8.9 per cent, the worst annual slump since 1945. “But such growth may not be enough in itself to reverse Italy’s long-term relative decline. “If Draghi’s national unity government were to succeed in overcoming Italy’s deep-seated structural weaknesses with the help of the EU funds, the benefits for Europe could be immense. In Italy itself, Euroscepticism would be dealt a blow. “Elsewhere, critics of European fiscal transfers would find it harder to contend that EU money poured into Italy is a waste. Supporters of integration would be on stronger grounds in arguing that the time is ripe for completing the EU’s economic and monetary union, still only half-built more than 20 years after the euro’s launch.” “However the challenges that must be overcome to achieve this optimistic outcome are immense. “Productivity rose between 1995 and 2019 by little more than a quarter of the Eurozone average. GDP per capita fell to 10 per cent below the Eurozone average from 9 per cent above. “Yet in that quarter of a century, some Italian governments made reform efforts that were more intensive than those of many other EU countries. Except for during the past decade, a lack of investment was not the problem. “Rather, the reason why these efforts achieved little boils down to the weakness of the rule of law and of political accountability in Italy. This sets the country apart from its Eurozone peers and is Draghi’s biggest challenge… “The heart of the question, as so often in Italy, will be the implementation of investment plans and reforms that look good on paper but need to be put into actual practice.” |
| | |
| | |
| | |
| | |
| | |
| | |
| | |
| | |
| | |
| | |
| | |
| | |
| | |
| | |
| | |
| New National Security Information: Indicators and Surprises | Why Is This Information Valuable? |
| In response to tightening Western sanctions on Russia, Vladimir Putin promised a response that would be “asymmetric” and “tough.” It could be a coincidence that shortly thereafter reports emerged of attacks in Washington DC on members of the US intelligence community with the same type of directed energy weapon that has been implicated in previous attacks on US government employees in Cuba and other international locations. Politico later ran a story titled, “Russian Spy Unit Suspected Of Directed-Energy Attacks On U.S. Personnel”. And then came the ransomware attack on the Colonial Pipeline, which was at first blamed on DarkSide, a criminal hacking group believed to be based in Russia. That changed when DarkSide blamed the attack on unnamed “partners” who had used its hacking tools. | Clearly, Vladimir Putin seems to be making good on his threats. However, he is doing this at the same time that Russia’s relationship with China grows steadily closer. This is creating an increasingly dangerous strategic challenge for the United States, and more broadly, NATO and Pacific allies like Japan, Australia, South Korea, and India. |
| “A Strategic Meltdown Over Ukraine Could Doom Taiwan” by Greg Lawson | SURPRISE “Saber rattling once more is infecting the U.S.-Russia relationship with the Biden administration’s offer of “unwavering“ support for Ukraine against Russia. Several things need to be considered in order to avoid a grand strategic meltdown for the United States that includes losing out to China in Asia… “If America is to confront Russia, it should be over something of existential importance. Tempting fate over Ukraine today seems highly risky with limited benefit for the United States and certainly is not of existential import… “The United States, with Europe following along, has long sought to include Ukraine, a nation on Russia’s border, into NATO. This threat is behind a lot of the problems we have had with Russia during the post-Cold War era… “Russia has long asserted that any effort for the West to bring Ukraine into its permanent orbit, through European Union or NATO membership, would be considered a major threat… “By confronting Russia over Ukraine, we leave ourselves exposed to Chinese aggressions elsewhere. Getting bogged down in Europe would afford China an excellent opportunity to exploit our distraction. Already, many of our military leaders fear a Chinese invasion of Taiwan. “Given China’s rise in the economically essential East Asia, its growing clout and constantly improving military, it is reasonable to conclude this is a more essential challenge for the United States than anything Russia is doing… “This is all very dangerous and requires sober assessments by U.S. leaders. However, instead of sober assessments, we get President Joe Biden calling Putin a “killer“ and offering a possible blank check to Ukraine… “Total strategic coherence is probably not attainable, but we should demand something better than the simplistic, moralistic, and ultimately naive thinking on display in Washington, DC right now. Our leaders risk sleepwalking into a grand strategic meltdown that they may not be able to fix.” |
| “What Deters, and Why”, by Mazarr et al from RAND | SURPRISE “The challenge of deterring major conventional aggression is taking on renewed importance in an era of strategic competition. But the nature of that competition, which is primarily playing out below the threshold of major war (at least so far), has created a more immediate and persistent challenge for deterrence: the rise of gray zone aggression, as opposed to conventional interstate aggression. “We define gray zone aggression as an integrated campaign to achieve political objectives while remaining below the threshold of outright warfare. Typically, such campaigns involve the gradual application of instruments of power to achieve incremental progress without triggering a decisive military response. “To help establish how to deter gray zone aggression, we first identified its unique characteristics… “Eight distinctive characteristics of gray zone activities are as follows: 1. Falls below the threshold for military response 2. Unfolds gradually 3. Is not attributable 4. Uses legal and political justifications 5. Threatens only secondary national interests 6. Has state sponsorship 7. Uses mostly nonmilitary tools 8. Exploits weaknesses and vulnerabilities in targeted countries and societies. “In addition, we developed a framework for assessing the health of deterrence in the gray zone. Because many low-end (less-aggressive) gray zone activities cannot be deterred, we identified criteria for deterring high-end (more-aggressive) gray zone activities. “Eight general categories of criteria for deterring high-end gray zone aggression are as follows: 1. Intensity of the aggressor’s motivations 2. Attribution of the aggressor’s role 3. Level of aggression 4. U.S. and partner alignment on unacceptable outcomes 5. U.S. and partner alignment on deterrent responses 6. U.S. and partner proportionate response capabilities 7. Regional and global support for deterrence 8. The aggressor’s expectation of meaningful responses. Using the eight categories of criteria for deterring high-end gray zone aggression, we considered specific deterrence requirements that might apply to the three countries of focus in this analysis: China, Russia, and North Korea… The three case studies outlined in the previous section point to the following implications for the U.S. Army: • Maintaining a local presence and posture plays an important role in conveying likely responses to aggression, reaffirming their credibility. Having ground forces stationed in Japan, the Baltic states, and South Korea is a major signal of resolve that underscores the U.S. promise to respond to aggression at various points on the conflict spectrum. • Clear statements of shared intent to respond to specific actions are critical. To the extent possible, the United States and its local partners should be as explicit as possible about the aggressive actions that will provoke a response. • The leading edges of the U.S. response will be training, advising, and security assistance missions, as well as military sales missions. U.S. partners will be the first responders in all cases of gray zone aggression, and local exercises and partner engagements will be key to reinforcing these agreements and commitments. One or more of the Army security force assistance brigades could be specifically dedicated to gray zone partner assistance missions. • Special forces capabilities can offer an important tailored policy option for gray zone contingencies. In cases where large-scale conventional force presence or even rotational operations may be infeasible for political or logistical reasons, the capabilities of special operations forces can provide an ongoing or intermittent capacity to signal U.S. engagement, enhance local partner capabilities, and build local awareness to improve gray zone responsiveness. • Awareness is critical for response, magnifying the importance of intelligence, surveillance, and reconnaissance. Army intelligence, surveillance, and reconnaissance assets will be especially useful in detecting and anticipating potential gray zone aggression. • The integration of multiple instruments of power is critical to deterrence in the gray zone. The Army would be well served to devote resources to liaison elements that would link its commands with the U.S. State Department, the National Security Council, and other government entities involved in gray zone deterrence. Building gray zone fusion centers inside Army regional commands could be another way to improve coordination.” |
| “The Emergence of Mafia-like Business Systems in China”, by Rithmire and Chen | SURPRISE This paper is not only insightful about the nature of the “private sector” in China, but also provides new insight into important underlying sources of potential future instability in China. The authors, “document the emergence of a particular kind of large, non-state business group that we argue is more akin to a mafia system than any standard definition of a firm... “We argue that mafia-like business systems share organizational principles (plunder and obfuscation) and means of growth and survival (relations of mutual endangerment and manipulation of the financial system)… “Mafia-like business systems are organized to plunder, or to facilitate resource capture and basic theft, mostly of social and public resources. Business groups in many places pursue the capture of rents, for example monopolies on licenses, pet projects, and favorable access to financial capital, but plunder is a step beyond rent-seeking because it involves theft… “Secrecy and obfuscation underlie the organization of mafia-like business systems. As the above data show, many large systems have sprawling connections among firms and are tied to shareholders whose identities are obscured by design… “Mutual endangerment is a pattern of relations [between business leaders and political elites] by which participants hold one another hostage with mutually incriminating information… “These mafia-like business systems are not actual mafia—i.e. they do not threaten and use violence or challenge the state’s monopoly on the use of force—but the widespread extortion, clandestine activity, and use of political threats (of exposure) make them a close analogy… “Mafia-like business systems arose in particular with the expansion of financial markets in China, as regulatory lacunae permitted and political relationships protected racketeering and extortion in equity markets and China’s banking system… “As the Chinese financial system has expanded to include more non-state firms in both equity (stock exchanges) and debt markets (bank borrowings and corporate bonds), plunder has manifest in financial schemes that have shaken the stability of China’s economy and public trust in firms and markets. And as Chinese firms have gone global in the last decade or so, so have schemes of mafia-like system firms. Understanding the particular moral economy that underlies mafia-like business systems and their interactions with the state challenges methodological foundations of research on China’s political economy and helps explain recent conflict between high-profile business people and the state… “Mafia-like business systems are products of acrimonious relationships between business and the state, not friendly ones; certainly, political and business elites have found common cause in mutual enrichment through privileged access to public resources, but these elements of the private sector can indeed pose a significant threat to the regime’s stability in a number of ways, such as revealing compromising information, generating financial or economic instability, capital flight, defection, and migration.” |
| “Inflicting Surprise: Gaining Competitive Advantage in Great Power Conflicts” by Mark Cancian from CSIS | SURPRISE This is a fascinating read. Cancian begins by identifying “seven themes that emerge from the literature and historical experience of surprise: 1. Intelligence and technology can create opportunities. Intelligence helps identify adversary vulnerabilities, and technology generates new systems that can produce unexpected effects. 2. Secrecy is vital. Although in peacetime democracies frequently leak military information with a political dimension, the historical experience shows that democracies can safeguard wartime operational secrets. 3. Deception is real. It does not need to fool an adversary completely, just induce enough uncertainty that an adversary’s actions are delayed or muted. It does require planning, effort, and secrecy. 4. Doing the unexpected or non-standard is often the most powerful generator of surprise. This is one mechanism that allows surprise to occur in the modern era when transparency from public media and enhanced reconnaissance capabilities make so much information known. 5. Generating surprise is often uncomfortable for the perpetrator. It often requires doing the unorthodox and changing customary practices. Hence, generating surprise clashes with the bureaucratic routines and norms of individuals and organizations. It is an aggressive and transgressive act. 6. Effects are temporary. Victims immediately begin to develop countermeasures. Attackers, therefore, need to maximize effects within a narrow window of opportunity. For example, new weapons should not have limited battlefield tests to see how they work. That sacrifices surprise…First-time use on the battlefield should be massive to maximize effect. Initial success needs to be exploited to achieve longer-lasting strategic results. 7. Successful surprise rarely wins wars alone. Many of the iconic examples of successful surprise— Germany’s attack on the Soviet Union in 1941, Japan’s attack on Pearl Harbor, the U.S. invasion of Iraq in 2003—ended in defeat. Thinking about “what comes next,” which often includes a diplomatic initiative, is vital to ultimate success. This requires the strategic self-discipline to compromise. “However, “victory fever”—the belief that even more is achievable—and the desire for vengeance often lead to expanded objectives and overreach, which undermines diplomatic solutions.” Cancian also identifies Chinese and Russian vulnerabilities that could be exploited through the use of surprise: “Inflicting surprise does not occur in a vacuum but is a tool used against specific adversaries. In discussing potential great power conflicts, those adversaries would be China and Russia. Both have great strengths but also great vulnerabilities. These vulnerabilities provide opportunities for the United States… For China, Cancian identifies political/economic vulnerabilities and areas of military/ diplomatic vulnerability: “(1) The need for domestic stability to ensure legitimacy, (2) China’s Hancentric orientation, which serves to marginalizes minorities, (3) a social compact that trades political freedom for economic progress, (4) anti-corruption campaigns that produce disaffected elites,(5) a lack of allies because of threatening and abusive behavior, (6) a lack of recent combat experience in the People’s Liberation Army (PLA), (7) a weak maritime situation, (8) reliance on energy imports and sea lines of communication, (9) limited long-range capabilities to project force beyond the first island chain, (10) weaknesses in the enlisted personnel system, and (11) the centralization of decisionmaking.” Cancian also identifies Russian vulnerabilities: “(1) the Russian people’s dissatisfaction with the regime, (2) weak governance stemming from cronyism, (3) economic dependence on fossil fuels, (4) instability on the periphery, (5) a lack of population east of the Urals, (6) weak alliances, (7) weak cyber defenses, and (8) narrow military modernization.” |
| The Taliban launched a major offensive in Afghanistan, as the first American troops began their withdrawal ahead of the Biden Administration’s 11 September deadline for completing the pullout. | If you are old enough, as I am, to remember the events of April 1975 – the fall of Saigon, the flight of Vietnamese “boat people”, and the angst and anger this triggered in the United States – you have a good idea of what may be coming to your video screens this autumn. Critically, many people don’t remember this; a substantial uncertainty shock is therefore very likely. |
| One of the major petroleum products pipelines in the United States (the Colonial Pipeline system) was shot down by a ransomware attack. | SURPRISE After the FBI identified the Eastern European cybercriminal group DarkSide as being behind the attack, the latter told the Financial Times that, “it was “apolitical” and attempted to deflect blame for the attack on to “partners” that had used its ransomware technology.” This raise two critical issues: (1) Were the “partners” a nation state actor? And what are the implications if this is the case? And (2) does this attack represent the “Mountbatten Moment” for ransomware and similar attacks on critical infrastructure? After Lord Mountatten was killed by the IRA in 1979, UK government policy fundamentally changed, and thereafter took a much more “kinetic” (albeit covert) approach to the IRA and associated groups. Could the Colonial Pipeline attack be a similar turning point? How enthusiastic will criminal hackers be in the future if they know that by pushing the “execute” key, they could put a (literal) target on their back? It is very likely that, despite the absence of press releases, we have crossed the Rubicon this week. |
| | |
| | |
| | |
| | |
| | |
| | |
| | |
| New Health and Disease Information: Indicators and Surprises | Why Is This Information Valuable? |
| “Origin of COVID — Following the Clues”, by Richard Wade https://nicholaswade.medium.com/origin-of-covid-following-the-clues-6f03564c038 | SURPRISE This is by far the most thorough investigation of the origins of the SARS-CoV-2 virus that I have seen to date. Wade is a highly respected science journalist, and this is a must read. He concludes: “If the case that SARS2 originated in a lab is so substantial, why isn’t this more widely known? As may now be obvious, there are many people who have reason not to talk about it… “To these serried walls of silence must be added that of the mainstream media. To my knowledge, no major newspaper or television network has yet provided readers with an in-depth news story of the lab escape scenario, such as the one you have just read…People round the world who have been pretty much confined to their homes for the last year might like a better answer than their media are giving them.” Two critical question are (1) How the accumulating evidence regarding the origins of the COVID pandemic will affect other nations’ attitudes toward China (it’s pretty certain they will harden), and (2) How this will affect Xi’s decisions – e.g., with respect to Taiwan and conflict with the United States. Will harder attitudes on the part of other nations constrain Xi, or make him think he has nothing to lose risking war with the US over Taiwan? |
| April saw the release of a number of studies examining the B.1.617 variant currently spreading in India, as well as the extent of protection provided by current vaccines against other new SARS-CoV-2 variants. | The Bad News: Three preliminary studies confirm that the B.1.607 variant now spreading through India is something to worry about. In “Convergent Evolution Of SARS-Cov-2 Spike Mutations, L452R, E484Q And P681R, In The Second Wave Of COVID-19 In Maharashtra, India”, Cherian et al provide evidence that B.1.617 is more transmissible than the original Wuhan strain. In “SARS-Cov-2 Variant B.1.617 Is Resistant To Bamlanivimab And Evades Antibodies Induced By Infection And Vaccination”, Hoffman et al find that, like the B.1.351 South African and P.1 Brazilian variants, B.1.617 has increased ability to evade the antibodies produced by current vaccines. It bears emphasizing that this represents reduced, by not eliminated vaccine efficacy against these strains. Finally, and most concerning is a third paper, “SARS Cov-2 Variant B.1.617.1 Is Highly Pathogenic In Hamsters Than B.1 Variant”, by Yadav et al. They find that the B.1.617 variant produced more lung lesions and hemorrhages than the original Wuhan strain, which indicates it can cause more serious disease. The Good News: So far, there is no strong evidence that vaccination provides substantially weaker protection against infection by any of the other SARS-CoV-2 variants of concern. Also, if you’ve previously had COVID, just your first vaccine dose has a strong effect. However, if you haven’t previously had COVID, you need both doses. For example, in “Prior SARS-Cov-2 Infection Rescues B And T Cell Responses To Variants After First Vaccine Dose”, Reynolds et al “investigated if single dose vaccination, with or without prior [COVID] infection, confers cross protective immunity to variants… After one dose, individuals with prior infection showed enhanced T cell immunity, antibody secreting memory B cell response to spike and neutralizing antibodies effective against B.1.1.7 [UK variant] and B.1.351 [South African variant]. “By comparison, receiving one vaccine dose without prior infection showed reduced immunity against variants. B.1.1.7 and B.1.351.” |
| COVID appears to be out of control in India and Brazil. | It remains to be seen what the impact will be on their economies, political stability, and relationships with other countries. Given India’s importance to the emerging Quad alliance (between India, Japan, Australia, and the United States) to contain China, this is a critical uncertainty to monitor. |
| “Researchers Are Closing In On Long Covid”, in The Economist | SURPRISE “A wave of what has become known as ‘long COVID’ is emerging in countries where acute cases have been falling. Formally, the condition is called ‘post-COVID syndrome’ (PCS). But even the official definition of its symptoms is fluid, because knowledge of its details is still evolving… “A sufferer typically has several symptoms at a time, with the most debilitating usually being one of three: severe breathlessness, fatigue or ‘brain fog’… “Doctors are focusing on three possible biological explanations. One is that long COVID is a persistent viral infection. A second is that it is an autoimmune disorder. The third is that it is a consequence of tissue damage caused by inflammation during the initial, acute infection… “Britain’s Office for National Statistics (ONS) estimates that 14% of people who have tested positive for covid-19 have symptoms which subsequently linger for more than three months. In more than 90% of those cases the original symptoms were not severe enough to warrant admission to hospital… “Multiply that by the hundreds of millions around the world who have been infected at some point by SARS-CoV-2 , the virus that causes COVID, and a public-health catastrophe may be in the making.” |
| | |
| | |
| | |
| | |
| | |
| | |
| | |
| New Social Information: Indicators and Surprises | Why Is This Information Valuable? |
| “Bread and Circuses: The Replacement of American Community Life” by Lyman Stone from AEI | SURPRISE “In recent years, policymakers and cultural commentators have identified “social capital” as a key factor in determining individual and societal wellbeing. But social capital is often hard to identify. Debates rage about what should count as social capital, how to measure it, what causes people or places to have more or less of it, and whether and how it affects important social outcomes of interest. “This report focuses on one dimension of social capital as particularly important and more concrete: associational life: the various ways Americans spend time together, especially for purposes that are not strictly related to earning money and paying bills… “Most of the change in American associational life can be attributed to essentially one factor: technological improvements leading to a higher standard of living. A wealthier society provides more benefits via the state instead of private organizations… The rise of the modern bureaucratic and welfare state is clearly connected to the decline of many institutions it replaced… “Piggybacking on mass media, popular sports have conquered the American calendar, displacing numerous other activities. This history cannot be undone… The appeal of sports to many Americans is precisely that they have no overt or obvious [political] meaning or significance. Their vapidity is their appeal… “Changes in associational life in America have consequences. As Americans spend less time together, we have also become more suspicious and less trusting of one another, especially of civic and public institutions. “As a result, our society has had a hard time confronting the challenges and obstacles that, throughout human history, have always arisen… “Rebuilding lost associational life will require a critical mass of Americans to make costly personal choices to reinvest in their communities and relationships. “Worryingly, COVID-19 may lead to an accelerating decline in associational life. After most natural disasters, communities band together to recover. But after pandemics, they often do not.” |
| While the US federal government has pledged over $100 billion in federal aid to school districts for the recovery of COVID learning losses, a surprising number of districts have not made plans for how to use it (see, “The Summer Puzzle: Summer Plans To Date Are Lacking In Key Areas”, by Christine Pitts). | This lack of planning has led to a growing number of published “Pre-Mortem” papers, looking back from an imagined future date to explain why this federal aid failed to recover students’ COVID learning losses (e.g., “Hindsight Is 2024: A Pre-Mortem On Districts' Return To School”, by Bree Dusseault from the Center for Reinventing Public Education). Following on substantial public frustration over the quality of school districts’ remote learning offerings during the pandemic, and in many the slow return to in-person learning (often blamed on teachers unions’ opposition), the failure to recover students’ COVID learning losses will have a number of consequences. It will almost certainly lead to worsened lifetime economic outcomes for the affected students, especially given rapidly accelerating physical and cognitive automation technologies. In turn, this will very likely incentivize employers to make greater investments in these technologies (though the success of these efforts will very likely be constrained by a shortage of the talent needed to make maximum use of them). More uncertain, but potentially equally consequential will be the social and political consequences, especially as any failure to recover learning losses will occur in the context of growing frustration over the growth of “wokeism” in K-12 schools. For example, will parental and student anger strengthen anti-elite beliefs, and lead to greater support for right and left populism? Hard to say at this point; however, I suspect that the potential impact is still underestimated by many. |
| “Elites and New York’s Future”, by Miller and de Quenoy | As someone who lived in New York City in the 1970s, this article powerfully hit home. The authors begin with this arresting passage: “’New York City’s problems make for depressing front-page news. More than 11 percent of its jobs have vanished. Small shops are shuttered. Residents are fleeing. The city’s tax base has shrunk, just as its needs and crime rates soar. The celebrated melting pot is no longer melting. “Over 30 percent of city residents receive public assistance. The mayor tries hiding New York’s dire fiscal straits, including its dwindling economic base and rising taxes, through accounting shenanigans, as the city’s deficit and long-term debt spiral’. “This is not a portrait of New York after more than a year of pandemic, though it could be. It was how journalist Ken Auletta described his beloved “Statue of Liberty city” in 1979 in The Streets Were Paved With Gold”, his highly regarded account of how and why New York reached the edge of financial ruin” … Yet, “In the mid-1970s, New York’s financial, labor, and political leaders came together to ward off bankruptcy by hammering out dramatic reforms and extracting drastic concessions from those with a stake in the city’s prosperity. The partnership among City Hall, the banks, municipal unions, big and small business, Albany, and the federal government produced compromises hard to imagine today”… “One of the most striking features of New York’s current plight is the absence of a comparable group of would-be saviors. Many of the wealthiest and most influential residents have been asking not what they can do to help their city, but whether and how quickly they can move their families and companies to places with low taxes and laissez-faire regulation… “There is no comparable effort today by the city’s political and financial elite to unite and forge the compromises and sacrifices needed to spur the city’s revival and save it from long-term decline,” said Richard Ravitch, one of the few veterans of the fiscal crisis still actively involved in efforts to enhance the city’s welfare.” |
| | |
| | |
| | |
| | |
| | |
| | |
| | |
| | |
| | |
| | |
| New Political Information: Indicators and Surprises | Why Is This Information Valuable? |
| “Do External Threats Unite or Divide? Security Crises, Rivalries, and Polarization in American Foreign Policy”, by Rachel Myrick | SURPRISE “A common explanation for the increasing polarization in contemporary American foreign policy is the absence of external threat. Myrick identifies "two mechanisms through which threats could reduce polarization: by revealing information about an adversary that elicits a bipartisan response from policymakers (information mechanism) and by heightening the salience of national relative to partisan identity (identity mechanism)." Myrick finds “that the external threat hypothesis has limited ability to explain either polarization in US foreign policy or affective polarization among the American public. Instead, responses to external threats reflect the domestic political environment in which they are introduced. “These findings cast doubt on predictions that new foreign threats will inherently create partisan unity.” That is not good news. |
| “The Populist-Burkean Dimension in US Public Opinion” by Shakeel and Peterson | SURPRISE The authors explore a critical question in US politics today: What is the relationship between voters’ populist beliefs and how they self-identify on the conservative to liberal spectrum. After reviewing the research on populism, they use voters’ degree of agreement or disagreement with the following statements to determine the extent of their populist orientation: “Q1 Elected officials should always follow the will of the people. Q2 The people, not the elected officials, should make our most important policy decisions. Q3 I would rather be represented by an ordinary citizen than by an experienced elected official. Q4 The political differences between the people and the elected officials are larger than the differences among the people. Q5 Elected officials talk too much and take too little action. Q6 Elected officials always end up agreeing when it comes to protecting their privileges.” The authors call voters who disagree with these statements “Burkeans”, after the British philosopher and politician Edmond Burke. In broad terms, the distinction they make is between two conceptions of the proper role of elected representatives. Populists believe they should be “delegates”, and represent the voters’ views. Burkeans believe they should be “trustees”, who voters expect to autonomously exercise their own good judgment. The authors conclude that “populism is not a mere recapitulation of conservatism”, noting that the correlation between the sample’s scores on the populism and conservatism scales is just .15. The populism score also has just a .12 correlation with respondent’s party identification. The populist orientation can be found among both conservatives and liberals, as well as Republicans and Democrats. Interestingly, Hispanic Americans have higher average populism scores than either African American or White Americans. |
| Beneath the polls showing broad public support for President Biden’s economic stimulus initiatives, a growing number of articles are detailing the increasingly bitter civil wars under way in US Democratic and Republican Parties. | For example, in “Race and the Coming Liberal Crackup”, the New York Times’ Bret Stephens, notes that. “Morally and philosophically, liberalism believes in individual autonomy, which entails a concept of personal responsibility. The current model of anti-racism scoffs at this: It divides the world into racial identities, which in turn are governed by systems of privilege and powerlessness. “Liberalism believes in process: A trial or contest is fair if standards are consistent and rules are equitable, irrespective of outcome. Anti-racism is determined to make a process achieve a desired outcome. “Liberalism finds appeals to racial favoritism inherently suspect, even offensive. Anti-racism welcomes such favoritism, provided it’s in the name of righting past wrongs. “Above all, liberalism believes that truth tends to be many-shaded and complex. Anti-racism is a great simplifier. Good and evil. Black and white. This is where the anti-racism narrative will profoundly alienate liberal-minded America, even as it entrenches itself in schools, universities, corporations and other institutions of American life… “The idea that white skin automatically confers “privilege” in America is a strange concept to millions of working-class whites who have endured generations of poverty while missing out on the benefits of the past 50 years of affirmative action programs. “Similarly, the idea that past discrimination or even present-day inequality justifies explicit racial preferences in government policy is an affront to liberal values, and will become only more so as the practices become more common… Stephens forecasts that the ultimate result of these contractions “will be a liberal crackup similar to the one in the late 1960s that broke liberalism as America’s dominant political force for a generation.” The Republican Party is also beset by factional struggles, which can be divided into two broad groups. The first are those that have long existed – e.g., between big business internationalists, “Main Street” economic conservatives, and western libertarians; between various foreign and defense policy factions; and between social conservatives and some of these other groups. The second one, which grabs most of the headlines today, is between “Trumpists” (which YouGov polling found are about 40% of voters who identify themselves as Republicans) and the fractious groups that make up the “traditional” Republican party. To simplify, Democrats today remain united in support for Biden’s economic initiatives, which poll strongly with American voters, while below the surface tensions are building along cultural (and to a lesser extend foreign and defense policy) fault lines within the party. In contrast, Republicans are united on growing focus on fighting woke cancel culture (and increasingly critical race theory), which polls strongly with American voters, while beneath the surface tensions are building along economic fault lines within the party. In a parliamentary system, these tensions would very likely produce four parties (far and center left, and far and center right) who would have to negotiate party platforms and alliance to form a government. But with its presidential system, that is unlikely to happen in the United States. In the short-term, it seems clear that with Biden’s economic stimulus the Democrats are riding the stronger host. Whether that will enable the party to retain the House and Senate in 2022 remains to be seen. |
| | |
| | |
| | |
| | |
| | |
| | |
| | |
| | |
| | |
| | |
| New Financial Markets and Investor Behavior: Indicators and Surprises | Why Is This Information Valuable? |
| “What Triggers Stock Market Jumps?” by Baker et al | SURPRISE “What drives big moves in national stock markets? The benchmark view in economics and finance holds that stock price changes reflect rational responses to news about discount rates and corporate earnings. Under this view, we expect big daily moves to be accompanied by readily identifiable developments that affect discount rates and anticipated profitability. “Moreover, contemporaneous news accounts should contain information about the proximate drivers of these moves. Of course, stock price behavior may not conform to the benchmark view. “Keynes (1936), for example, famously argued that investors price stocks based not on their opinions about fundamental values but on their opinions about what others think about stock values. “Even when speculative or irrational forces are in play, however, we expect contemporaneous news accounts to discuss the (perceived) drivers of big market moves. Thus, we turn to newspapers to distill information about what triggers big moves in national stock markets. “Specifically, we examine next-day newspaper accounts of big daily moves (“jumps”) since 1900 in the United States, since 1930 in the United Kingdom, and since the 1980s in 14 other national markets. A threshold of 2.5 percent, up or down, for the U.S. stock market yields 1,150 jumps from 1900 to 2020. These jumps account for only 3.5 percent of trading days but nearly 20 percent of total daily variation (sum of absolute returns) and half of daily quadratic variation (sum of squared returns). Our jump thresholds for other countries range from 2 to 4 percent, with larger thresholds for markets with greater volatility. All told, we examine 6,200 daily stock market jumps across 16 national markets plus another 450 jumps in U.S. bond markets from 1970 to 2020… “Leveraging our jump-day characterizations, we develop several novel findings. First, upward jumps attributed to policy-related news are more common than downward policy-driven jumps. This pattern holds in every country, and it has strengthened since 1980 in the United States and the United Kingdom, the two countries with pre-1980 coverage. From 1980 to 2020, upward policy jumps are twice as common as downward policy jumps in the United States. “Over the same period, downward jumps attributed to non-policy factors are nearly twice as common as upward non-policy jumps. To put the point another way, policy-related developments trigger 43 percent of upward U.S. jumps since 1980 but only 20 percent of the downward jumps… “Drilling down, we find that news about monetary policy and government spending is responsible for this pattern. “One potential explanation is that positive (negative) monetary policy and government spending surprises are more (less) likely in the wake of bad economic news… “Our second set of findings is that jumps attributed to monetary policy developments foreshadow considerably less volatility than other jumps… “Our third set of findings pertains to clarity about the reasons for stock market jumps. Our clarity measure fluctuates over time in a positively autocorrelated manner, and it shows a clear upward trend. “Over the past 90 years, the share of jumps due to unknown forces fell from about 35 percent to 10 percent in both the United States and the United Kingdom. The other components of our clarity index – journalist confidence, pairwise agreement rates, ease of coding – tell a similar story. As we discuss, there are sound reasons to think the trend toward greater clarity about stock market behavior reflects a combination of more transparency about corporate performance, better statistical information about the economy, falling communication costs, and the professionalization of news reporting… “Finally, we find that news about U.S. economic and policy developments exerts an extraordinary influence on equity markets around the world. Excluding the United States and focusing on the other 15 national markets covered by our study, news about U.S.-related developments triggers 32 percent of all equity market jumps from 1980 to 2020… “News about economic and policy developments related to European countries and supranational European institutions seldom drives jumps in non-European the countries, with the clear sustained exception of the European sovereign debt crises in the early 2010s. “China-related news plays almost no role as a source of jumps in other countries before the mid 1990s, but China related news has since emerged as an important source of market jumps in other countries.” |
| “Exponential Numeracy”, by Bitterly et al “Anticipating Trajectories of Exponential Growth”, by Hutzler et al | While not a surprise, these two research papers confirm the existence of an important, if underappreciated, source of many forecasting errors. To be blunt, the human mind is wired to understand linear change. Most of us are befuddled by non-linear change. Unfortunately, time delayed, non-linear effects are common in complex adaptive systems like political economy and financial markets. Bitterly et al note that, “by failing to understand exponential relationships, policy makers and individual decision makers undervalue the importance of early and aggressive interventions.” Hutzler et al find that non only do “humans grossly underestimate exponential growth, but at the same time they are overconfident in their (poor) judgment.” |
| “Yale Endowment Model Architect Hunter Lewis Calls Time On It”, by Aziza Kasumov in the Financial Times | With most asset class valuations extremely high, a respected industry veteran has raised some important questions about traditional approaches to investment management. Hunter Lewis is the co-founder of Cambridge Associates, which provides asset allocation and manager selection advice to many defined benefit pension plans, foundations, and family offices. In Kasumov’s article, he criticizes the Yale Endowment asset allocation model (“defined by a heavy equities weighting and chunky allocations to private equity, venture capital and hedge funds”), terming it “backward looking, outdated and worn out.” His key criticism is that, “private equity and venture capital have become too crowded and the so-called illiquidity premiums have been eaten up by large fees.” These echo points we (and others) have made in the past (and will continue to make). |
| Goldman Sachs announced that it had completed its first Bitcoin-linked derivatives trades. | Just what the world needs, in the midst of overvalued global markets awash in liquidity and the speculative pursuit of higher returns… |
| | |
| | |
| | |
| | |
System Tipping Points/Critical Threshold Analysis
Like Professors Andrew Lo, Doyne Farmer and others, we regard financial markets as a complex adaptive system (CAS), that exist as part of a larger macro system comprised of other CAS between which there are multiple feedback loops. These other systems include those that produce technology innovations, and economic, environmental, national security (including cyber), social, demographic, and political outcomes.
We also find that these systems tend to operate and generate effects in a rough chronological sequence, albeit with many feedback loops between them. The following chart highlights that the changes we observe in different areas at any point in time are actually part of a much more complex evolutionary process.
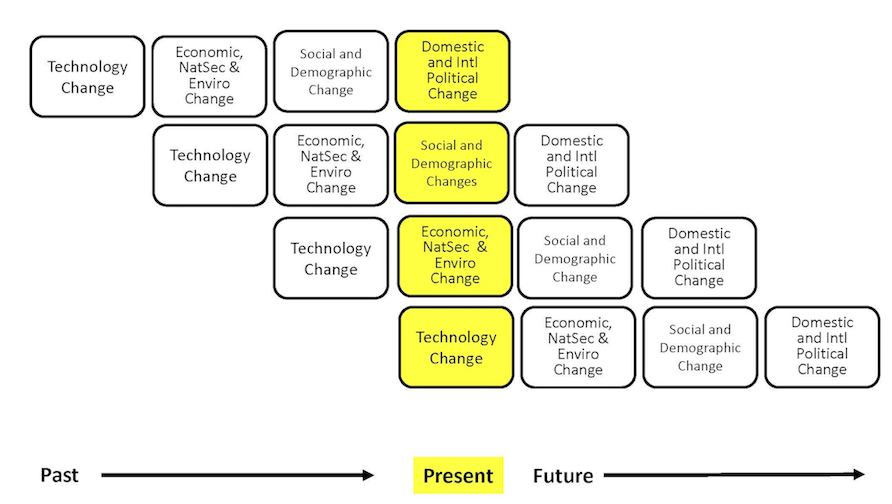
While most media coverage of these systems focused on flows (e.g., the size of the government deficit), rapid non-linear change in complex adaptive systems is often caused by a key stock (e.g., the amount of outstanding government debt) exceeding a critical threshold.
The next table highlights the key macro system stocks that we monitor.
In the next section, we will discuss information received over the past month that is related to these stocks, and which we believe is significant to our assessment of the probabilities that a critical threshold will be reached and a regime change will occur. We will conclude with our estimate, at the end of this month, of how close the macro system is to these critical thresholds, and the implications for financial market regime change probabilities.
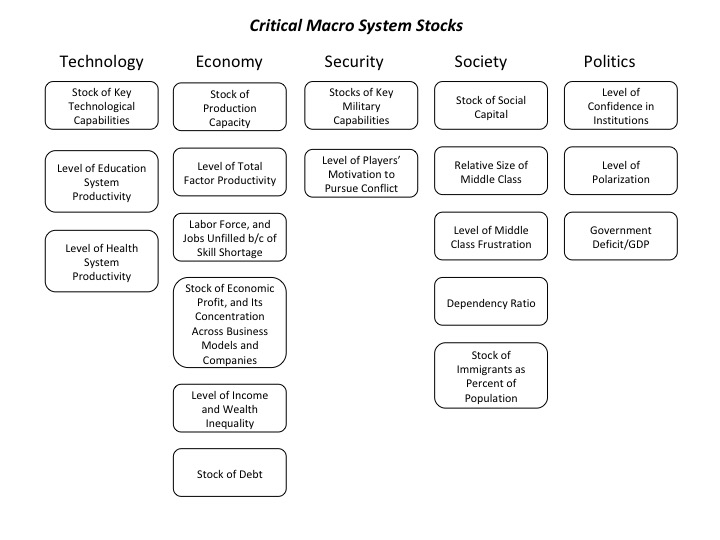
How Close is the Macro System to One or More Critical Thresholds?
As we have noted, the macro drivers of financial market regime changes typically follow a rough chronological sequence, from technology to economic, security, social, and political causes and effects. Yet there are many feedbacks loops between them, creating complex root causes for many of the critical thresholds we have identified.
Understanding the time dynamics in this complex system is critical to avoiding substantial downside investment risk.
We use the UK Met Office Warning Model to communicate our assessment of these time dynamics. We estimate the time remaining before a critical macro system threshold is reached that could trigger a regime change, which is usually accompanied by substantial changes in asset class valuations.
The model uses three increasingly serious levels of warning, from “Be Aware” (condition yellow), to “Be Prepared” (condition orange), to “Take Action” (condition red).
For our purposes, we denote as “Be Aware” (yellow) critical thresholds that we assess to be three or more years away. We estimate that “Be Prepared” (orange) thresholds could be reached within 1 to 3 years. “Take Action” thresholds are very likely to be reached within one year.
Given their nature, we also note that in our three “wildcard” areas (Environment and Energy related; Disease and Human Caused Bioevents; and Cyber and Electromagnetic Events), our forecasts have higher levels of uncertainty.
The following charts summarize our current estimate of the time remaining before different critical thresholds will be reached.
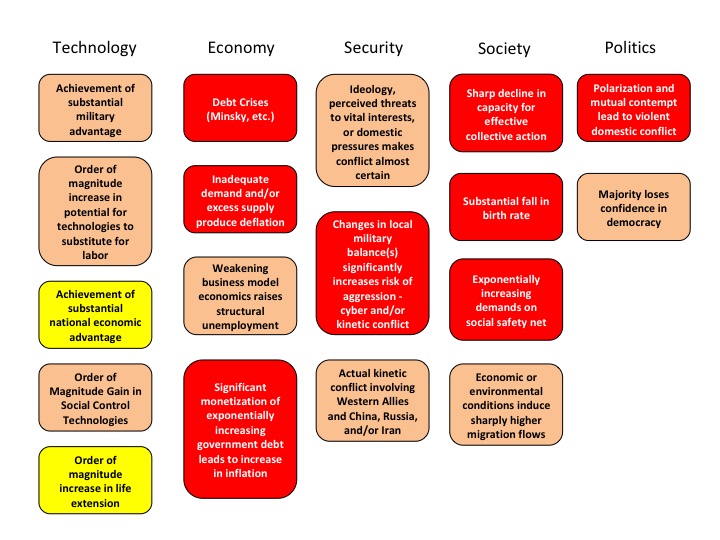
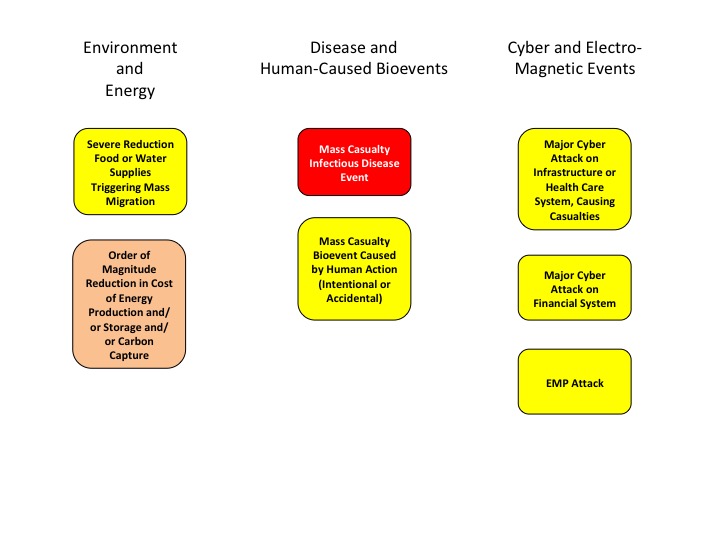
At the highest level, we believe the complex adaptive global macro system can be in one of four states, based on its degree of order versus disorder, and degree of social cooperation versus conflict. A very coarse-grained reading of history suggests that these states evolve in a predictable cycle, from ordered/cooperative, to disordered/cooperative, to disordered/conflicted, to ordered/conflicted.
We believe that the system is currently in its most uncertain state, characterized by high degrees of underlying disorder and social conflict, both domestically and internationally. Beyond some point, intensifying conflict eventually increases the degree of order in the system. That appears to be happening now, via the increasing conflict between China, Russia, and Iran and the United States and other Western nations.
If you have any questions about anything we have written in this issue, please don’t hesitate to get in touch, at contact@indexinvestor.com
Appendix: Anticipatory Thinking and Forecasting Methodologies
Our process is based on methods and tools developed over the past seven years at our affiliate, Britten Coyne Partners, which provides consulting services and education courses to executive teams and boards on strategic risk governance and management.
At The Index Investor, we engage in both anticipatory thinking to identify what could happen (e.g., different macro regimes and related events), and forecasting, to estimate the probability that events and regimes will happen, and the impact they will have if they do (e.g., on macro variables and broad asset class returns).
With respect to what could happen, we are acutely conscious of the conclusion reached by a 1983 CIA study of failed forecasts: "each involved historical discontinuity, and, in the early stages…unlikely outcomes. The basic problem was…situations in which trend continuity and precedent were of marginal, if not counterproductive value."
When it comes to forecasting, we know that in complex socio-technical systems that are constantly evolving, the accuracy of statistical or machine learning based forecasting methods declines exponentially as the time horizon lengthens, since the historical data set on which they were trained will (depending on the speed and effectiveness of any retraining cycle) bear less and less resemblance to the distribution of outcomes the system is likely to produce in the future.
Under these circumstances, forecast accuracy over longer time horizons depends on causal and counterfactual reasoning about the possible future effects of multiple interacting trends and uncertainties that are hard to quantify.
And we are acutely aware of the economist Rudi Dornbusch's famous warning: "Crises take a much longer time coming than you think, then happen much faster than you would have thought."
Our forecasting process also draws on lessons Tom Coyne learned from spending four years as a member of the Good Judgment Project team, which won the Intelligence Advanced Research Projects Activity’s forecasting tournament with forecast accuracy that was more than 50% better than the tournament's control groups (the team's experience is described in Professor Philip Tetlock's book, “Superforecasting").
Our analysis focuses on the probability of the global macro system being in four possible macro regimes 12 and 36 months from the date of our forecast: (1) Normal Times, where equity asset classes perform well; (2) a High Uncertainty regime that is usually short and transitory, where asset classes like short-term government bonds perform best and equities suffer significant declines; (3) High Inflation (which we deem 5% or more, year-on-year), where commercial property, real return bonds and other traditional hedges are favored; and (4) Persistent Deflation (a year-on-year decline in the US CPI), which up to now has only been seen in Japan, and in which the relative performance of different asset classes remains uncertain, but will likely favor high quality bonds and the consumer staples equity sector.
In response to subscriber requests, we have added a 36-month regime forecast to our existing 12 month forecast. The logic is that, in a complex evolving system like global macro, a longer forecast horizon gets beyond the “detection range” of algorithmic forecasting approaches, and therefore raises probability that a manager/investor can gain an edge in identifying emerging threats and opportunities.
That said, because evolving (i.e., “non-stationary”) complex systems populated by highly connected human agents are also capable of sudden non-linear changes (with which are hard for algorithmic approaches to predict), we are also keeping our 12 month forecast.
Our forecasting methodology starts with base rate/reference case data about the historical probability of large changes in equity and bond valuations. We then analyze the current situation from both a quantitative and qualitative perspective. In the latter, we focus on the key endogenous drivers of macro regime change, including technological, economic, national security, social, and political trends and uncertainties. We also focus on three potential sources of exogenous shocks that could also produce a macro regime change, caused by environmental, disease, and cyber related events.
While most of our attention typically focuses on various flows (e.g., economic growth, change in the price level, sales, earnings, job creation, etc.), endogenously caused regime changes result when those flows push key stocks beyond a critical threshold or tipping point, often setting off non-linear reactions across multiple areas. As noted by Hyman Minsky and others, a classic example is the steady accumulation of outstanding debt until it reaches the point where it can no longer be serviced and triggers a crisis.
Base Rate Data
Since the end of World War Two, there have been fifteen months where a downturn in the US equity market began that eventually reduced asset class value by 20% of more. That is a hazard rate of about 1.75% per month. Put differently, in any given month there is a 98.25% probability that a 20%+ downturn won’t occur, or, in a given year, an 81% probability.
However, as the time without a 20%+ downturn extends, the compound probability that one will not occur shrinks. At the end of August 2018, it is more than nine years since the last equity market decline of 20% or more. The probability of that happening is only 15%.
To estimate the base rate for a 20% fall in bond prices (which historically has been caused by a sharp increase in inflation, as we saw in the late 1970s and early 1980s), we analyzed monthly historical AAA bond yields since 1919. For consistency, we used them to calculate the price of a ten-year zero coupon bond. We then calculated the probability of a price decline of 20% or more over three different holding periods: 12, 18, and 24 months. In any month, the annualized probability of a decline of 20% or more over the subsequent 12 months is 12%; over 18 months, 20%, and over 24 months, 25%.
Market Stress Indicators Methodology
We view financial markets as a complex adaptive system. The size of changes generated by such a system follows a power law rather than a normal (Gaussian) distribution. The critical point is that large changes are much more common in complex adaptive systems than most people’s intuition leads them to believe.
While predicting the behavior of complex adaptive systems remains far more art than a science, various researchers have found that large changes in such systems are often preceded by subtle warning signs, as stress accumulates within them. While this research is not definitive, we believe that five warning signs are worth monitoring as potential indicators of growing stress within financial markets that could suddenly give rise to large changes in asset class valuations.
Our first indicator is the month-to-month autocorrelation of broad asset class returns (i.e., the relationship of this month’s returns to last month’s). A system under increasing stress loses resiliency, causing it to take longer to recover from perturbations; hence, autocorrelation increases as it approaches a critical transition (see, “Early Warning Signals for Critical Transitions” by Scheffer, et al).
The second market stress indicator we monitor is the Economic Policy Uncertainty Index published by the Federal Reserve Bank of St. Louis (via its FRED economic database), which is based on research by Baker, Bloom, and Davis (see their paper, “Measuring Economic Policy Uncertainty”). The index is based on automated text analysis of leading newspapers and magazine publications, to identify the frequency with which words and phrases are used that indicate uncertainty.
In humans’ evolutionary past, when uncertainty increased the probability of survival was enhanced by staying close to a group. All of us still have that instinct. Research has found that as uncertainty increases, we have an unconscious bias towards higher conformity of our own views with those of a larger group (i.e., reduction in cognitive diversity). Behaviorally, heightened uncertainty induces more “social copying” of others, likely due to both conformity bias and the rational belief that others may be acting on the basis of superior information. This increase in conformity and copying makes a social system more ordered as uncertainty increases, and also reduces its responsiveness to perturbations (i.e., increases autocorrelation) because of delays in the social copying process.
The key point is that increasing uncertainty induces more, not less order in social systems, and in so doing primes them for sudden non-linear change.
Our third market stress indicator is the spread between the yield on AAA rated bonds and the 10-year US Treasury. This is a proxy for the level of investor concern about financial system funding liquidity.
Our fourth market stress indicator is the yield spread between speculative BB rated bonds and the ten-year US Treasury. Throughout history, excessive credit growth has been a root cause of many financial crises. An indicator of such growth is falling credit spreads, particularly in the case of riskier borrowers. In contrast, rising BB spreads indicate growing investor concern about the consequences of such growth, and the financial distress lower rated companies could experience in an economic downturn.
Our fifth market stress indicator is what we term the “political risk premium” that is implicit in the price of gold. Our starting point for estimating this premium is the three different roles that gold plays. First, gold is a store of value in a world of fiat currencies. When the rate of money supply growth exceeds the growth of nominal GDP, gold’s price should increase to maintain its purchasing power. Between 2007 and 2017, the US money supply (M2) grew by about 86%, while nominal US GDP grew by 35%. The stock of gold grew by 18%, based on mine production over this period. We therefore infer that 33% of the increase in the price of gold represented the maximum potential gold price change that could be attributed to a desire to hedge inflation risk (86% less 35% less 18%).
Second, gold is a unit of account. We take this to mean that the annual change in GDP expressed in terms of physical gold (i.e., nominal GDP divided by the price of gold) should equal the change in real GDP calculated using the GDP price deflator to account for actual inflation over the period. A key challenge is the point at which to start this calculation.
We chose the price of gold in 1995/1996. In that period, the change in real global GDP measured using the IMF’s price deflator just about equaled the change in GDP measured in terms of physical gold. We interpret that coincidence as indicating that at that point in time, concerns about future inflation and political risk were minimal, and the change in the price of gold was mostly driven by its role as a unit of account. We calculated a subsequent series of gold prices that would produce the same change in “gold GDP” as the actual real GDP as calculated by the IMF. Between 2007 and 2017, “gold as a unit of account” warranted a 21% increase in its price.
Gold’s third role is as a hedge against inflation and what we term “political disaster” risk. We subtract the 21% estimated compensation for actual inflation from the 33% “gross” inflation risk hedge to derive an apparent 12% increase in the gold price that reflected the true risk premium to hedge against possible future inflation. However, between 2007 and 2017 the price of gold actually increased by 81%. This implies that 48% of this (81% less 21% less 12%) represented a premium for some other type of uncertainty at the end of 2017. The interesting question is the nature of the uncertainty for which gold is believed by some investors to be a superior hedge than traditional ports in a storm like short-term US government securities, or similar securities issued by other developed countries.
The logical inference is that the uncertainty in question must reflect a situation in which short term US Treasuries would be a less effective hedge than gold. This could be a world of widespread hyperinflation, capital controls, and/or radical changes in nations’ governments (of course, this would also imply a preference for investing in gold coins rather than bullion, as while the latter may be a store of value, it is far less convenient as a means of paying for transactions).
To put this in further perspective, this gold price “disaster risk” premium sharply increased from 2008 to 2012, then declined before sharply increasing again after 2016. Arguably, a significant part of the former increase reflects concerns about the potential inflationary consequences of dramatic quantitative easing by central banks. But this is not likely to be the case after 2016.