The Index Investor
May 2020
Tactical Asset Allocation Implications of Our Forecasts
Forecast Logic
Forecast Pre-Mortem Analysis
Combining and Extremizing Forecasts to Improve Predictive Accuracy
Feature Article: The Complex Dynamics of Our New Cold War: A Brief Net Assessment
High Value Information Observed Last Month
Critical System Thresholds/Tipping Points Analysis
Appendix: Anticipatory Thinking and Forecasting Methodologies
Current Macro Forecast
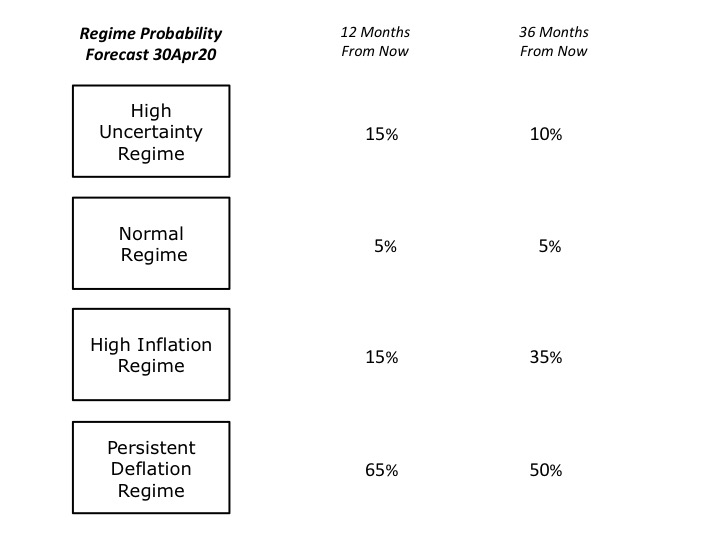
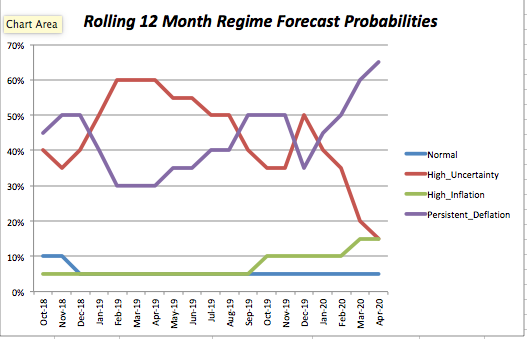
The key driver of our forecast change was the appearance of actual CPI deflation in the United States, along with our conclusion that equity markets have substantially underestimated the underlying damage COVID19 has done to the demand side of the US economy (which will quickly become apparent if the US Congress fails to pass another stimulus bill to support middle and lower income households).
We have made no change to our 36-month regime forecasts. The probability the United States will be in the Persistent Deflation Regime remains 50%.
This forecast rests on three assumptions. The first is that the increasing headwinds that were restraining aggregate demand growth before the devastating arrival of the COVID-19 pandemic will almost certainly worsen. These headwinds included population aging, weak productivity growth, declining labor share of GDP, high levels of both inequality and debt, and the growing threat of job displacement as increasingly capable automation and artificial intelligence technologies are deployed.
The second assumption is that COVID19’s unprecedented demand and supply shocks will worsen debt servicing problems, and lead to rising defaults and liquidations.
The third assumption is that the lagging recovery of demand, accelerating debt problems, and continued increase in tensions with China (see this month’s feature article) will keep uncertainty higher than most people currently expect, which will further depress aggregate demand relative to supply and cause price declines in many sectors.
Our 36-month forecast probability for being in the High Inflation Regime remains at 35%.
Whether the High Inflation Regime comes to pass will depend on the future evolution of, and interaction between, the demand and supply shocks, COVID19 had created. We know that the demand shock has been swift and severe, and has triggered falls in the US Consumer Price Index. A critical uncertainty is how long the demand shock will last.
In the absence of a vaccine, social distancing (and the possibility of second, third, and subsequent waves of seasonal coronavirus) will permanently depress demand in many service industries (and therefore reduce the stimulative impact of government deficits on consumer spending).
Increasing layoffs, high debt service burdens, and higher levels of precautionary savings in the face of continuing uncertainty will further depress domestic demand, and thus private domestic investment demand as well.
However, the nature of the COVID19 shock to aggregate supply is also important; many past episodes of high inflation were caused by supply side shocks (e.g., oil supply cutbacks in 1973 and 1979).
The combination of weak demand, high debt levels and a bankruptcy process that is much less favorable to small and medium sized businesses than to large ones will almost certainly lead to a sharp reduction in supply in some sectors (e.g., restaurants). Social distancing rules could have the same effect, even if a company stays in business. Think of a restaurant that can now seat only one third as many people as before, and must therefore triple its prices to stay in business (assuming that doesn’t destroy its demand).
COVID19’s disruption of global supply chains (reinforced by the new cold war between China and the United States) will also almost certainly lead to reshoring of production, which could create new jobs and supply. However, the impact of reshoring on supply side costs is uncertain; greater use of automation could result in lower supply costs at reshored facilities, while greater use of labor with scarce skills could raise them.
On balance, at this point it seems much more likely that the COVID19 shock’s net impact on demand and supply will lead to the Deflation Regime rather than the High Inflation Regime.
Finally, at the 36 month time horizon, the forecast probabilities for the High Uncertainty (10%) and Normal Regimes (5%) remain unchanged.
Portfolio Allocation Implications of Our Forecast
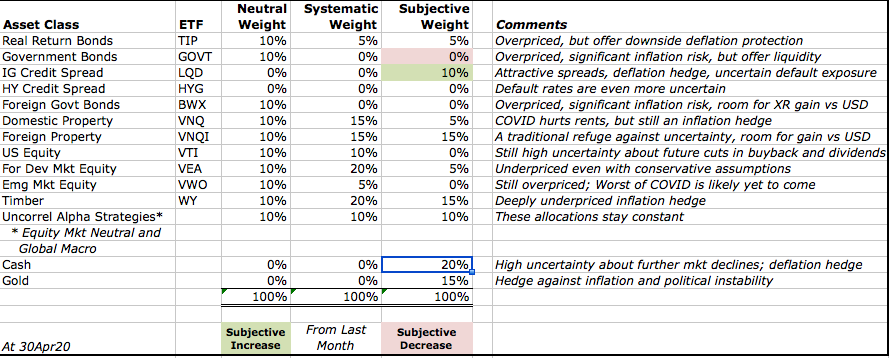
We take two approaches to deriving the tactical asset allocation implications from our analyses. The first takes a systematic approach, and is based on relative asset class valuations. Our starting point is our “neutral” model portfolio, which is equally weighted across nine broad asset classes, and also includes a 10% allocation to alpha strategies (equity market neutral and global macro) that are designed to have a low correlation to returns on broad asset classes. Based on asset class valuations, we systematically vary the asset class weights (but not the active strategy weight), increasing from 10% to 15% when an asset class is likely undervalued, and 15% when it is very likely undervalued. In the case of overvaluations, we go to 5% and then into cash, if there are no undervalued asset classes with room for an increase. In effect, this replicates the systematic rebalancing strategy we used for 15 years in our previous model portfolios.Based on subscriber requests, this month we are re-introducing a feature from the previous version of The Index Investor: Tactical Asset Allocation Implications from our analyses.
The second tactical approach is based on our subjective view not only of current asset class valuations, but also of the implications of the broader macro trends and uncertainties that we analyze each month. Importantly, this subjective view reflects our primary goal of avoiding large downside losses, rather than seeking large upside gains.
Two final notes: First, with respect to US fixed income, we include credit products (investment grade and high yield) in the same asset class as government debt, and will shift into the former when their valuations become attractive. Second, we regard gold not as a separate asset class to be held long-term, but rather as a complement to cash, into which we shift in periods of substantial overvaluation across multiple asset classes.
More information about our investment beliefs, including our core philosophy, approach to asset allocation (including our model portfolios and their long-term track record), and views on various approaches to active and passive management can all be found here.
Here is our latest asset allocation view:
Forecast Logic: Quantitative Indicators
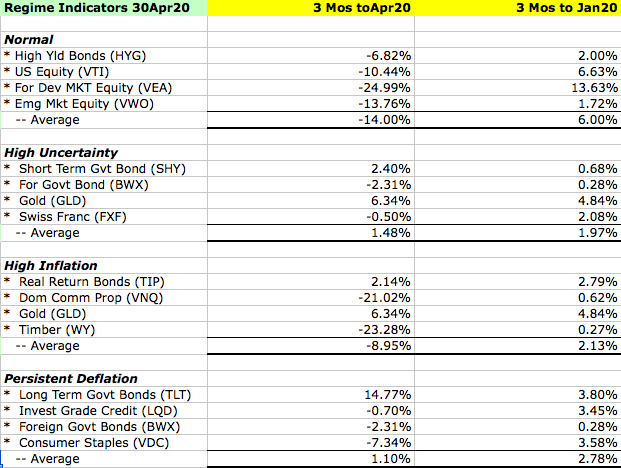
Implications of the Most Recent Three Month Asset Class Returns
Our quantitative forecast methodology focuses on the level and change in three-month returns, over the most recent and previous three-month periods, for those asset classes, which should perform best under different regimes (in this sense, our regimes can be regarded as macro factors). We assume that relatively higher returns are associated with more widely held investor beliefs in the probability that a given macro regimes will develop in the future.
Asset Class Valuation and Momentum Indicators (@30Apr20)
| Asset Class (ETF) | Valuation | 1 Month Return | Conclusion |
| US Real Return Govt Bond (TIP) | Likely Overvalued* | 3.02% | Increasing Overvaluation |
| US Nom Return Govt Bond (GOVT) | Likely Overvalued* | 0.31% | Increasing Overvaluation |
| US Investment Grade Credit (LQD) | Likely Undervalued* | 4.83% | Decreasing Undervaluation |
| US High Yield Credit (HYG) | Likely Overvalued* | 4.86% | Increasing Overvaluation |
| US Commercial Property (VNQ) | Very Likely Undervalued* | 5.28% | Decreasing Undervaluation |
| US Equity (VTI) | Likely Overvalued* | 13.13% | Increasing Overvaluation |
| Foreign Devel Mkt Equity (VEA) | Very Likely Undervalued* | 7.02% | Decreasing Undervaluation |
| Emerging Markets Equity (VWO) | Likely Overvalued* | 7.81% | Increasing Overvaluation |
| Timber (WY) | Almost Certainly Undervalued* | 29.03% | Decreasing Undervaluation |
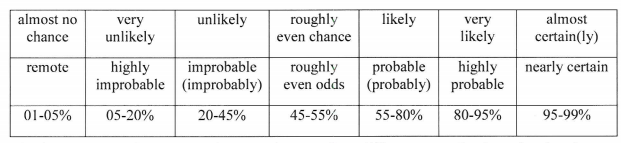
Note: The language we use to describe our estimated likelihood of asset class over or undervaluation is based on US Intelligence Community Directive 203 on Analytic Standards, which includes the following table:
Market Stress Indicators (@30Apr20)
| Market Stress Indicator | This Month vs Last Month |
| Asset Class Returns Autocorrelation (this month versus last month). Higher autocorrelation is an indicator of higher market stress. | .66 vs .76 the previous month. This indicates a high level of market stress. |
| Economic Policy Uncertainty Index (how many days over the last 30 was index in top quartile of values since 1985?). A higher number equals more market stress. | On 30 days last month the index was in the top quartile of daily values since 1985 (the 99th percentile of all rolling 30-day periods). This indicates a very high level of stress. |
| AAA Rated Bonds Spread over 10 Year Treasury Yield (month end). Higher spreads indicate rising concern about market liquidity. | 1.74% (78th percentile since 1983), vs 2.03% at the end of the previous month. |
| BB Rated Bonds Spread over 10 Year Treasury Yield (month end). High spreads indicate increasing credit risk. | 5.39%, (87th percentile) down from 6.41% (94th) last month. |
| Gold Price per Ounce in US Dollars (month end). Rising gold prices are an indicator of increasing market uncertainty and stress. | $1,717 vs $1,604, up 7% from the previous month. At the end of 2017, we estimated the “disaster premium” in the gold price was 47% (see our methodology in the Appendix). At the end of last month it was 79%. (see our methodology in the Appendix). |
New Qualitative Evidence
However, the most important new qualitative evidence this month is contained in our feature article, “The Complex Dynamics of Our New Cold War: A Brief Net Assessment.” Our assessment leads to the conclusion that it is very likely that external confrontations between the United States and China will continue to intensify across multiple areas, with the possibility of non-linear escalation ever present. We believe that most investors do not yet fully appreciate the dynamics that are at work, and how they will almost certainly lead to multiple uncertainty shocks in the future.
Pre-Mortem Analysis
One of the most important forecasting disciplines is to ask yourself why your forecast could be wrong. Dr. Gary Klein’s research has shown that a very powerful and insightful way to do this is via a “pre-mortem analysis.” This method asks you to assume that it is a point in the future, and your forecast has been proven wrong (or your strategy or company has failed). You are then asked to look backward from this imagined point in the future, to explain why you failed, what you missed, and what you could have done differently to avoid your fate.
The pre-mortem method takes advantage of the fact that humans reason much more concretely and in more detail when explaining the past than they do when trying to forecast the future.
So let us assume that it is one year from now, and our current forecast has turned out to be wrong.
How did this happen? What developments did we fail to anticipate?
- A number of world leaders – Xi Jinping and Donald Trump, and to a lesser extent Vladimir Putin and Ali Khamenei are all facing sharply weakened economies and declining political popularity. History teaches us that this can lead to increased “foreign adventurism” to distract the public from worsening domestic conditions, as a nation rallies around its leader in a period of heightened external conflict. Should a “kinetic” conflict develop between China and the United States, or Iran and Israel, Saudi Arabia, and/ or the US, or between Russia and one or more European countries (e.g., due to a Russian incursion into the Baltics), it would generate a very sharp increase in uncertainty that would likely accelerate the already sharp COVID-19 economic slowdown. Given given high debt levels, this would very likely accelerate the arrival of the Persistent Deflation Regime.
- A supply side shock of some type – beyond the disruption of global supply chains caused by COVID-19 -- could produce a sudden increase in inflation – the most likely scenario being a reduction in oil supplies due to a prolonged kinetic conflict between Iran and the US. A less likely cause could be major crop failures.
- Another route to the high inflation regime (repeatedly noted by Bridgewater’s Ray Dalio) would be a sudden loss of confidence in the US dollar relative to other currencies (driving up import prices), perhaps because of deficit monetization and policy paralysis if a severe downturn continues without meaningful policy reform to increase productivity and growth and reduce inequality. However, this would also require that there was relatively more confidence in another currency, with the Euro being the most likely candidate. This currently seems unlikely, given both the Eurozone’s economic and political situation, and the prospect of an intensifying conflict between the West and China. However, if confidence collapsed in all major currencies, a sharp increase in inflation would lead to a dramatic rise in the price of gold.
Note: Combining Our Forecasts with Others From Other Sources and Extremizing the Result Should Increase Your Predictive Accuracy
Research has found that three steps can improve forecast accuracy. The first is seeking forecasts based on different forecasting methodologies, or prepared by forecasters with significantly different backgrounds (as a proxy for different mental models and information). The second is combining those forecasts (using a simple average if few are included, or the median if many are). The final step, which significantly improved the performance of the Good Judgment Project team in the IARPA forecasting tournament, is to “extremize” the average (mean) or median forecast by moving it closer to 0% or 100%.
Forecasts for binary events (e.g., the probability an event will or will not happen within a given time frame) are most useful to decision makers when they are closer to 0% or 100% than the uninformative “coin toss” 50%. As described by Baron et al in “Two Reasons to Make Aggregated Probability Forecasts More Extreme”, forecasters will often shrink their probability estimates towards 50% to take into account their subjective belief about the extent of potentially useful information that they are missing.
When you average multiple forecasters’ estimates, you are including more information, which should increase forecast confidence and push the mean estimate closer to 0% or 100%. However, this doesn’t happen when you use simple averaging. For this reason, forecast accuracy is increased when you employ a structured “extremizing” technique to move the mean estimate closer to 0% or 100%.
You can download an extremizing model from our website to use when combining the forecasts you use in your decision process.
The extremizing factors in our model are those that the Good Judgment Project found maximized the accuracy of combined forecasts. Note that the extremizing factor is lower when average forecaster expertise is higher. This is based on the assumption that a group of expert forecasters will incorporate more of the full amount of potentially useful information than will novice forecasters.
Feature Article: The Complex Dynamics of Our New Cold War: A Brief Net Assessment
“A regime beset by economic stagnation and rising social unrest at home and great-power competition abroad is inherently brittle.”
-- Mixin Pei
Rising Sino-American tensions after Xi Jinping became China’s president in March 2013 sharply accelerated following Donald Trump’s election in November 2016. They have now reached the point that many observers believe we have begun a Second Cold War.
This conflict, however, will almost certainly be very different from the First Cold War, between the United States and the Soviet Union, due to China’s greater size and integration into the global economy.
Yet in one critical sense it will be the same: In both cases, the competitive dynamics extend far beyond the military realm, and encompass the interaction of two complex adaptive systems.
The outcome of the Second Cold War will be driven both by how each of these systems internally evolves over time (i.e., vertical interactions), and how they interact with each other at many levels (i.e., horizontal interactions).
This analysis will take a brief look at the nature of these interactions, and the critical trends and uncertainties that will drive important outcomes over the next three to five years (in the case of complex adaptive systems, Philip Tetlock’s research has shown that the forecast accuracy beyond this time horizon is unlikely to be better than a coin flip).
Starting Point: Essential Strategic Questions
While the word “strategy” is frequently used, it has no common meaning. For the purposes of this analysis, we’ll use this definition:
“Strategy is a causal theory of future success that exploits one or more decisive asymmetries to achieve an organization's most important goals, with limited resources in the face of uncertainty.”
Inherent in this definition is the critical question of what an organization (or nation’s) most important goals are or should be.
Xi Jinping has effectively said that his most important goals are keeping the CCP in power by rejuvenating China’s economy, military, and foreign policy.
In the United States, and the west more broadly, developing a similar “grand strategy” is far more difficult. In democracies, this seems to be a feature, not a bug. The typical result is a mix of at best loosely integrated goals across a wide range of policy areas and different levels of government (e.g., national security strategy, national military strategy, foreign policy, trade policy, fiscal policy, monetary policy, etc.).
Yet this does not reduce the potential power of having a clear consensus on an integrated set of critical goals that a nation must achieve.
At the end of 2019, before the COVID19 pandemic exploded, the cost of elites’ failure to address the US economy’s deeper problems following the 2008 Great Financial Crisis had become painfully clear.
Debt/GDP was at near record levels, productivity growth was weak, labor share of GDP had decreased, inequality had worsened, polarization and populism (progressive and nationalist) had grown, and both government institutions and democratic capitalism itself were facing a crisis of legitimacy. Perhaps worst of all, as COVID19 subsequently demonstrated, America’s national capacity for effective collective action in the face of danger had been greatly diminished.
As such, we could define the United States’ critical goal as renewing the popular legitimacy of democratic capitalism by rejuvenating its economy, military, society, and politics.
We next turn to key areas in which China and the United States (and the West more broadly) will compete, and whose internal interactions will also affect the achievement of their respective critical goals.
In our model, there is a rough chronological ordering of these areas (albeit with many feedback loops), in a complex process where developments in technology, energy, and the environment generate economic and national security effects, which in turn generate subsequent social and political effects.
Technology
Announced in 2015, “Made in China 2025” is a long-term plan to dominate a number of critical technologies. These include advanced information technology (e.g., artificial intelligence, quantum computing), robotics, green energy and vehicles, advanced materials, and aerospace equipment.
Historically, China taken an aggressively mercantilist approach to developing its technology base. In “The Trojan Dragon”, Rob Atkinson succinctly described it as follows:
“Step 1: Identify the target industry and unfairly acquire foreign technology capability through coerced transfer, commercial espionage, and cyber theft.
“Step 2: Ensure that domestic champions, now equipped with foreign technology, receive massive government subsidies so they can operate for years, if not decades, without profits, all the while undercutting foreign competitors’ prices.
“Step 3: Limit foreign access to the Chinese market so Chinese firms have time and breathing room to gain economies of scale.
“Only then, implement. Step 4: Attack foreign markets, backed by a secure and now profitable market at home, coupled with massive export subsidies.”
As Atkinson notes, “China has a turned to this winning playbook over and over again, and racked up win after win at America’s expense.”
To be sure, some analysts have claimed that it is unlikely that Made in China 2025’s goals will be achieved, for example because of widespread academic fraud, relatively less emphasis on fundamental research than in the west, weak incentives for innovators in a country with weak intellectual property and contract laws, and the difficulty of developing tacit know how (as opposed to simply copying explicit knowledge). Studies of patents have, to some extent, supported these criticisms. While numerous, relatively few Chinese patents are the most difficult to obtain “triadic patents” that have been approved in Europe, Japan, and the United States.
However, there are also many analysts who are far less sanguine about the rate of China’s progress in advanced technologies.
As Atkinson warned in 2019, “while mastery of some particularly complex technologies such as semiconductor logic circuits remains a challenge for China, Chinese companies have made significant progress in an array of other technologies, including in some kinds of semiconductors (e.g., chips for devices connected to the Internet of Things). Moreover, the fact that nations such as Japan in the 1960s and 1970s, and Taiwan and South Korea in the 1980s and 1990s could rapidly progress to become advanced technology economies, using similar kinds of approaches (obtaining foreign technology and subsidizing and protecting domestic innovators until they are strong enough to compete on their own) suggests there is nothing inherently keeping China from making similar progress, especially given the massive amount of government support for the effort…
“Given China’s Made in 2025 plan, coupled with unfair mercantilist policies, it is no exaggeration to suggest that, without aggressive action, leading economies such as Europe, Japan, Korea, and the United States will, within two decades, likely face a world wherein their advanced industry firms face much stiffer competition and have fewer jobs in industries as diverse as semiconductors, computers, biopharmaceuticals, aerospace, Internet, digital media, and automobiles (“Is China Catching Up to the United States in Innovation?” (See also, “The China Effect on Global Innovation” by the McKinsey Global Institute).
In response to Atkinson’s warning, as of this writing it seems clear that, both before and especially after COVID19, the aggressive actions by the West against China’s technology practices he called for will almost certainly be taken. What is uncertain, however, is the extent to which they will prevent China from achieving its technology goals.
In the United States, critics have claimed that the country’s innovation ecosystem is in decline. For example, in November 2019, in “Why the U.S. Innovation Ecosystem Is Slowing Down?” Arora et al observe that, “Productivity growth in the United States, which is powered by innovation, has been decelerating. Total factor productivity grew substantially in the middle of the 20th century, but started slowing in 1970. This slow growth continues today, with productivity lower than it was more than 100 years ago.
“This slowdown has occurred despite increased investment in scientific research. Data from the National Science Foundation (NSF) indicate that U.S. investment in science has steadily increased between 1970 and 2010, as measured by dollars spent (which has gone up 5X), number of PhDs trained (2X) and articles published (7X). Why is there little productivity growth to show for this?
“One explanation is that today’s science is simply not as groundbreaking as before. Some dispute this, however, pointing to advances in quantum physics (quantum computing), plasma physics (thermionic conversion), and molecular biology (CRISPR Cas-9). Another explanation, which we explore, is that today’s science is not being translated into applications — in other words, something is keeping scientific discoveries from fueling productive innovation.
“Our research finds that [for a variety of reasons, including investor pressure for higher profits at large companies] the U.S. innovation ecosystem has splintered since the 1970s, with corporate and academic science pulling apart and making application of basic scientific discoveries more difficult. Our analysis also shows that Venture Capital (VC)-backed scientific entrepreneurship has helped to bridge this gap between corporate science and academia — but only in a couple of sectors [life science and information and communication technologies].
The authors conclude that a key obstacle is the difficulty of obtaining private venture financing for an innovation that faces both technical and commercial (market) uncertainties. These were the type of innovations where large companies once excelled.
“These findings suggest that if we want to see greater productivity growth, we need to explore alternative ways to translate science into invention” (see also their longer academic paper, “The Changing Structure Of American Innovation: Cautionary Remarks For Economic Growth”).
Energy and the Environment
China is now the world’s largest consumer of energy, the largest producer and consumer of coal, and the largest emitter of carbon dioxide.
The health impacts of China’s high pollution levels are considerable. One study concluded that over 1 million premature deaths and substantial crop losses were due to exposure to airborne pollutants. Along with other costs (e.g., work absences, lower productivity, additional healthcare costs), the overall impact was estimated at 0.67% of China’s GDP each year (“Air pollution is killing 1 million people and costing Chinese economy 267 billion yuan a year, research from CUHK shows”, South China Morning Post, 2Oct18)
According to the BP Statistical Review of World Energy, coal accounted for 67% of China’s electricity generation in 2018, followed by 26% from renewables, and 4% from nuclear.
The new coal fired electric generating capacity China currently has under construction is equal to the entire coal fired generating capacity of the European Union.
China now imports about 60% of its oil consumption, and 50% of its natural gas. Over 80% of its oil imports pass through the straits of Malacca. Some “Belt and Road” projects are intended to reduce the impact of a potential blockade of the straits, including a pipeline from the Myanmar coast to China, and a pipeline to China from the Gwadar port in Pakistan.
The United States has a far stronger position than China with respect to energy security. America’s power generation sector also emits far fewer pollutants than China’s per gigawatt hour of electricity production, due to a very different generation mix: Natural Gas, 38%; Coal, 23%; Nuclear, 20%; and Renewables, 18%.
The Economy
The structures of the Chinese and US economies are quite different, as seen below:
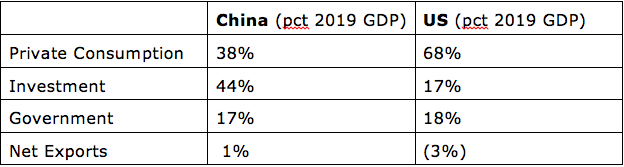
The Chinese economy faces many challenges. According to the Institute for International Finance, China’s overall debt/GDP ratio stood at 309% at the end of 3Q 2019. Over half of this debt is owed by the non-financial corporate sector, much of it to shadow banking organizations. Not included in these figures is as much as $200 billion in loans that China is believed to have made to countries taking part in its “Belt and Road Initiative”, many of which they will not be able to service in the post COVID19 downturn.
Much of this domestic debt appears to have been invested in projects that in recent years have seen declining return on capital. Inefficiency is a particular problem in many of China’s State Owned Enterprises, which the World Bank estimates contribute between 23% and 28% of the country’s GDP.
According to the IMF, China’s rate of total factor productivity growth halved in the aftermath of the Great Financial Crisis to about 2.25% per year. Due to the one child policy, China’s population is now aging fast. The size of its labor force has been declining since 2011. Between then and 2019, it fell by 2.8%.
China is also heavily dependent on some critical imports, including advanced integrated circuit chips and iron ore.
Exports will also be under pressure in the future, due to weakened global demand, the continuing trade war with the United States, and the movement of global supply chains out of China.
Finally, China’s poorly funded pension and healthcare systems drive high rates of household saving, which create an obstacle to shifting from an investment and export focused economy to one that is more driven by private consumption spending.
On the other hand, China’s economy also has some important strengths.
One of them is that the Chinese public and private sectors are compelled by the state to work together as an integrated team. For example, China’s new intelligence law (enacted in 2017) “obliges individuals, organizations, and institutions to assist Public Security and State Security officials in carrying out a wide array of intelligence work” (“Beijing’s New National Intelligence Law: From Defense to Offense”, by Murray Tanner on Lawfareblog).
Decades of aggressive Chinese mercantilism, along with cost and investor return pressures on Western companies in an ever more financialized economy, have also given China a preeminent place in many industries global supply chains. Manufacturing value added now accounts for 29% of China’s GDP, compared to only 11% in the United States.
China has become so ingrained in global supply chains that it will take a long time to move key operations to other countries. During this period, the country will continue to have many sources of leverage over other nations, often exerting it through foreign corporations with operations in China (e.g., see, “The Long Hard Road to Decoupling from China”, by Andrew Michta).
For example, the loss of US manufacturing jobs after China joined the World Trade Organization in 2001 has been stunning.
“In the four decades between 1960 and 2000, US manufacturing employment was basically stable, averaging around 17.5 million jobs… Between 2000 and 2010, manufacturing employment plummeted by a third. Nearly 6 million American factory workers lost their jobs. The drop was unprecedented—worse than any decade in US manufacturing history. Even during the Great Depression, factory jobs shrunk by only 31%...Though the sector recovered slightly since then, America’s manufacturing workforce is still more than 26% smaller than it was in 2000” (“The epic mistake about manufacturing that’s cost Americans millions of jobs”, by Gwynn Guilford, in Quartz, 3May18).
What has gone with those jobs is a great deal of tacit knowledge in the minds of manufacturing workers. Their loss will make the reshoring of manufacturing from China much more difficult, unless the lost tacit knowledge can be replicated by advanced manufacturing automation (see, “Bringing Manufacturing Back to the U.S. Is Easier Said Than Done”, by Willy Shih).
The United States economy has some undeniable strengths, including a very large domestic market, a rich endowment of natural resources, a strong legal system, deep financial markets, and, at the top, an unmatched (though still scarce) supply of world class talent in many fields.
Yet in recent years, its growing weaknesses have become more painfully apparent.
Healthcare costs now absorb about 18% of GDP. Education costs absorb another 7%. In both cases, US costs are above those of other OECD nations, while results are inferior. Due to the poor quality of the education they receive, an increasing percentage of America’s labor force is unprepared for anything but low skill/low wage jobs. Poor education has also been linked to America’s productivity slowdown (e.g., “US Total Factor Productivity Slowdown: Evidence from the US States” by the IMF).
The quality of America’s infrastructure has fallen behind many other countries.
As the economy has become more highly “financialized” (see, “Have We Been Here Before? Phases of Financialization within the 20th Century in the United States” by Fasianos et al), investment has fallen, while stock buybacks has risen. Total debt now amounts to over 300% of GDP (and that was before the COVID19 shock).
Due to the complex interaction of multiple causes, productivity growth has been anemic. These include network effects and winner take all economics in a growing number of increasingly globalized and digitized industries, and a poorly performing education (and broader human capital development) system that has created a growing scarcity of the talent needed to deploy rapidly improving technologies.
In many industries, these factors have also led to declining competition and increased concentration of talent, market share, and economic profits (e.g., see, “What Happened to US Business Dynamism?” by Akcigit and Ates).
Growing corporate power (and the weakening of workers’ power) has meant that labor’s share of GDP has declined, real median household income has stagnated, and inequality has increased (e.g., see, “Declining Worker Power And American Economic Performance” by Stansbury and Summers).
Finally, increasing inequality has contributed to weakening aggregate demand and, as top earners consume relatively less of their income.
The net result of all these factors is an economy that, even before COVID19, was facing worsening secular stagnation.
National Security
Consistent with its history, China’s top national security priority is maintaining control over its domestic population. It spends more on internal security than it does on external defense, including extensive investments in totalitarian public surveillance and social control (e.g., the Great Firewall, the social credit system, and reinserting the Communist Party into many more areas of Chinese life).
Externally, China’s priorities are (in decreasing order) defending its borders (its most important dispute is with India), the eventual incorporation of Hong Kong and Taiwan, extending its control of the South China Sea (the “Nine Dash Line”), and securing the trade routes it depends on for critical imports and foreign market access.
With its “Belt and Road” initiative, it has attempted to use infrastructure and other development funding to extend its sphere of influence.
However formation of effective alliances has been problematic for China, because of its historical view of itself as the “Middle Kingdom” between heaven and a collection of tributary vassal states.
As it has grown more confident in its power, and as conflict with the west has intensified, examples of this innate tendency have become more obvious, including, for example, arresting and imprisoning two Canadians in retaliation for the arrest in Vancouver of the CFO of Huawei, and threatening retaliation against Australian and the European Union for criticizing Chinese delays in warning the world about the dangers of COVID19. In many cases, these examples of China’s “wolf diplomacy” have backfired.
That said, China retains important relationships (grounded in a shared opposition to the United States and the West more broadly) with Russian, Iran, and North Korea, which could all seek to exploit any kinetic conflict between US and Chinese forces (e.g., by attacking a Baltic nation or the Ukraine, attacking Saudi Arabia, or invading South Korea).
China has also invested heavily in military modernization, based on an asymmetric approach designed to offset the United States’ military strengths. This includes initiatives in the cyber and space domains, ballistic missile and hypersonic weapons system intended to deny American access to the Western Pacific (the “Anti-Access/Area Denial or A2AD strategy), airborne and undersea unmanned vehicles (and associated swarming tactics), artificial intelligence, and directed energy weapons (for more on this, see, “China’s Advanced Weapons Systems” by Jane’s).
As a result of China’s aggressive military modernization programs, some analysts have questioned whether the United States would prevail in a conflict with China in the Western Pacific (e.g., should China invade Taiwan). See, for example, “The Kill Chain: Defending America in the Future of High-Tech Warfare”, by Christian Brose; “Beating the Americans at Their Own Game”, by Work and Grant; “Why America Needs a New Way of War”, by Christopher Dougherty; and “America is Well Within Range of a Big Surprise, so Why Can’t It See?” by T.X. Hammes.
Since 2003, China has also focused on developing and employing influence operations through what it calls “Three Warfares.” These include the use of public opinion, psychology, and legal systems to create and employ power to the benefit of China by winning “the battle of the narratives”. An excellent example of these in practice has been China’s attempt to subvert adversary countries’ population and political systems, and to gain decisive influence in international organizations (like the WHO and various standards setting bodies) of which it is a member.
Finally, China also benefits from a relatively small nuclear force, made up of land and sea-based weapons or questionable reliability and accuracy, and a deliberately ambiguous policy about how this force would be employed in the case of an extended conflict with the United States. The prospect of a heavy counter-city strike should the US breach the nuclear threshold undoubtedly has a deterrent effect. On the other hand, it could also tempt the United States to launch a massive counterforce strike should a conflict reach the point where nuclear weapons are employed. Ambiguity cuts both ways.
China also has military weaknesses. It’s force projection capabilities rapidly decline with distance (e.g., see “China’s Logistic Capabilities for Expeditionary Operations”, by Jane’s). While it has been improving its technology and increasing the number of its platforms (e.g., ships, planes), it lacks the 20 years of almost continuous combat experience accumulated by the US military. Perhaps most important is the uncertain impact of China’s one child policy on popular support for the actual use of China’s military forces. On balance, this seems to increase the probability that should a conflict occur with the United States, China will very likely prefer to strike in the cyber and space domains, to minimize casualties.
Even then, it is not at all clear how a “China invades Taiwan” scenario would turn out, or the consequences that would result if China successfully conquered the island. How would citizens of the United States and other western nations react to largescale American casualties, due to kinetic, space, or cyber attacks? Would Japan join the nuclear club and embark upon a rapid increase in its military capabilities? Would India more closely ally with the United States? Would Russia, faced with long-term economic decline (due to declining population and weak productivity) stand by China in the face of fortified Western opposition?
In the realm of National Security, the United States still has some very important strengths, including a range of platforms and systems across multiple domains whose full capabilities are not fully known by China (America also pursues asymmetric advantages); far more years than China of accumulated combat experience; and the strong desire on the part of many nations to avoid becoming vassal states of the Middle Kingdom.
Above all, the essence of the United States is set of ideals, grounded in freedom, liberty, and self-government, that still powerfully appeal to people around the world. Look no further than Pew surveys of the that ask people to name the top three countries to which they would most like to emigrate, or the currency to which they turn when uncertainty spikes.
That said, in the area of National Security, the United States also has a growing number of weaknesses, many of which have been self-inflicted.
While it continues to have a far more impressive network of alliances than China (including Japan, India, and Australia in the Western Pacific), the Trump administration has squandered a great deal of the United States’ historic “relationship capital.”
This is not to say that some of the administration’s complaints were unfounded – for example, one can argue that in light of the growing threat posed by Russia, European nations’ cuts to defense spending have been far too deep. But the manner in which these concerns have been put forth has largely been disastrous. Current allies have a very legitimate worry about whether the change in many Americans’ attitude towards the traditional liberal international will survive after the Trump presidency.
Militarily, the United States faces the dual challenges of shifting to a strategy of confronting China as a “near peer” competitor at the same time that COVID19 will almost certainly force cuts in the defense budget (e.g., see, “America's Security Deficit: Addressing the Imbalance Between Strategy and Resources in a Turbulent World”, by Ochmanek et al from RAND).
As Hal Brands observes in “One War Is Not Enough: Strategy and Force Planning for Great Power Competition”, “a quiet revolution in American defense strategy is currently underway. The U.S. military is no longer focusing on combating rogue states, terrorist groups, and other deadly, albeit relatively weak, enemies. Instead, the Defense Department is setting its sights on China and Russia: great power rivals that are contesting American military advantages and threatening to reorder the world. “The central challenge to U.S. prosperity and security is the reemergence of long-term, strategic competition by … revisionist powers,” the 2018 National Defense Strategy states. Deterring these rivals, and defeating them should deterrence fail, will require far-reaching changes in what the American military buys and how it fights.
“The main pillar of this strategy is a new approach to force planning, which outlines how the U.S. military should be built to fight. For more than a generation, the United States maintained a two-war standard to ensure that it could defeat a pair of regional adversaries simultaneously or in quick succession. Now, the Defense Department has adopted a one-war standard geared toward defeating a great-power rival. In other words, rather than planning to win multiple medium-sized wars, the Defense Department is preparing to win a single major war against a formidable competitor, one that can match (at least in some areas) American military might.
“This shift represents the most significant departure in American defense strategy since the end of the Cold War, and it has tremendous ramifications for a country that still has security commitments — and security challenges — around the globe.
“The one-war standard reflects serious strategic thinking and is rooted in real budgetary constraints. It is a recognition that defeating a great-power adversary would be far more difficult than anything the U.S. military has done in decades, and that losing a great-power war would be devastating to America’s global interests. It is meant to galvanize a sluggish bureaucracy to undertake the radical changes necessary to prevent this grim scenario from coming to pass. Yet, it is far more dangerous than its advocates publicly acknowledge.
“The most obvious risk of a one-war standard is that America might need to fight more than one war at a time. In fact, a one-war standard could increase this risk by tempting an opportunistic adversary to use force in one theater while Washington is occupied in another. Proponents of the one-war approach offer a number of options for avoiding a second war, if possible, or fighting it, if necessary, but these options are not promising: They would leave the United States strategically exposed, militarily overextended, or much more reliant on highly escalatory options that lack credibility. And as America loses the ability to handle challenges in more than one theater, it will also lose leverage in peacetime competitions and diplomatic crises. In short, the one-war standard exposes a serious mismatch between America’s global commitments and the military challenges it can realistically meet.”
Another military weakness in the United States is its slow moving, politicized, and expensive military procurement process, which the late Senator John McCain disparagingly referred to as the “military-industrial-congressional complex”.
To be sure, there are examples (like DARPA) of Defense Department procurement processes that are fast and relatively efficient. But they are the exceptions. For too long, many procurement projects have been characterized by cost overruns, schedule delays, and the final delivery of buggy systems. In an era of constrained budgets and a near peer competitor, these shortcomings are more dangerous than ever before.
Society
When it comes to social challenges in China, most people initially think of its rapidly ageing society, and the stereotypical picture of two parents supporting one child and four grandparents. But China’s social challenges go far beyond that.
For example, a July 2019 article in the South China Morning Post noted that, “one issue of constant risk to Chinese society comes from the developmental and emotional damage inflicted on a generation of children who remain in rural areas while their parents have left for the large number of jobs that rapid urbanisation has created for migrant workers.
“The poor quality of infrastructure and absence of parental support have led to these children suffering from a host of psychological problems relating to education, social relationships and even juvenile delinquency. It is estimated that there are about 70 million children living away from at least one parent in China” (“Are China’s social ills from four decades of rapid economic growth approaching a tipping point?” by Yeung and Chen).
A 2016 Pew Research poll found that 83% of Chinese respondents in their Global Attitudes Survey considered corrupt officials to be a very big (49%)or moderately big (34%)problem. 77% considered the gap between rich and poor to be a very (37%) or moderately (40%) big problem. 74% considered the safety of medicine to be a very big (42%) or moderately big (32%) problem. The figures for food safety were the same, and concerns over water and air pollution were similar. 69% considered health care to be a very big (33%) or moderately (36%) problem. More than half of respondents thought that problems related to the gap between rich and poor, food safety, and pollution would get worse or stay the same over the next five years.
However, the most dangerous social problem of all may be the growing frustration of China’s middle class.
In 2018, nearly 60 percent of China’s population lived in urban areas. The government claims that 29% of the country’s population meets its broad definition of being “middle class”. Using a narrower (but arguably more realistic) definition, others estimate that the middle class constitutes between 8% and 10% of the population. What everyone agrees on is that the size of the middle class has rapidly grown in the past two decades.
A recent article noted that, “Conventional wisdom assumes that a large and prosperous middle class is emerging in China – hundreds of millions of urban white-collar professionals and private business owners deeply integrated into the Chinese economy, whose spending will drive the country’s development in the years ahead.
But that view is looking increasingly suspect, as the middle class comes under pressure from high costs, rising debt and weak income growth. Heavy air pollution, food safety and vaccine scandals, a rigid education system and an increasingly authoritarian political environment are also big factors prompting those who can afford it to look abroad. And the trade war with the United States threatens to make these problems worse” (“The question mark hanging over China’s 400 million-strong middle class”, by Zhou Xin, South China Morning Post, 12Oct18).
Other analyses have found that the middle class Chinese spending is dominated by education, healthcare, eldercare, debt service, and housing costs. Dangerously, a very large proportion of middle class savings have been invested in China’s property market, which some analysts have claimed is at an extreme bubble stage. Thus far, government infusions of liquidity into financial markets have kept this bubble from bursting (see, “How big is China’s real estate bubble and why hasn’t it burst yet?”, by Zhao et al).
However, the combination of a trade war with the United States and the global economic crash triggered by COVID19 may change that. Given the very high degree of debt that is propped up by inflated property values, a crash could happen swiftly and have very painful consequences that extend beyond the middle class. As JC Davies noted in “Towards a Theory of Revolution”, “revolutions are most likely to occur when a prolonged period of objective economic and social development is followed by a short period of sharp reversal. People the subjectively fear that the ground gained with great effort will be lost; their mood becomes revolutionary.”
The United States also faces an array of serious social problems, including the rapidly rising cost of education and health care (whose quality remains below many other countries), even as median incomes stagnate and inequality worsens, more precarious employment security in the gig economy, increasingly bitter divisions over immigration, and the breakdown of traditional family and social ties in many communities (see the Social Capital Project of the Joint Economic Committee of the US Congress).
These growing social ills have led to increasing levels of substance abuse and “deaths of despair”, even as a rising percentage of federal, state, and local budgets is spent on social safety net programs.
A further weakness is the growing geographic division of the country in recent years into increasingly distinct cultural groups that have less and less in common with each other (e.g., see Charles Murray’s “Do You Live in a Bubble?” quiz).
Politics
As Xi Jinping faces a growing external conflict with the United States and other nations, the internal economic and social consequences of slowing growth, rising debt, and COVID19, the Chinese political system is under increasing pressure.
Jacqueline Deal writes that, “party elites increasingly worry about how they will sustain employment now that supply chains have been disrupted and the world is in recession, contracting demand. They express concern about how the PRC will secure access to the raw materials it requires, from food to energy, as the pandemic compels tightening of borders globally.
“Compounding these vulnerabilities, CCP experts acknowledge, albeit obliquely, the limits of their administration at home. They have failed to spur indigenous innovation, and their delayed response to the outbreak exposes their inability to react nimbly to an emergency. Yet this is a feature, not a bug, of a regime determined to exert centralized authority over the whole mainland. Xi is thus left to intensify domestic population control efforts while lashing out abroad. Contrarians carefully point out that these moves are likely to exacerbate the above problems. Their input is not welcome, and pressure continues to build up within the system” (“A Chastened China Girds for Conflict”).
Minxin Pei has noted that COVID19 allowed a brief look at these building pressures. “We always assume that the Communist Party maintains tight control over the media, public opinion, and expression of dissent. But there was one moment in early February, immediately after the death of Dr. Li Wenliang, when it appeared the Party very briefly lost control.
“You saw media, social media, and even official news clearly deviating from the Party’s guidelines. They gave front page coverage to the death of Dr. Li Wenliang, and well-known business tycoons said very critical things about how the Party handled the crisis. And then all of a sudden, you saw an explosion of civic activities, because the local bureaucracy turned out to be so incompetent that they could not deliver critical medical supplies. Local civic organizations and ordinary citizens had to step in. The moment that system opened up just a little bit, it showed that there’s this enormous energy hidden inside that could come out” (“Is Xi Jinping Weaker than We Think?” by Pei and Schmitt).
Faces with growing internal pressures, authoritarian leaders often become more aggressive externally to keep their nation united. Xi Jinping appears to be following this path, as demonstrated by multiple actions, including aggressive threatening “wolf diplomacy” towards what China perceives as weaker nations, construction of military facilities on man made islands in the South China Sea, and aggressive actions in Hong Kong and towards Taiwan, and to a lesser extent, Japan.
Going forward, Pei forecasts that, “the scenario that would entail the greatest likelihood of radical change is a succession struggle that would occur if Xi were to pass away or resign owing to infirmity. Typically, the fight for power that follows the end of strongman rule produces a weak interim leader: consider Soviet Premier Georgy Malenkov, who followed Stalin, or CCP Chair Hua Guofeng, who followed Mao.
“Such leaders are often pushed out by a stronger contender with a transformative vision: think Nikita Khrushchev in the Soviet Union and Deng Xiaoping in China. Given this new leader’s need to assert his authority and offer a different, more appealing agenda, it is unlikely that Xi’s hard authoritarianism would survive the end of his rule.
"That would leave the new leader with only two options. He could return to the survival strategy that the party had before Xi by restoring collective leadership and a risk-averse foreign policy. But he might find this to be a hard sell, as the party and all its previous survival strategies might have been discredited by this point. So he might instead opt for more radical reforms to save the party. Although stopping short of liberal democracy, he would, in this case, roll back repression, relax social control, and accelerate economic reform, just as the Soviet Union did between 1985 and its collapse in 1991.
“Such a course of action might be more attractive to a party elite traumatized by two decades of strongman rule; it might also resonate with Chinese youth yearning for a new direction” (“China’s Coming Upheaval” by Minxin Pei; see also, “What China Wants” by H.R. McMaster, and “What Kind of Regime Does China Have?” by Frank Fukuyama).
The weaknesses that had been accumulating for years in the US political system exploded into public view with the election of Donald Trump in November 2016.
Public sector decision making and in some cases even policy implementation are too often frustrated by federal/state conflicts, the actions of special interest groups (what Francis Fukuyama has termed America’s “vetocracy”), and/or the country’s polarized and increasingly antagonistic political factions.
Following Donald Trump’s election, all of these have grown worse. And, just as Xi Jinping has turned to nationalism and external conflict to partially deflect public attention from deteriorating domestic conditions, so too has Donald Trump.
Conclusion
As you can see, the conflict between China and the United States is far more complex than the First Cold War between the Soviet Union and the West.
In the area of technology, China’s momentum will very likely be slowed by US and allied nations’ actions. However, the odds that the US innovation system will substantially improve seem at best even today, due to declining competition in many industries and the continued focus on short-term returns in a highly financialized economy.
In energy and the environment, the US has decided advantages, and China has critical weaknesses that provide the US with a potential source of leverage in a protracted conflict (e.g., blockading energy supplies).
In the short term, both nations face critical economic challenges. Over the medium term, however, the United States’ stronger legal environment and capitalist system almost certainly provides an significant advantage.
In the national security competition, China very likely has a short-term advantage in the Western Pacific, while the US retains its advantage elsewhere. In the medium term, the refusal by many nations to accept Chinese vassal state status provides the US with a critical advantage, provided that, under a future president, it returns to a leadership role in the international community.
The most dangerous short-term outcomes would be a Chinese invasion of Taiwan, and/or a kinetic incident between Chinese and American forces in the South China Sea that rapidly escalated. A US defeat would have a number of effects that might turn it into a pyrrhic victory for China.
It would almost certainly hasten the west’s economic decoupling, galvanize a previously divided US public, rapidly strengthen a global anti-China alliance, and accelerate improvements to America’s military capabilities.
Failure conquer Taiwan would almost certainly lead to a Xi Jinping’s loss of power, a leadership crisis in China, and a grave threat to the future of the Chinese Communist Party.
However, just because rational analysis suggests invading Taiwan does not make sense for China does not mean it will not happen if internal conditions rapidly deteriorate.
Both nations face growing pressures from social issues. In the United States, these have generated critical political consequences. In China, this outlet for public frustration has largely been repressed – but pressures have continued to accumulate, and will very likely do so at a faster rate if and when economic conditions worsen.
Politically, both countries’ systems are, as Minxin Pei says, increasingly brittle, and therefore at growing risk of rapid and disruptive change.
In sum, both China’s and America’s systems are under increasing internal stress. Today, neither is likely to achieve the overarching strategic goals noted at the beginning of this analysis.
In China’s case, the goals of rejuvenating China’s economy and foreign policy will face increasing opposition that will very likely prevent their realization. As a result, middle class frustration will very likely continue to increase. Whether the goal of rejuvenating China’s military will be achieved depends on how you measure it, and over what time frame.
If the metric is increasing China’s multidomain capabilities (air, land, sea, space, and cyber) to a level that makes the rest of the world uncertain about the outcome of a conflict with the United States in the Western Pacific, this goal will almost certainly be achieved. However, if the goal is leveraging this to compel Taiwan to rejoin China without the need for an invasion, it very likely will not. Moreover, even if China does successfully conquer Taiwan and defeat the United States forces in a kinetic conflict, the response that will almost certainly trigger makes it unlikely that any of China’s rejuvenation goals will be met in the medium term. This obviously has grave implications for the CCP’s long term hold on power.
In the case of the United States, worsening polarization (which COVID19 has surprisingly not slowed) will almost certainly block the reforms that are necessary to renew the popular legitimacy of democratic capitalism by rejuvenating the US economy, military, society, and politics. In the medium term, however, the increasing threat posed by China, perhaps reinforced by defeat in the Western Pacific and loss of Taiwan, may finally provide sufficient impetus for the deep and difficult reforms needed to achieve this strategic goal.
This internal assessment leads to the conclusion that it is very likely that external confrontations between the United States and China will continue to intensify across multiple areas, with the possibility of non-linear escalation ever present.
For at least the next five years, we will very likely live in dangerous times, which will inevitably unnerve people with no memory of the First Cold War. Yet history teaches us that this state of affairs is neither unusual nor permanent.
As we have observed in previous analyses, over the past two centuries the world system seems to have cycled through four regimes.
The most benign is the state when the system is relatively ordered and a relatively high degree of cooperation prevails. As complexity grows faster than elites’ ability to manage it, the system becomes more disordered and cooperation declines.
Once disorder passes a threshold, cooperation gives way to conflict.
This is clearly the most dangerous regime. As multiple analyses have found, both wars and conflict related casualties have power law distributions, in which extreme events are more likely that most people appreciate (see, “On the Frequency and Severity of Interstate Wars”, by Aaron Clauset; “Toward a Unified Understanding of Casualty Distributions in Human Conflict”, by Spagat, et al; “Pattern Analysis of World Conflicts over the Past 600 Years”, by Martelloni, et al; and “On the Statistical Properties and Tail Risk of Violent Conflicts”, by Cirillo and Taleb).
However, the outbreak of conflict forces a higher degree of order on a system. And once conflict is resolved, the system returns to its cooperative/ordered state.
Eventually, things will almost certainly get better. But first we have to successfully navigate the rough seas that lie ahead.
High Value Information Observed In April 2020
In our model of the complex global macro system, change drivers are arrayed across a roughly chronological process (albeit one with many feedback loops), in which technological and environmental changes precede changes in the economy and national security, which in turn lead to changes in society and politics, all of which produce the effects we observe in investor behavior and financial market valuations and returns.
In our methodology, we classify new information as significant and highly valuable if either it (1) is an “indicator”, which reduces our uncertainty about the value of a parameter in our mental model for making sense of the dynamic macro system, or (2) it is a “surprise” which increases our uncertainty about either the range of potential values for a parameter or the structure of our model. With respect to indicators, the higher our priori probability is for a regime, the more we look for indicators that it will not occur, and the lower our prior probability for a regime, the more we look for indicators that it will occur. Put differently, we tend to look for high value indicators that disconfirm our prior views.
| New Technology Information: Indicators and Surprises | Why Is This Information Valuable? |
| “Intelligent Automation: Getting Employees to Embrace the Bots”, by Heric et al from Bain & Company | COVID19 will very likely accelerate investment in automation. “Automation of business processes is rapidly scaling up, with fallout from the coronavirus likely accelerating adoption. Bain & Company’s survey of executives worldwide finds that companies report cost savings from automation of roughly 20% on average over the past two years. Other reported benefits include improved process quality and accuracy, reduced cycle times and improved compliance”… “But the path to benefits is bumpy. Some 44% of respondents said their automation projects have not delivered the expected savings. The major barriers all involve execution—notably, competing business priorities, insufficient resources or lack of skill”… “Fallout from the coronavirus outbreak may change this. As companies lose critical staff and the fragility of manual business processes is exposed, many companies will have no choice but to turn to automation to keep the business running. “Bain expects that by the end of the 2020s, automation of business processes may eliminate 20% to 25% of current jobs, hitting lower-skilled workers the hardest, and benefiting highly skilled workers and the owners of capital. In the US service sector, for instance, automation could spread through companies two to three times more rapidly than in previous transformations in agriculture, manufacturing and construction.” |
| “A non-cooperative meta-modeling game for automated third-party calibrating, validating, and falsifying constitutive laws with parallelized adversarial attacks”, by Wang et al | Building models that enable the identification of solutions that are robust to a wide range of possible scenarios that can be produced by highly complex systems is a critical challenge for making good decisions in the face of uncertainty. The extent to which AI methods can be used to meet this challenge is a critical issue. While technical, this paper shows that significant progress is being made in this area. “As constitutive models that predict material responses become increasingly sophisticated and complex, the demands and difficulties for accurately calibrating and validating those constitutive laws also increase… “Engineering applications, particularly those involve high risk and high-regret decision-makings, require models to maintain robustness and accuracy in unforeseen scenarios using as little amount of necessary calibration data as possible…a common challenge is to detect rare events where a catastrophic loss of the prediction accuracy may occur in otherwise highly accurate constitutive laws. The authors “introduce concepts from game theory and machine learning techniques to overcome many of these existing difficulties…Competing AI agents systematically generate experimental data to calibrate a given constitutive model and to explore its weakness, in order to improve experiment design and model robustness through competition…By capturing all possible design options of the laboratory experiments into a single decision tree, we recast the design of experiments as a game of combinatorial moves that can be resolved through deep reinforcement learning by the two competing players.” |
| “First return then explore”, by Ecoffet et al | This is an important development, that should enable reinforcement learning based models to more extensively explore their state space and avoid becoming trapped on “local optima”, or on a low peak when searching for the highest one on a fitness landscape. It is another example of how, out of range of the headline writers, AI technologies continue to improve in important ways. “Recent years have yielded impressive achievements in Reinforcement Learning (RL), including world-champion level performance in Go4, Starcraft II5, and Dota II6, as well as autonomous learning of robotic skills such as running, jumping, and grasping. Many of these successes were enabled by reward functions that are carefully designed to be highly informative. “However, for many practical problems, defining a good reward function is non-trivial… “A key observation is that sufficient exploration of the state space enables discovering sparse rewards as well as avoiding deceptive local optima. We argue that two major issues have hindered the ability of previous algorithms to explore: detachment, in which the algorithm loses track of interesting areas to explore from, and derailment, in which the exploratory mechanisms of the algorithm prevent it from returning to previously visited states, preventing exploration directly and/or forcing practitioners to make exploratory mechanisms so minimal that effective exploration does not occur. “We present Go-Explore, a family of algorithms designed to explicitly avoid detachment and derailment. We demonstrate how the Go-Explore paradigm allows the creation of algorithms that thoroughly explore environments.” |
| “AutoML-Zero: Evolving Machine Learning Algorithms From Scratch”, by Real et al from Google | This is yet another indicator of the improving ability of AI technologies to automatically search through complex state spaces to identify robust solutions to specified problems – in this case, the development of new algorithms. “In recent years, neural networks have reached remarkable performance on key tasks and seen a fast increase in their popularity. This success was only possible due to decades of machine learning (ML) research into many aspects of the field, ranging from learning strategies to new architectures. The length and difficulty of ML research prompted a new field, named AutoML that aims to automate such progress by spending machine compute time instead of human research time. “This endeavor has been fruitful but, so far, modern studies have only employed constrained search spaces heavily reliant on human design…To address this, we propose to automatically search for whole ML algorithms using little restriction on form and only simple mathematical operations as building blocks. We call this approach AutoML-Zero, following the spirit of previous work that aims to learn with minimal human participation. “In other words, AutoML-Zero aims to search a fine-grained space simultaneously for the model, optimization procedure, initialization, and so on, permit- ting much less human-design and even allowing the discovery of non-neural network algorithms… “It is possible today to automatically discover complete machine learning algorithms just using basic mathematical operations as building blocks. We demonstrate this by introducing a novel framework that significantly reduces human bias through a generic search space. Despite the vastness of this space, evolutionary search can still discover two-layer neural networks trained by backpropagation. These simple neural networks can then be surpassed by evolving directly on tasks of interest.” |
| “Flexible and Efficient Long Range Planning Through Curious Exploration”, by Curtis et al | Another indicator of AI progress: Curious exploration of state spaces to support more effective long range planning. “Many complex behaviors such as cleaning a kitchen, organizing a drawer, or cooking a meal require plans that are a combination of low-level geometric manipulation and high-level action sequencing. Boiling water requires sequencing high-level actions such as fetching a pot, pouring water into the pot, and turning on the stove. In turn, each of these high-level steps consists of many low-level task specific geometric action primitives. For instance, grabbing a pot requires intricate motor manipulation and physical considerations such as friction, force, etc. “The process of combining low-level geometric decisions and high-level action sequences is often referred to as multi-step planning. While high-level task planning and low-level geometric planning are difficult problems on their own, integrating them presents unique challenges that add further complexity… “Identifying algorithms that flexibly and efficiently discover temporally-extended multi-phase plans is an essential step for the advancement of robotics and model-based reinforcement learning. “The core problem of long-range planning is finding an efficient way to search through the tree of possible action sequences…we propose the Curious Sample Planner (CSP), which fuses elements of TAMP (Task and Motion Planning) and DRL (Deep Reinforcement Learning) by combining a curiosity-guided sampling strategy with imitation learning to accelerate planning. “We show that CSP can efficiently discover interesting and complex temporally-extended plans for solving a wide range of physically realistic 3D tasks. In contrast, standard planning and learning methods often fail to solve these tasks at all or do so only with a huge and highly variable number of training samples… “We [also] show that CSP supports task transfer so that the exploration policies learned during experience with one task can help improve efficiency on related tasks.” |
| Education systems around the world are struggling with the switch to remote learning necessitated by the arrival of #COVID19 and the closure of schools. Going forward, the pandemic will very likely reduce birth rates and immigration. Faced with slower labor force growth, renewed economic growth (which will be critical to repaying increased debt) will therefore heavily depend on increased productivity growth. And that must largely come through a combination of increased use of AI and automation and higher quality labor inputs. However the latter will not happen without very substantial improvements in education systems that in many places have long resisted change despite stagnant or declining results (there are exceptions, like Alberta and Massachusetts). | Even before COVID19 arrived, a recent report by the World Bank concluded that, “in most countries, education systems are not providing workers with the skills necessary to compete in today’s job markets. The growing mismatch between demand and supply of skills holds back economic growth and undermines opportunity” (“The Learning Challenge in the 21st Century”, by Harry Patrinos). It remains to be seen whether COVID19 will cause that to change. In some places, unions are in effect demanding a return to the status quo ante (e.g., “Online School Demands More of Teachers. Unions Are Pushing Back” by Goldstein and Shapiro). At the same time, some (but not all) parents and students have found even quickly cobbled together forms of remote learning preferable to traditional “seat time” based schools. This has created a large potential market for new approaches to schooling that could at last break through the institutional constraints that have thus far held back the substantial improvements in education system performance.” |
| It also seems clear that COVID19 will provide the long-needed impetus to improve many healthcare systems, whose shortcomings are now painfully apparent. These include poor management and lack of critical supplies; precarious finances as patient use of many services plummeted; and insufficient integration of acute, chronic, and social care systems that has resulted in very high death rates in the latter. | As in the case of education, necessary improvements in national healthcare systems will very likely be resisted by those with vested interests in the status quo. And yet they are equally critical, not only for improving effectiveness and efficiency of healthcare delivery in the resource constrained post-COVID19 age, but also to improve those systems’ resilience and ability to adapt to the next pandemic (e.g., H7N9 or H5N1 influenza). |
| “A performance comparison of eight commercially available automatic classifiers for facial affect recognition”, by Dupre et al | This is an interesting indicator not only of the current state of video surveillance technologies, but also of the extent of their potential effectiveness in social control applications by authoritarian governments. “The ability to accurately detect what other people are feeling is an important element of social interaction. Only if we can perceive the affective state of an individual, will we be able to communicate in a way that corresponds to that experience. In the quest for finding a ‘window to the soul’ that reveals a view onto another’s emotion, the significance of the face has been a focus of popular and scientific interest alike… “In the wake of rapid advances in automatic affect analysis, commercial automatic classifiers for facial affect recognition have attracted considerable attention in recent years. While several options now exist to analyze dynamic video data, less is known about the relative performance of these classifiers, in particular when facial expressions are spontaneous rather than posed. In the present work, we tested eight out-of-the-box automatic classifiers, and compared their emotion recognition performance to that of human observers. “A total of 937 videos were sampled from two large databases that conveyed the basic six emotions (happiness, sadness, anger, fear, surprise, and disgust) either in posed or spontaneous form. “Results revealed a recognition advantage for human observers over automatic classification. Among the eight classifiers, there was considerable variance in recognition accuracy ranging from 48% to 62%. Subsequent analyses per type of expression revealed that performance by the two best performing classifiers approximated those of human observers, suggesting high agreement for posed expressions. However, classification accuracy was consistently lower (although above chance level) for spontaneous affective behavior. The findings indicate potential shortcomings of existing out-of-the-box classifiers for measuring emotions, and highlight the need for more spontaneous facial databases that can act as a benchmark in the training and testing of automatic emotion recognition systems.” |
| | |
| | |
| | |
| | |
| | |
| New Energy and Environment Information: Indicators and Surprises | Why Is This Information Valuable? |
| The amount of new debt that governments will eventually be forced to repay (and at minimum service), along with the continuing desire to mitigate both rising carbon emissions and the impact of climate change, have made it very likely that in the future we will see carbon taxes imposed. | Carbon taxes are far simpler than emissions trading schemes, and arguably do more to promote innovation. However depending on the price/tonne of CO2 emissions (or its equivalent) at which they are set, the marginal cost they impose can have substantial impacts. Perhaps the best example of this is on the coal industry, with heavy emitters like cement and steel not far behind. However, controversy is sure to arise over the impact of proposed carbon taxes clash on industries that are heavy emitters (e.g., steel and chemicals) whose supply chains are being moved out of China and “reshored” back to the US at a time of rising conflict between those two nations. |
| “Scale-up of Solar and Wind Puts existing Coal, Gas at Risk”, Bloomberg New Energy Finance, 28Apr20 | “Solar PV and onshore wind are now the cheapest sources of new-build generation for at least two-thirds of the global population. Those two-thirds live in locations that comprise 71% of gross domestic product and 85% of energy generation. Battery storage is now the cheapest new-build technology for peaking purposes (up to two-hours of discharge duration) in gas importing regions, like Europe, China or Japan”… The latest analysis by research company BloombergNEF (BNEF) “shows that the global benchmark levelized cost of electricity, or LCOE, for onshore wind and utility-scale PV, has fallen 9% and 4% since the second half of 2019 – to $44 and $50/MWh, respectively.” Note, however, that others have claimed this type of estimate is too low, because it leaves out cost related to increased grid stability and control issues as greater amounts of variable generation (solar and wind) is added. “Meanwhile, the benchmark LCOE for battery storage has tumbled to $150/MWh for projects with a four hour duration, about half of what it was two years ago. Today, BNEF estimates that the average capacity of storage projects sits at about 30 megawatt-hours… [Note that in 2018 the average capacity of newly installed onshore wind turbines in the US was 2.43 megawatt-hours. So the average storage project only covers about 4 hours of output from about 12 wind turbines]. “Seb Henbest, chief economist at BNEF, said: “The coronavirus will have a range of impacts on the relative cost of fossil and renewable electricity. One important question is what happens to the costs of finance over the short and medium term. Another concerns commodity prices – coal and gas prices have weakened on world markets. If sustained, this could help shield fossil fuel generation for a while from the cost onslaught from renewables.” |
| “Crops at risk as coronavirus lockdown grounds bees”, Financial Times | SURPRISE “Lockdowns, quarantine requirements and border closures introduced in recent weeks around the world to slow the coronavirus pandemic are threatening to hit food production by limiting the movement of bees, agriculturalists have warned. “Farmers around the world growing fruits, vegetables and nuts rely on bees to pollinate their crops. In many cases bees are trucked through agricultural areas, rather than staying local to one area — but now they cannot travel. “A third of our food depends on the pollination by bees. The production of those crops could be affected,” said Norberto Garcia of Apimondia, the international federation of beekeepers.” |
| | |
| | |
| | |
| | |
| | |
| | |
| | |
| | |
| | |
| | |
| New Economic Information: Indicators and Surprises | Why Is This Information Valuable? |
| The dramatic fall in aggregate demand and aggregate supply caused by COVID19 has forced out of the headlines a critical point: Before the pandemic arrived, the global economy was already facing five strengthening (and interacting) headwinds, all of which were contributing to weakening aggregate demand and strengthening secular stagnation. | (1) An ageing population; (2) increasing corporate concentration and declining labor share of GDP; (3) increasing inequality in the division of that declining share; (4) low labor productivity growth; and (5) high levels of debt (including unfunded public pension liabilities). COVID19 has not made them disappear. However, in the short-term some are easier to attack than others. High taxes can reduce inequality and debt can be restructured (e.g., written off or converted to equity). Productivity and labor share of GDP have deeper root causes that will require more extensive structural reforms to reverse. |
| It is clear that the massive uncertainty shock that accompanied COVID19’s gale force arrival is not dissipating. | In “COVID-induced economic uncertainty and its consequences” Scott Baker, Nicholas Bloom, and Steven Davis, Stephen Terry “feed various measures of the COVID uncertainty shock into a model of disaster effects predicts a year-on-year contraction in US real GDP of nearly 11% as of 2020 Q4. |
| Most people forget how dependent the US economy is on consumption spending, and especially consumption of services, demand for which has been hard hit by COVID19 | In the fourth quarter of 2019 US GDP amounted to $21.7 billion in current dollars, at an annualized rate. Personal Consumption accounted for 68% of US GDP. Services alone accounted for 47%. Gross Domestic Fixed Investment accounted for a further 17% (Non Residential 13%, and Residential 3%). Net Exports accounted for a negative 3% (Exports 11% and Imports 14%). Government accounted for 18% of GDP. Federal spending accounted for 7% (Defense 4% and NonDefense 3%), and State and Local Government 11%. Even after quarantines are lifted, until a vaccine is developed and deployed people are likely to voluntarily avoid what Japan calls “the Three Cs”: Closed spaces with poor ventilation; Crowded Places; and Close contact settings. This will continue to put very strong downward demand pressure on many service businesses. |
| There is increasing evidence of the size of the supply shock caused by COVID19. | Leisure and Hospitality was particularly hard hit. In the US alone, more than 8 million employees lost their jobs between February and April. In “COVID019 is Also a Reallocation Shock”, Barrero et al estimate that across the US economy, 42 percent of recent layoffs will result in permanent job loss. |
| The United States has seen 2 straight months of declines in the Consumer Price Index as deflationary forces take hold. | In March, the US CPI declined by (0.4)%. In April, it declined by (0.8)%. Energy (8% weight in the index) was down (10.0)%. Food (16% weight) was up 1.5%. Shelter (31% weight) was flat, at 0%. Other goods less food and energy (20% weight) were down (0.7)% |
| In the face of a sharp decline in global demand, and large amounts of dollar denominated debt, a substantial increase in emerging market debt restructurings is certain. | In the 1980s Latin American debt crisis, these restructurings caused a “lost decade” of economic growth. Whether this will trigger increased migration flows from emerging to developed market countries remains to be seen. If it does, given high levels of unemployment in the target countries, and their continuing concerns about a second wave of COVID19, increased conflict at regional borders will almost certainly occur. |
| Sovereign debt problems in developed countries could also have underestimated negative effects | The biggest concern is Italy, which even before COVID19 had a weak economy and high government debt/GDP ratio. An Italian debt crisis could quickly trigger a European banking crisis, as many European banks have invested in sovereign bonds from Eurozone countries because they are deemed to be “risk free” assets with no associated capital requirement. |
| In the United States, COVID19’s effects on financial markets has substantially worsened the existing public pension fund crisis, and for the first time triggered calls for both a federal bailout and allowing states to declare bankruptcy. | US states must run balanced budgets. In the face of a sharp spike in their social safety net costs, contributions to defined benefit pension plans are being cut back, just as those plans have seen the value of their investments plunge. In a much lower growth economy, pension funds will very likely not be saved by much higher future returns on their investments. In Illinois, Senate President Don Harmon (D-Chicago) sent a letter to all members of the Illinois Congressional Delegation, seeking $41.6 billion in federal money for the state of Illinois, including $10 billion specifically for state pension funds (a drop in the bucket, really, compared to the state’s $158b in unfunded pension liabilities) Harmon also asked for another $9.6b for underfunded local pension funds. At the same time, US Senate Majority Leader Mitch McConnell suggested states should be able to declare that bankruptcy (currently, only lower levels of government can, under Chapter 9 of the US Bankruptcy Code), as an alternative to “blue state bailouts” of their pension plans. Many governors immediately rejected the idea. Even if bankruptcy were possible, it is an uncertain solution, as in some recent municipal bankruptcies judges have decided that (in an apparent contradiction to statutory law) pension fund members clams to current and future benefits were senior to the claims of holders of the municipality’s general obligation (“full faith and credit”) bonds. It remains very likely that the eventual resolution of the United States’ public pension problems will involve bitter political conflicts between public sector workers and private sector employers and taxpayers, along with a substantial increase in municipal bond market uncertainty. |
| The Financial Times’ Gillian Tett brought back memories of LDC debt crisis when she recently observed that too many investors seemed to be confusing liquidity problems with solvency problems. | SUPRRISE While the temporary injection of large amounts of liquidity into financial markets by central banks stemmed the immediate liquidity crisis triggered by COVID19, it did nothing to address the deeper and more dangerous solvency problem created by the collapse of demand in a highly leveraged economy. This has led observers in multiple countries to call for reforms to their respective bankruptcy processes to reduce the economic disruption from the wave of defaults that lie ahead. In “Bankruptcy and the Coronavirus” David Skeel, from the University of Pennsylvania, observes that, “the [US] bankruptcy system has three major limitations of great importance in the current environment: it has proven much more effective at reorganizing large corporations than small and medium sized businesses; it functions very differently when the bankruptcy courts are congested; and Chapter 11 [restructuring, versus a Chapter 7 liquidation] depends on the debtor having financing during the bankruptcy case. It is essential that the Federal Reserve and Treasury anticipate these limitations and consider creative solutions to the problems that are likely to arise.” In, “Unintended effects of loan guarantees during the Covid-19 crisis” Giorgio Gobbi, Francesco Palazzo, Anatoli Segura observe that, “most governments have introduced temporary credit guarantees to ensure banks can provide the liquidity needed by firms during the Covid-19 crisis.” They argue that, “ these policies create incentives for bank to foreclose guaranteed loans maturing close to the expiration date of the guarantee scheme. This hidden effect is worse for firms whose debt is set to substantially increase during the pandemic. To avoid foreclosure ‘waves’ on the eve of the public guarantee termination, complementary measures that reduce firms’ debt burden should also be adopted.” |
| The insurance industry has also been thrown into turmoil by COVID19, as a result of claims made under existing policies, and pandemic exclusions under new policies that may expose insureds (like companies and schools) to potential liabilities that are unacceptably high. This is a further underestimated source of potential supply shocks, if businesses (and perhaps schools) can’t obtain the insurance they need to reopen. | SURPRISE “Insurers braced for claims from Covid-19 legal action”, Financial Times “Insurers are bracing themselves for billions of dollars of claims because of legal action over the coronavirus pandemic. Industry experts say that shareholders and creditors in the US and other countries will soon start suing company managers over the way they have handled the crisis, and that insurance policies will bear much of the brunt. And this comes on top of already record setting claims: “Coronavirus to cost insurers more than $200bn” Financial Times. “Just over half of the $203bn estimated loss relates to claims, with insurers expecting to pay out for events cancellation, business interruption and trade credit cover. Another $96bn comes from investment losses, where turmoil in financial markets has hit the assets insurers hold to fund claims. ‘This is a loss of a magnitude that none of us have seen in our lifetime,’ said John Neal, Lloyd’s chief executive.” |
| “US business groups seek protection from coronavirus lawsuits”, Financial Times | SURPRISE The uncertain outlook for COVID19-related liability and litigation risk is a critical uncertain that could slow the recovery of the US economy. As the FT notes, “US business groups are calling on the federal government to shield companies from litigation if they expose employees to Covid-19 infection by calling them back to work before the pandemic abates. “Even as they do so, however, they face accusations that they are exaggerating the threat of being sued to weaken hard-fought employee protections.” “While the solution to this remains clear – a government backed high risk insurance pool, as in the case of terrorism and flood insurance – it will very likely take a long time to put in place, resulting in the permanent closure of more businesses and a slower return of economic activity.” |
| The changes in the price of the US dollar versus other currencies and gold since the equity market high on 19 February have been interesting. As the magnitude of the COVID19 crisis became clear, there was an initial strengthening of the USD against most other currencies. But by the end of April, exchange rates had largely returned to their 19Feb levels. There were two interesting exceptions. The Japanese Yen strengthened versus the USD and remained there at 30April. The Canadian Dollar weakened and did not snap back. Between 19Feb and 17Mar, gold lost (8.6%) versus the USD. But between then and 30Apr, it gained 16.6%. | In the past, the argument has been made that continued monetization of growing structural government deficits in the US would eventually trigger a flight from the USD, which would increase inflation via import prices. There were always three counterarguments: In Japan, twenty years of monetizing fiscal deficits has not produced inflation (in fact, the country has continued to struggle with deflation). And even if investors wanted to flee the USD, where would they go, given the limited breadth and depth of other financial markets (e.g., “Why Is the Euro Punching Below Its Weight?”, by Ilzetzki, Reinhart, and Rogoff). Finally, there is potential for resistance to currency appreciation in nations – e.g., Switzerland -- that depend on exports for a substantial part of their aggregate demand). However, there remained the argument that, if investors began to lose confidence in all fiat currencies, the price of gold would rise (as might the price of directly owned property in Europe, where it has historically been a hedge against extremely hard times). |
| “The Saving Glut of the Rich and the Rise of household Debt” by Mian et al | SURPRISE As noted above, the world economy was already facing intensifying headwinds before COVID19 arrived. Most of these problems have complex root causes and have thus far have proven impossible to solve at an acceptable economic, social, and political cost. This paper provides another example. “Rising income inequality since the 1980s in the United States has generated a substantial increase in saving by the top of the income distribution, which we call the saving glut of the rich. The saving glut of the rich has been as large as the global saving glut, and it has not been associated with an increase in investment. Instead, the saving glut of the rich has been linked to the substantial dissaving and large accumulation of debt by the non-rich. “Analysis using variation across states shows that the rise in top income shares can explain almost all of the accumulation of household debt held as a financial asset by the household sector. Since the Great Recession, the saving glut of the rich has been financing government deficits to a greater degree”. |
| “Secular Stagnation or Technological Lull?” by Valerie Ramey | SURPRISE “The slow recovery of the economy from the Great Recession and the lingering low real interest rates have led to fears of “secular stagnation” and calls for government aggregate demand stimulus to lift the growth rate of the economy.” Ramey aims to “present evidence that the current state of the U.S. economy does not satisfy the conditions for secular stagnation, as originally defined by Alvin Hansen (1939). Instead, the U.S. is experiencing a period of low productivity growth… Long intervals of sluggish productivity growth may be natural in an economy whose growth is driven by technological revolutions that are large, infrequent, and randomly-timed. “If this is the case, then the best description of the recent experience of the U.S. economy is a technological lull. In this situation, traditional government aggregate demand stimulus policies are not the appropriate response. Instead policies that can increase the rate of innovation and its diffusion may be more appropriate.” This is a hypothesis that needs to be seriously considered; every month we present technological indicators and surprises that show what appears to be accelerating progress in multiple automation and artificial intelligence technologies that have the potential to generate a substantial increase in productivity. However, the extent to which this increase also depends on a substantial improvement in education system performance remains debatable. More important, it seems unlikely that a sustained improvement in productivity, on its own, will be sufficient to offset the demand side factors that are contributing to secular stagnation. |
| “The Productivity J-Curve” by Brynjolfsson et al | SURPRISE This paper complements Ramey’s, discussed above. The authors argue that, “General purpose technologies (GPTs) such as AI enable and require significant complementary investments, including co-invention of new processes, products, business models and human capital. These complementary investments are often intangible and poorly measured in the national accounts, even when they create valuable assets for the firm.” I certainly agree, having lived through the 80s/90s ITC investment cycle, where the full benefits of new technologies were not realized for a surprisingly long time, due not only to the slow maturing of the technologies themselves, but even more so because of the slow pace at which companies reorganizes their processes, structures, and staff skills to take maximum advantage of the new technologies’ capabilities (a process you can still see underway today in the education and health care sectors). The authors claim that this delay “leads to an underestimation of productivity growth in the early years of a new GPT, and how later, when the benefits of intangible investments are harvested, productivity growth will be overestimated.” Their model “generates a Productivity J-Curve that can explain the productivity slowdowns often accompanying the advent of GPTs, as well as the increase in productivity later.” They also “assess how AI-related intangible capital may be currently affecting measured productivity and find the effects are small but growing.” Again, as we commented about Ramey’s paper, the authors argument makes sense. That said, however, productivity improvement alone is a necessary but insufficient solution to the forces driving the secular stagnation we faced before the arrival of COVID19. |
| With the sharp increase in government fiscal deficits triggered by COVID19, there have been a growing number of articles on whether this increase is sustainable. | SURPRISE One frequently sees references to this equation: “r But these arguments miss a critical point. In the case of the Latin American debt crisis, governments had lost access to international credit markets; as a result, they were forced into a prolonged period of fiscal austerity during which the amount of outstanding debt remained relatively constant, and sustaining “r But that is not the case today in many developed countries, where, even before COVID19 arrived, deficits and debt levels were projected to INCREASE because of a political decision to hold down tax rates while various pressures combined to substantially increase various forms of social spending (e.g., pensions, healthcare, etc.). So the long-term sustainability of the rapid and substantial increases in government debt that are taking place in reaction to the COVID19 shock remains very much uncertain. |
| | |
| | |
| | |
| New National Security Information: Indicators and Surprises | Why Is This Information Valuable? |
| In Russian, Vladimir Putin confronted both the failure of the oil price war he had triggered, and rapid growth of COVID19 cases, after he had bragged about Russia’s success in controlling the outbreak | SURPRISE Despite production cuts agreed by Open and other oil producing nations, storage is still quite full, and the extent of demand destruction (and its duration) remain highly uncertain. Hence downward pressure on prices continues. A sharp and prolonged decline in revenue from oil sales will put pressure on Russia’s budget, just as growth in COVID19 cases is putting downward pressure on other sources of aggregate demand in its economy, and increasing the need for much more government spending. The ability of Russia’s healthcare system to respond to COVID19 is also highly questionable, which could, in addition to a rapidly weakening economy, further raise public frustration with Putin’s performance. COVID19 infections have exponentially grown since April 18th, when Putin assured Russians that “the situation is under full control.” This is also almost certainly why the Kremlin has, uncharacteristically, delegated authority for responding to COVID19 to Russia’s cash strapped governors. Whether what many expect will very likely be a poor and economically damaging response will trigger a sharp rise in popular discontent and intensified competition between various factions of the security services and oligarchs to succeed Putin remains to be seen. At this point, it seems unlikely. But a rapid worsening of the crisis could quickly change that. |
| COVID19 has accentuated existing divisions in Europe. It has raised the probability of a “no deal” Brexit, after which the UK will trade with the EU on the basis of World Trade Organization terms. It has also widened the split between financially conservative northern nations who, because of the alleged fiscal profligacy of southern European countries, continue to resist “mutualization” of the debt that needs to be issued to fund the governments’ fiscal response to the pandemic. COVID19 has also weakened the reaction of western European nations to the weakening of democracy in eastern members of the European Union, including Hungary and Poland. | SURPRISE This development in particular has highlighted the continuing tension between the rights and powers of nation states and the rights and powers of the European Union in Brussels. “German Court Ruling Casts Doubt on European Monetary Policy”, the Financial Times, 5May20. “Germany’s constitutional court has threatened to block fresh purchases of German bonds through the European Central Bank’s flagship stimulus programme [launched in 2015], potentially weakening the bloc’s monetary policy response to the coronavirus crisis. “The court on Tuesday ordered the German government and parliament to ensure the ECB carried out a “proportionality assessment” of its vast purchases of government debt to ensure their “economic and fiscal policy effects” did not outweigh its policy objectives [i.e., was a proportionate response to financial problems, and did not constitute monetization on member states’ fiscal deficits], and threatened to block new bond-buying unless the ECB did so within three months [buy August]. “In recent weeks the central bank has vastly expanded its quantitative easing programme of bond-buying to mitigate the economic consequences of coronavirus. It has bought more than €2.2tn of public sector debt since launching quantitative easing in 2014 in an attempt to halt a slide in inflation. “The bond-buying programme has long been controversial in Germany, where critics argue the central bank has exceeded its mandate by illegally financing governments and exposing taxpayers to potential losses.” In a subsequent article, the FT’s Martin Sandbu noted that, “The court did not, ‘for now’, deem quantitative easing illegal. Instead it set off three grenades under the European legal order. “First, by dismissing the European Court of Justice’s legal reasoning as inadequate, it took upon itself the role of interpreting this area of EU law [this sets a dangerous precedent, as treaties state that only the ECJ can decide whether an EU body has broken EU law]. “Second, it posited an interpretation that turns EU Treaty provisions on their head, and flies in the face of the legal text and its political understanding — including in Germany. “Third, it gave German institutions three months’ notice: if by then the ECB has not complied with the court’s new doctrine, the Bundesbank and other German entities are banned from participating in the quantitative easing programme.” Respected German commentator Wofgang Munchau had a different take: “In the end, the German constitutional court has done us a favour. Its ruling last week highlighted the toxic idea that the eurozone can forever rely for its survival on its central bankers, and their enthusiasm in pushing EU laws to the limits. Or maybe beyond… “The ruling only allows the Germans to take part in the asset purchase programme for another three months unless they find a way to comply. Theoretically, the ECB could proceed without Germany. But I would strongly advise against it because that could precipitate a eurozone break-up… “The smartest response to this ruling would be for the EU to address the problems of the eurozone head on: lack of convergence between north and south, debt sustainability and, most important right now, the issuance of mutualised debt to finance a recovery fund. “The German constitutional court cannot stop the European Commission from raising €1tn in debt in the form of a perpetual bond. But it is important this debt is guaranteed by the EU rather than member states, because other national courts might raise their head. “Arguments over the future of the euro are only just starting. To win them, supporters of political and monetary integration must let go of the ECB as their comfort blanket, and the idea that it can always do whatever it takes. That battle was lost last week.” (“The European Central Bank is deluding itself over German court ruling”, Financial Times). |
| “A scaling theory of armed conflict avalanches”, by Lee et al | SUPRRISE The authors observe that, historically, “the unpredictability of armed conflict is cited in the classic texts on warfare, Sun-Tzu's The Art of War, Lanchester's Aircraft in Warfare, and Von Clausewitz's Vom Kriege.” They also observe that, “armed conflict data display scaling and universal dynamics in both social and physical properties like fatalities and geographic extent…Despite seeming chaos in the midst of a single conflict, the ensemble of many conflicts displays multiple mathematical regularities including Richardson's law, the scale-free distribution of fatalities in interstate warfare. "Yet how Richardson's law and other scaling patterns relate to one another remains unknown; a framework unifying these and other conflict aspects could facilitate prediction or reveal hidden and spurious cause of surprising outcomes.” The authors proceed to show, by studying the Armed Conflict Location & Event Data (ACLED) Project, that multiple quantitative regularities can be unified in in a simple scaling framework. They note that, these “regularities are evocative of scaling laws that emerge in other disordered, driven physical systems, [such as] animal societies with long temporal correlations in conflict dynamics, elections, cities, and other social systems.” |
| “Military Applications of Artificial Intelligence”, by Morgan et al from RAND | “The research in this report was conducted in 2017 and 2018. The report was delivered to the sponsor in October 2018 and was approved for public distribution in March 2020”… The authors survey the kinds of technologies broadly classified as AI, consider their potential benefits in military applications, and assess the ethical, operational, and strategic risks that these technologies entail… “Operational risks arise from questions about the reliability, fragility, and security of AI systems. “Strategic risks include the possibility that AI will increase the likelihood of war, escalate ongoing conflicts, and proliferate to malicious actors… They conclude that, “potential adversaries are increasingly integrating AI into a range of military applications in pursuit of warfighting advantages.” |
| “Defense Budget Implications of the COVID-19 Pandemic”, by Egel et al from RAND | “The COVID-19 pandemic is already taking a dramatic toll on the U.S. economy as businesses are shuttered, interstate commerce is restricted, and both domestic and global supply chains are disrupted. We anticipate that this could have significant medium-term implications for the defense budget and that there will be a need for the U.S. Department of Defense (DoD) to find efficiencies that are of at least the same magnitude as the recent sequestration… “In addition, the $2 trillion relief bill will expand total U.S. debt by nearly 10%, which was already $23.4 trillion at the onset of the crisis, putting defense and other government expenditures under increased pressure… “This is a daunting prospect, but what does it imply for defense spending, which totaled $676 billion in the federal fiscal year 2019? To begin with, some simple math can frame the scale of the concern for defense planners. If one assumes that the defense budget as a portion of GDP is held fixed at its current level — 3.2% — the macro estimates above would result in available resources for the DoD that are $350 to $600 billion lower than current plans over the next 10 years. "As a comparison, total cuts to the DoD under the Budget Control Act of 2011, which was enacted as part of the Congressional response to the ballooning deficit resulting from the Great Recession and the resulting economic stimulus packages, were somewhere closer to $500 billion over ten years…In this simple view, the potential losses to DoD from COVID-19 would be roughly comparable to a second sequestration. And while the Great Recession was unprecedented in modern U.S. history, most indicators suggest that the economic fallout from COVID-19 will be worse.” |
| As COVID19 has progressed, China’s relations with the United States and other western nations (e.g., Australia) have worsened, and it has been increasing its incursions of Taiwanese and Japanese airspace, and arresting democracy activists in Hong Kong | These are all further indicators that the world has entered a Second Cold War between China (loosely allied with Russia), and the United States (which, under Donald Trump, now has weaker relationships with allied nations than it did during the First Cold War). For an extended discussion of what this implies for the future, see this month’s feature article. |
| | |
| | |
| | |
| | |
| | |
| | |
| | |
| | |
| New Health and Disease Information: Indicators and Surprises | Why Is This Information Valuable? |
| “Viruses and volatility — how uncertainty impacts on our health”, by John Coates in the Financial Times | “Increased uncertainty (or volatility) leads to elevated levels of cortisol, the stress hormone. Prolonged uncertainty, as we’re experiencing with COVID19, can lead to a range of [physical and mental] health problems, as well as large decrease in risk appetite.” Both the health problems and the decline in risk appetite will act as restraints on future labor productivity and economic growth. They will also almost certainly cause social and political effects. The most likely is greater demand for various dimensions of security. |
| “Estimating SARS-CoV-2 seroprevalence and epidemiological parameters with uncertainty from serological surveys”, by Larremore et al | “Serological testing is a critical component of the response to COVID-19 as well as to future epidemics. Assessment of population seropositivity, a measure of the prevalence of individuals who have been infected in the past and developed antibodies to the virus, can address gaps in knowledge of the cumulative disease incidence. This is particularly important given inadequate viral diagnostic testing and incomplete understanding of the rates of mild and asymptomatic infections. In this context, serological surveillance has the potential to provide information about the true number of infections, allowing for robust estimates of case and infection fatality rates and for the parameterization of epidemiological models to evaluate the possible impacts of specific interventions and thus guide public health decision-making… “Three sources of uncertainty complicate efforts to learn population seroprevalence from subsampling. “First, tests may have imperfect sensitivity and specificity; estimates for COVID-19 tests on the market as of April 2020 reported specificity between 95% and 100% and sensitivity between 62% and 97%. “Second, the population sampled will likely not be a representative random sample, particularly in the first rounds of testing, when there is urgency to test using convenience samples and potentially limited serological testing capacity. “Third, there is uncertainty inherent to any model-based forecast which uses the empirical estimation of seroprevalence, regardless of the quality of the test, in part because of the uncertain relationship between seropositivity and immunity.” |
| “What Antibody Studies Can Tell You – And What They Can’t”, by Caroline Chen, ProPublica | SURPRISE “Herd immunity is when the vast majority of a given population have been infected. In such situations, the virus has a hard time infecting the remaining people, because there aren’t enough carriers to reach them. “In order to achieve herd immunity, scientists say that a community would need to have at least 60% of its population infected. That’s the lowest estimate I’ve been told. Other scientists have told me 80% to 90%. The reason this percentage isn’t precisely known is because it depends on things like exactly how contagious the virus is and also whether people who have been infected are immune forever, or if they lose immunity after a while, which researchers also are furiously working to figure out.” Note: The higher the Basic Reproductive Number (R0), the higher the proportion of the population that needs to be immune to stop its spread. This is known as the herd immunity threshold, and the formula for finding it is actually pretty straightforward: 1 – 1/R0. E.g., “Assessment of the SARS-CoV-2 basic reproduction number, R0, based on the early phase of COVID-19 outbreak in Italy”, by D’Arienzo and Conglio found a 95% Confidence Interval of 2.43 to 3.10. In “High Contagiousness and Rapid Spread of Severe Acute Respiratory Syndrome Coronavirus 2” Sanche et al from Los Alamos National Laboratory found a 95% CI for R0 of 3.8 to 8.9, with a median of 5.7 So far, estimates of COVID19’s reproductive number vary widely (see: “Modeling the Heterogeneity of COVID19’s Reproductive Number, and Its Impact on Predictive Scenarios” by Donnat and Holmes from Stanford University). The ProPublica article notes that no studies have reported levels of infection anywhere near high enough to confer herd immunity on a population. Chen writes that, “the highest rate I’ve seen is in Chelsea, Massachusetts, the epicenter of the coronavirus outbreak in that state. Researchers at Massachusetts General Hospital tested 200 pedestrians and found about a third had antibodies… “On April 23, NY Governor Andrew Cuomo announced preliminary data from the state’s serosurvey, saying that 13.9% of state residents had tested positive for antibodies. In New York City, it was about 21%... Chen concludes, “the other way to achieve herd immunity is via a vaccine, which is far safer and doesn’t involve millions of people getting sick. But developing vaccines is a slow process, so achieving herd immunity that way won’t happen any time soon.” |
| “Asymptomatic Transmission, the Achilles’ Heel of Current Strategies to Control Covid-19”, by Gandhi et al in the New England Journal of Medicine | “Traditional infection-control and public health strategies rely heavily on early detection of disease to contain spread. When Covid-19 burst onto the global scene, public health officials initially deployed interventions that were used to control severe acute respiratory syndrome (SARS) in 2003, including symptom-based case detection and subsequent testing to guide isolation and quarantine. “This initial approach was justified by the many similarities between SARS-CoV-1 and SARSCoV-2, including high genetic relatedness, transmission primarily through respiratory droplets, and the frequency of lower respiratory symptoms (fever, cough, and shortness of breath) with both infections developing a median of 5 days after exposure. “However, despite the deployment of similar control interventions, the trajectories of the two epidemics have veered in dramatically different directions. “Within 8 months, SARS was controlled after SARS-CoV-1 had infected approximately 8100 persons in limited geographic areas. “Within 5 months, SARS-CoV-2 has infected more than 2.6 million people and continues to spread rapidly around the world. “What explains these differences in transmission and spread? A key factor in the transmissibility of Covid-19 is the high level of SARS-CoV-2 shedding in the upper respiratory tract, even among presymptomatic patients, which distinguishes it from SARS-CoV-1, where replication occurs mainly in the lower respiratory tract… “Ultimately, the rapid spread of Covid-19 across the United States and the globe, the clear evidence of SARS-CoV-2 transmission from asymptomatic persons, and the eventual need to relax current social distancing practices argue for broadened SARS-CoV-2 testing to include asymptomatic persons in prioritized settings. These factors also support the case for the general public to use face masks when in crowded outdoor or indoor spaces.” |
| “A mysterious blood-clotting complication is killing coronavirus patients”, by Ariana Cha, Washington Post | SURPRISE “Accumulating research findings suggest that COVID19 is more than a respiratory virus, and in fact attacks the body in other ways. In analyzing comorbidities that affect COVID19 mortality, recent data and analyses find that pre-existing cardiovascular conditions increase risk far more than asthma.” |
| “An analysis of SARS-CoV-2 viral load by patient age”, by Jones et al | This is an important indicator as many states and nations struggle with the decision of when and how to reopen schools. “Data on viral load, as estimated by real-time RT-PCR threshold cycle values from 3,712 COVID-19 patients were analysed to examine the relationship between patient age and SARS-CoV-2 viral load. “Analysis of variance of viral loads in patients of different age categories found no significant difference between any pair of age categories including children. In particular, these data indicate that viral loads in the very young do not differ significantly from those of adults. Based on these results, we have to caution against an unlimited re-opening of schools and kindergartens in the present situation. Children may be as infectious as adults.” |
| “SARS-CoV-2 through the postpandemic period”, by Kissler et al | SURPRISE “It is urgent to understand the future of severe acute respiratory syndrome– coronavirus 2 (SARS-CoV-2) transmission. We used estimates of seasonality, immunity, and cross-immunity for betacoronaviruses OC43 and HKU1 from time series data from the USA to inform a model of SARS-CoV-2 transmission. “We projected that recurrent wintertime outbreaks of SARSCoV- 2 will probably occur after the initial, most severe pandemic wave. “Absent other interventions, a key metric for the success of social distancing is whether critical care capacities are exceeded. To avoid this, prolonged or intermittent social distancing may be necessary into 2022.” |
| “Coronavirus as a Strategic Challenge: Has Washington Missed the Problem” by Graham Allison | Allison challenges our thinking with a classic “Team B” analysis that is solidly grounded in the current evidence about COVID19 and its effects. “Stepping back, while it may seem insensitive, to assess the magnitude of the threat to the nation that has so far led to choices that have pushed what had been a robust economy into what markets expect will be the deepest contraction since the Great Depression, it is nonetheless necessary to look at the big picture. “In round numbers, BC [Before COVID19], according to actuarial tables, 3 million Americans were expected to die in 2020. If AC [After COVID19] that number grows by 100,000 to 3.1 million, how should we assess the significance of that? “For each of these individuals and their families and friends, of course, each death is a great tragedy. As John Donne taught us, every man or woman’s death “diminishes me.” “At the same time, for those who set life insurance rates, produce actuarial tables, and make judgments about hospital capacity, an additional 100,000 deaths would not require any change left of decimal place. “Brute facts are hard to ignore. In the world BC, how many Americans were dying daily from other causes? Roughly, 8,000. That means that in the 50 days since the first death from Coronavirus in which it claimed an additional 32,000 lives in the U.S., 400,000 of our fellow citizens died from other causes. The coronavirus death toll is thus roughly 4 days of “normal” deaths BC.” |
| | |
| | |
| | |
| New Social Information: Indicators and Surprises | Why Is This Information Valuable? |
| “Changes in Assortative Matching: Theory and Evidence for the US”, by Chiappori et al | “The extent to which like-with-like marry is particularly important for inequality as well as for the outcomes of children that result from the union…[We] conclude that assortative matching has increased in the United States, particularly at the top of the education distribution.” |
| “Population aging, migration, and productivity in Europe”, by Marois et al | This paper provides a systematic, multidimensional demographic analysis of the degree to which negative economic consequences of population aging can be mitigated by changes in migration and labor-force participation. The authors “build scenarios of future changes in labor-force participation, migration volumes, and their educational composition and speed of integration for the 28 European Union (EU) member states.” They also “study the consequences in terms of the conventional age-dependency ratio, the labor-force dependency ratio, and the productivity-weighted labor-force dependency ratio using education as a proxy of productivity, which accounts for the fact that not all individuals are equality productive in society… “The results show that population aging looks less daunting than when only considering age structure. In terms of policy options, lifting labor force participation among the general population as in Sweden, and education-selective migration if accompanied by high integration [a big if], could even improve economic dependency. On the other hand, high immigration volumes combined with both low education and integration [which has often been the case] leads to increasing economic dependency.” |
| “Risk Perception Through the Lens of Politics in the Time of the COVID-19 Pandemic”, by Barrios and Hochberg | SURPRISE “Even when, objectively speaking, death is on the line, partisan bias still colors beliefs about facts.” The authors find “that a higher share of Trump voters in a county is associated with lower perceptions of risk during the COVID-19 pandemic. “As Trump voter share rises, individuals search less for information on the virus, and engage in less social distancing behavior, as measured by smartphone location patterns. These patterns persist in the face of state-level mandates to close schools and businesses or to stay home.” |
| According to Gallup, in U.S., 14% with likely COVID-19 have avoided seeking care because of its cost | SURPRISE When more analyses of the spread of COVID19 in the United States are completed, they will likely show that this avoidance of treatment had a significant impact on the transmission of coronavirus and its impact on national infection and death rates. This will likely add to the pressure for substantial changes to the US healthcare system. |
| The health and economic impacts of COVID19 have split along age, gender, racial, class, geographic, and generational lines. As in 2008, the response of elites to the crisis does not come off well (e.g., see increasing anger about how US COVID19 response spending has been divided between big, medium, and small businesses). This will almost certainly produce very strong emotional reactions (led by anger as a protective response to fear) among people who still very clearly remember how in 2008 bankers were bailed out while they were left to suffer. | SURPRISE In terms of case fatality rates, older people have been hit harder, along with blacks, males, and people with comorbidities, many of which (e.g., like obesity and diabetes) tend to be negatively correlated with education and income. Economically, households with higher education and incomes have been the least affected. Some have alleged they are also the people most stridently demanding continuing quarantines until a vaccine is discovered and deployed, regardless of the horrible economic impact on their less well off fellow citizens. To be sure, workers with less education and lower incomes have been recognized as essential and held up as heroes – but without any support by their betters for increases in their pay or improvements to their healthcare (in fact, some financially pressed hospitals in the US have been furloughing employees and/or cutting their pay). Geographically, prosperous high density cities have been far harder hit than other regions of many countries, with disproportionate numbers of fatalities in places like Madrid, Milan, and New York. While it remains to be seen, it is very likely that another geographic distinction will also become relevant, with developing country populations harder hit than those in developed nations. Generationally, young people have also been hit hard economically. Some are burdened with student loans, others have struggled since 2008 in the increasingly unequal economy. Others are suddenly confronting the likely inadequacy of the education they have received in the harsh economy that lies ahead. The title of Annie Lowrey’s story in The Atlantic says it all: “Millennials Don’t Stand a Chance”. Lowrey cites polling from Data for Progress which “found a staggering 52 percent of people under the age of 45 have lost a job, been put on leave, or had their hours reduced due to the pandemic, compared with 26 percent of people over the age of 45.” That this is likely to lead to a lower birth rate in the future seems very likely at this point. Given equally likely restrictions on immigration, this will put more pressure on increased productivity as the driver of future economic growth. But that productivity growth will likely confront two obstacles: (1) resistance to automation if unemployment is still high, and (2) a lack of improvement in education results (see below). |
| The COVID19 shock could produce long-overdue changes in education systems that have long resisted change. However the chances of this happening seem even at best today. | SURPRISE At the primary and secondary levels (K-12 in North America), closure of schools forced a sudden shift to remote learning, by school systems that had long enjoyed near monopolies and successfully resisted substantial change, despite stagnant or declining results. Such conditions typically produce weak management teams, poor governance, and often dysfunctional organizational cultures. K-12 has proven to be no exception to this general rule. While Pew polling finds that “about two thirds of parents with children in K-12 are concerned their children are falling behind”, two databases of district responses to COVID19 maintained by the Center for Reinventing Public Education at the University of Washington and by the American Enterprise Institute tell the same story of many district teams struggling to shift to remote learning, and/or doing it poorly. In some cases, this has been compounded by teachers unions’ resistance to change. To be sure, this hasn’t been true of all K-12 organizations. Large charter networks (e.g., Success Academy) have responded very well, as have some larger systems (like Alberta in Canada, where the switch to remote was facilitated by the common provincial curriculum). But these are exceptions. And further problems are likely to arise when plans to reopen schools and businesses clash (e.g., because schools insist that students learn remotely from home 2 or 3 days each week, forcing a parent to miss work). Whether this will create both increased demands for new options based on the accumulation of competencies rather than classroom “seat time” (which seems very likely), and an increased supply of much higher quality offerings (which seems unlikely) remains to be seen. A key risk is that if only affluent parents and children can take advantage of these offerings, the education achievement gap will widen, and make it more difficult to reduce income inequality. At tertiary (university) level, key challenges will include the almost certain failure of many financially weak institutions (as happened in the Great Depression). It will also include the evolution of remote education will evolve (e.g., will current leaders like Colorado and Arizona State Universities strengthen their market position, or will universities with premier brands (e.g., the Russell Group in the UK or the “Ivies plus” in the US) risk the wrath of their alumni by substantially scaling up their online degree offerings. Most fundamentally, students and employers may come to question the value of expensive degrees themselves, and speed the ongoing move towards greater reliance on “portfolios of certified competencies” acquired online and displayed on personal LinkedIn profiles. |
| Even after economies begin to reopen, behavioral habits adopted because of COVID19 (e.g., social distancing and wearing masks) appear unlikely to change (e.g., the Georgia example in the US) unless and until an effective coronavirus vaccine is developed and deployed at scale. | SURPRISE This has profound implications, not just for the recovery of many businesses (e.g., restaurants, sports, theater, retail, etc.), but also for the recovery of institutions like churches and clubs that create and preserve social capital. With these only weakly functioning, it will be far more difficult to deal with the wave of mental health problems caused by COVID19 that many predict nations still have to face. As a result, “deaths of despair” will very likely increase. |
| “Reweaving the social fabric after the crisis”, by Andy Haldane, Chief Economist of the Bank of England, in the Financial Times | SURPRISE In this new column on the importance of social capital in the UK during and after COVID19, Haldane’s concerns echo those that have been raised in the United States by the US Congress’ Joint Economic Committee’s Social Capital Project, and before that by Charles Murray and Robert Putnam. What the different social sector responses to COVID19 in the UK and US have made clear, however, is that social capital in the UK appears to have declined far less than it has in the United States. Haldane notes that, “pandemics erode the capital on which capitalism is built. They damage the lives and livelihoods of people, depreciating the human capital on which economies and their citizens rely. They lower asset prices, depressing the financial capital that fuels growth. And they threaten business activity, and often viability, causing physical capital to be paused or scrapped. “This capital destruction is the reason why, historically, pandemics have caused large losses to jobs and living standards. The coronavirus crisis is unlikely to be an exception. “Yet one source of capital, as in past pandemics, is bucking these trends: social capital. This typically refers to the network of relationships across communities that support and strengthen societies. From surveys, we know that people greatly value these networks, even though social capital itself is rarely assigned a monetary value. “The social distancing policies enacted across the world to curb the spread of Covid-19 might have been expected to weaken social networks and damage social capital. In fact, the opposite has happened… “The economic and social progress that followed the Industrial Revolution came courtesy of a three-way partnership among the private, public and social sectors. The private sector provided the innovative spark; the state provided insurance to the incomes, jobs and health of citizens; and the social sector provided the support network to cope with disruption to lives and livelihoods. “Back then, social capital (every bit as much as human, financial and physical capital) provided the foundations on which capitalism was built. “The importance of this trinity has been reinforced by this crisis. The private sector is innovating to supply digital connectivity, vaccines and medical equipment. The state is offering large-scale income insurance and investing heavily in health. And the social sector is rising to the challenge of supporting the left-behind and left-alone. “For the social sector, two policy lessons follow from the experiences of the past few months and the past several centuries. The most immediate is that this sector needs financial as well as volunteer support if it is to serve as a countercyclical societal stabiliser… “The second, longer-term, policy lesson is that societies and policymakers must recognize and strengthen the social sector in good times as well as bad. Failing to do so, as Raghuram Rajan wrote in The Third Pillar, has been a major contributor to the fractures appearing in the capitalist model. “Restoring that third pillar requires much greater recognition of the importance social capital plays in our economies and societies.” |
| “In a polarized America, what can we do about civil disagreement?”, by Ashley Berner from Johns Hopkins University | SURPRISE “Many democracies participate in the International Civic and Citizenship Education Study (ICCS), most recently released in 2018. The ICCS probes not only individual students’ civic skills and knowledge (akin to the US National Assessment of Educational Progress [NAEP] civics test), but also whether their teachers and classrooms routinely solicit multiple perspectives and support sustained deliberation on important subjects. “According to the ICCS, the positive association between such classrooms and desirable civic outcomes has remained robust for more than 40 years…Deliberative classrooms matter... “Despite this, the United States has not participated in an international civics assessment since 1999. While NAEP (known as “the nation’s report card”) charts the civic knowledge and skills of eighth-graders every four years, it does not investigate classroom- or school-level contexts. As a result, US policymakers have had no clear indication of whether classrooms are effectively cultivating democratic citizenship. “To fill this critical gap, our research team at the Johns Hopkins Institute for Education Policy designed School Culture 360, a deep dive into the experiences that administrators, teachers, parents, and secondary students have within the school community. In doing so, we embedded questions from the ICCS and field-tested additional, often open-ended questions as well. “We ask students whether their teachers introduce multiple perspectives on a given subject. We ask teachers whether students feel comfortable discussing current political controversies. We ask parents how important it is to them that their children receive instruction in civics and citizenship. We even ask students what they can’t talk about at school, which is just as illuminating as what they can. “In our pilot cohort of 26,000 participants, we found lots of variation on such measures, even between schools of similar size serving similar students. “The percentage of secondary students who “somewhat” or “strongly” agreed that their teachers encouraged discussions on important topics, for instance, was quite low in some schools, and quite high in others. Or, in some cases, parents and administrators in the same school community disagreed about the relative importance of “citizenship – or understanding institutions and public values.” “One point of convergence, however, was the taboo subject that students across our pilot cohort listed most frequently: “Politics.” These young people, in other words, do not seem to be engaging with substantive economic and diplomatic issues or comparing the very policies that will affect students’ lives well into the future—much less learning to disagree, even strongly, and with civility.” |
| “Promise and Peril: The History of American Religiosity and Its Recent Decline”, by Lyman Stone | SURPRISE “By any measure, religiosity in America is declining. As this report will show, since peaking in 1960, the share of American adults attending any religious service in a typical week has fallen from 50 percent to about 35 percent, while the share claimed as members by any religious body has fallen from over 75 percent to about 62 percent. Finally, the share of Americans who self-identify or report being affiliated with any religion has fallen from over 95 percent to about 75 percent… “The present decline is striking in its speed and uniformity across different measures of religiosity. But a longer historical perspective suggests some caution in making overbold statements about what such a decline might portend. At the dawn of the American republic in the 1780s, probably just a third of Americans were members in any religious body, and just a fifth could be found at church on a given Sunday. This was an historic low ebb in American religiosity. Thus, in some important ways, America today is more religious than it was two centuries ago—and indeed at any point between 1750 and 1930. “But the perception of an increasingly secular society is not wrong. Even in past periods when religious attendance and membership were low, other forms of religious attachment were still robust… Furthermore, early America was dominated by formal, official religion. Most of the 13 colonies had established religions, and legal favoritism for some religious groups continued in various forms and places until at least the 1950s… “Today, all this has changed. More Americans have no religious identity at all. A quarter do not identify with any religion, less than a third are given names connected to any religion, and America’s legal environment is increasingly secular, explicitly limiting support for religion… “Expansions in government service provision and especially increasingly secularized government control of education significantly drive secularization and can account for virtually the entire increase in secularization around the developed world. The decline in religiosity in America is not the product of a natural change in preferences, but an engineered outcome of clearly identifiable policy choices in the past.” |
| | |
| | |
| | |
| New Political Information: Indicators and Surprises | Why Is This Information Valuable? |
| While many political uncertainties have been created or worsened by COVID19, perhaps the most important of all is the future impact of accumulating economic pain and social fear and anger. As the United States heads toward the November election, a critical uncertainty is how these emotions will interact with competing political narratives. | In periods of high uncertainty, evolution has primed us to take actions that increase our chance of survival. These includes conforming more closely to the views of our group and/or its strong leader, and thus depending more on social learning and copying than our independent evaluation of private and public information. Hence, the contest to attract voters to competing political narratives, in a highly polarized, hyper-connected, and social media saturated electorate, will be critical to how the future evolves. It is not hard to envision, in broad terms at least, the main themes of these narratives, including how they explaining the present (or blaming others for it), and offer hope for the future. There will almost certainly be a left/populist narrative based on a mix of ideology and identity politics that demands relief for different victim groups, an expanded government in many areas, paid for with higher (monetized) deficits and much higher taxes on elites, along with greater regulation of business (e.g., healthcare, reshoring of supply chains, minimum wages, etc.). This narrative is also likely to have a strong emphasis on “green” infrastructure programs to limit global warming and the future catastrophes it threatens. There will also very likely be a center/left narrative that is more focused on common class based interests. It will likely adopt similar economic positions as the progressives, but drop the latter’s emphasis on identity issues in favor of more traditional communitarian themes (“we’re all in this together”, “we need our allies to preserve our national security”, etc.), and a renewed emphasis on leadership quality and government competence. A center/right narrative will likely use the similar social themes. It will likely put more emphasis on the need for competent leadership in critical institutions, and less on an expansion of government’s role. A good example of this is the recent proposal in the UK for a new government backed initiative (“a new 3i”) that would support small and medium sized businesses not with loans, but with equity. Another example is the proposal for bankruptcy reforms. A center/right narrative will also focus on a more aggressive China’s threat to the west. Today, the UK Conservative Party’s evolving narrative (e.g., “One Nation Conservatism”) is perhaps the best example of this approach. In the United States, various elements of this narrative are slowly emerging from the traditional social, economic, and foreign policy wings of the Republican Party (e.g., Oren Cass’ new American Compass think tank). However, these various lines of thinking will likely not congeal into a clear narrative until after the 2020 election. Finally, we will also see right/populist narratives, which, like the progressive narrative, are based on identity rather than ideology or class interests –in right/populist case, national and racial identity. The fundamental value proposition of this narrative is protecting a traditionally dominant (rather than victimized) in-group against potential losses to domestic and foreign out groups that are perceived as increasing threats. In times of high uncertainty, anxiety, and fear such narratives have powerfully appealed to human beings’ primitive survival instincts. However, as Francis Fukuyama has observed, narratives that focus on identify undermine traditional democratic political processes, and impel countries towards more authoritarian forms of government. |
| Pew polling found that 65% of American adults believe Donald Trump was too slow to respond to the coronavirus outbreak in the US. 73% say that, in thinking about the problems the country is facing from the outbreak, the worst is yet to come (Pew Research 16Apr20). | SURPRISE As Lee Drutman concludes in “The COVID-19 Blame Game Is Going To Get Uglier”, “the 2020 election will be the COVID-19 election. Voters will almost certainly be asked to condemn or endorse President Trump’s handling of the pandemic — and quite possibly while the virus is in the midst of a fall relapse… Here is the crudest of calculations: If Democrats can successfully associate the substantial harm wreaked by COVID-19 with Trump, they win in November. But if Trump and the Republicans can deflect enough blame elsewhere and Trump gets credit for making things less bad than they could have been, Trump will win.” |
| In the same Pew survey, 47% of Sanders supporters agreed with the statement that, “Differences will keep many Democrats from supporting Biden”. | SURPRISE Biden’s choice of a vice presidential running mate will very likely have a large impact on the outcome of the election in November. A choice that satisfies the progressive wing of the party may cost it critical support in the swing states Biden must carry to win the electoral college. On balance, this is likely to be a greater concern to Biden than losing progressive support that is heavily concentrated in states that a Democratic candidate is already almost certain to carry. |
| US presidential candidate Joe Biden has been accused of sexual assault by a former staff member. | SURPRISE As was the case with accusations against Supreme Court Justice Clarence Thomas by Anita Hill, followed by the Bill Clinton and Monica Lewinsky saga, and now coming as it does after the bitter fight over similar accusations against Supreme Court Justice Brett Kavanaugh, the inconsistency of Democrats’ positions on this issue seem likely to hurt them with swing voters in key states in November. |
| The health of Joe Biden and Donald Trump is another critical uncertainty in the US election. | Both are old, and questions have been raised about both men’s cognitive health. And both are in the high risk category should either contract COVID19. However, any attempt to replace Biden as the Democratic candidate would reopen the battle between the party’s traditional and progressive wings, with the latter demanding that Bernie Sanders become the candidate. On the Republican side, loss of Trump as the party’s candidate would very likely lead to a contested convention at which Mike Pence and Nikki Haley would vie for the nomination. If the latter won, she would very likely be a formidable opponent for whomever the Democratic candidate turned out to be (and note that this year the Republican convention will be held after the Democratic convention). |
| In a worrisome development, Donald Trump has started firing federal government Inspector Generals | SUPRRISE In “An Attack On Inspector General Signals Something Much Bigger, Joshua Rovner notes that, “Exacting revenge on government officials for doing their jobs is bad. Going after inspectors general is especially dangerous because they serve as watchdogs for Congress and the public. Going after the intelligence community inspector general is worst of all, due to the uneasy place of secret intelligence in a democracy... "Inspectors general are vital. They serve a “boundary spanning” function, acting simultaneously as internal and external watchdogs. An inspector general is part of the hierarchy of its respective agency, but its activities are not subject to internal sanction. By law, inspectors general have broad access to organizational practices, even when organizations operate behind multiple layers of classification. “Beginning with the Inspectors General Act of 1978, Congress has steadily expanded their powers. Most recently, the Inspector General Empowerment Act of 2016 ensures that they have “have timely access to all records, reports, audits, reviews, documents, papers, recommendations, or other materials available.” |
| “Extremist ideology as a complex contagion: the spread of far-right radicalization in the United States between 2005-2017”, by Mason Youngblood | SURPRISE “The far-right movement, which includes white supremacists, neo-Nazis, and sovereign citizens, is the oldest and most deadly form of domestic extremism in the United States Increasing levels of far-right extremist violence have generated public concern about the spread of radicalization in the United States… “Previous research suggests that radicalized individuals are destabilized by various environmental (or endemic) factors, exposed to extremist ideology, and subsequently reinforced by members of their community. As such, the spread of radicalization may proceed through a social contagion process, in which extremist ideologies behave like complex contagions that require multiple exposures for adoption.” The author studies “data from 416 far-right extremists exposed in the United States between 2005 and 2017. The results indicate that patterns of far-right radicalization in the United States are consistent with a complex contagion process, in which reinforcement is required for transmission. Both social media usage and group membership enhance the spread of extremist ideology, suggesting that online and physical organizing remain primary recruitment tools of the far-right movement.” Needless to say, it would be very interesting to see a similar study of how far left populism has spread. |
| The latest revelations in the criminal case against former National Security Adviser Michael Flynn will likely have an impact on the November election | SURPRISE According to Politico, “The FBI took steps in early 2017 to close its investigation into former Trump adviser Michael Flynn before abruptly reversing course, according to new documents filed in Flynn’s pending legal effort to rescind his guilty plea for lying to federal agents. “The filings indicate that by Jan. 4, 2017, the FBI had drafted a document summarizing findings on a probe — code-named “Crossfire Razor” — of whether Flynn had been acting as a Russian agent during the 2016 campaign. "The partly redacted document, which was included in the court filings, indicated the FBI had no “derogatory” information on Flynn and was prepared to close the case... But messages later that afternoon between senior agents and FBI officials show a last-minute reversal, driven by discussions at the bureau’s highest levels.” Later, after the FBI threatened to prosecute his son, Flynn agreed to plead guilty to reduced charges against him. His subsequent withdrawal of his guilty plea, and the Justice Department’s recommendation that the charges against him be dropped, is now the subject of yet another confrontation between Trumps’ supporters and detractors. |
| “Precarity, not inequality is what ails the 99%”, by Albena Azomanova in the Financial Times | SURPRISE This is an outstanding assessment of a, or perhaps the, fundamental driver of political volatility and disruption today. “Tax the rich” has become the progressive battle cry — and not merely on the fringe. The scourge of economic inequality is celebrity politics, voiced by Nobel prizewinners and international policy chiefs alike. “Yet this slogan did not deliver the electoral victories the left hoped for. The reason is that economic instability, not inequality, is what ails the 99 per cent. Inequality is one symptom of instability, to be sure. But to focus on inequality alone is a diagnostic error. And the cure is not simply redistribution of purchasing power, but more radical: to build a more stable, secure and sustainable society. The Covid-19 pandemic drives this point home… “Inequality is a statistical fact. It can be measured and thus easily draws attention. But when does the statistical fact of economic inequality become a form of social injustice? One answer: when affluence entails social privilege; when extreme wealth translates into power that is self-serving and predatory. Here the realistic remedy is not redistribution but countervailing power: trade unions and other mass organising; strong, principled political parties; prosecutions for financial fraud; and vigilance against state capture. “A second big problem comes when wealth becomes the only apparent source of safety. “This is our predicament now. The combination of automation, globalisation and cuts in public services and social insurance, has generated massive economic instability for ordinary citizens — for men and women, young and old, skilled and unskilled, for the middle classes and the poor alike. It is much deeper for minorities, immigrants and other disadvantaged groups. “The pandemic was exacerbated by precarity, our politically crafted social insecurity... “The insecurity and frailty of the 99 per cent is rooted in the poverty of our shared services, the weakness of public education, the burden of debt on graduates and, above all, in poor public health, and underfunded or even inaccessible healthcare. “This would not change even if our societies became perfectly equal. We are in this conundrum because contemporary capitalism had created not just a precarious class (the “precariat”) but a precarious multitude…” |
| “Prediction Model Based on Integrated Political Economy System: The Case of US Presidential Election”, by Li et al, from the School of Systems Science, Beijing Normal University | SUPRRISE This paper is fascinating for three reasons. First, it provides a detailed model, at the state and industry level, of the interaction between economics and political outcomes. Second, in so doing, it shows how economic and industrial policy can influence those political outcomes. Most important, given that the authors all come from Beijing University, it raises the issue of whether, as one of its goals, China’s long term industrial policy has sought to influence the structural dynamics of presidential politics in the United States. “In view of the high complexity of real-world systems, researchers should conduct research from a systematic perspective to better understand the mechanism of systems and control them efficiently, which requires us not only to take into account the multilevel structure within a single system, but also to explore the coupling interaction between systems. “For example, if we only focus on the own factors of the political system (e.g. campaign slogans and canvassing activities) and ignore the complex interaction existing between the political system and other real-world systems (e.g. economics and transportation), the conclusion may fall into an unrealistic misunderstanding… “Given the close relationship between politics and economy, there is a need for systematic approaches to specifically analyze the interaction… “This paper studies an integrated system of political and economic systems from a systematic perspective to explore the complex interaction between them, and specially analyzes the case of the US presidential election forecasting… “We propose a simple and efficient prediction model for the US presidential election, and meanwhile inspire a new way to model the economic structure. Our findings highlight the close relationship between economic structure and political attitude.” |
| A critical uncertainty going forward is to what extent governments’ response to COVID19 has accelerated the decline in their perceived legitimacy that was evident well before the pandemic arrived. | SURPRISE Consider three recent observations on this issue. In “The Coronavirus Pandemic will Forever Alter the World Order”, Henry Kissinger observes that, “Nations cohere and flourish on the belief that their institutions can foresee calamity, arrest its impact, and restore stability. When the COVID19 pandemic is over, many countries’ institutions will be perceived as having failed.” In Politico, Sue Gordon, a retired career intelligence officer, noted that, ““COVID has proved we need institutions. And yet, our bureaucracies are proving increasingly ineffective, in part because the speed of decision-making that is required. We need to reimagine and rebuild. Who are the leaders who are going to come in and do that? My catastrophic event is the failure of bureaucracy to provide the governance our society needs, keeping true to our values.” And in his powerful essay in The Atlantic (“We Are Living in a Failed State”), George Packer observed, “when the virus came here, it found a country with serious underlying conditions, and it exploited them ruthlessly. Chronic ills—a corrupt political class, a sclerotic bureaucracy, a heartless economy, a divided and distracted public— had gone untreated for years… “Every morning in the endless month of March, Americans woke up to find themselves citizens of a failed state. With no national plan—no coherent instructions at all—families, schools, and offices were left to decide on their own whether to shut down and take shelter. “When test kits, masks, gowns, and ventilators were found to be in desperately short supply, governors pleaded for them from the White House, which stalled, then called on private enterprise, which couldn’t deliver… “Like France in 1940, America in 2020 has stunned itself with a collapse that’s larger and deeper than one miserable leader… “Despite countless examples around the U.S. of individual courage and sacrifice, the failure is national. And it should force a question that most Americans have never had to ask: Do we trust our leaders and one another enough to summon a collective response to a mortal threat? Are we still capable of self-government?” |
| According to Pew Research, “two-thirds of Americans expect the November presidential election will be disrupted by COVID19.” 80% of Democrats believe this – but so do 50% of Republicans. | SURPRISE For example, while 70% of voters support voting by mail (which has been done in Colorado since 2016, with few problems), President Trump is increasingly vocal in his opposition to other states making this change. He has actually gone so far as threatening to withhold federal aid to states that approve mail ballots. Any attempt by a sitting president to disrupt an election, or to refuse to vacate office if he is defeated, would obviously create a very substantial spike in uncertainty, and have very grave consequences for financial markets, which would likely include flight from the US dollar. |
| | |
| New Financial Markets and Investor Behavior: Indicators and Surprises | Why Is This Information Valuable? |
| “The Murder-Suicide of the Rentier: Population Aging and the Risk Premium”, by Kopecky and Taylor | SURPRISE “Population aging has been linked to global declines in interest rates. A similar trend shows that equity risk premia are on the rise. An existing literature can explain part of the decline in the trend in safe rates using demographics, but has no mechanism to speak to trends in relative asset prices. “We calibrate a heterogeneous agent life-cycle model with equity markets, showing that this demographic channel can simultaneously account for both the majority of a downward trend in the risk free rate, while also increasing premium attached to risky assets. This is because the life cycle savings dynamics that have been well documented exert less pressure on risky assets as older households shift away from risk. “Under reasonable calibrations we find declines in the safe rate that are considerably larger than most existing estimates between the years 1990 and 2017. We are also able to account for most of the rise in the equity risk premium. Projecting forward to 2050 we show that persistent demographic forces will continue push the risk free rate further into negative territory, while the equity risk premium remains elevated” |
| “The Death of Trust Across the Finance Industry”, by Limbach et al | SURPRISE Having arrived on Wall Street in the late 1970s, this paper struck a powerful chord, as it supports what I have anecdotally observed over the years with more systematic evidence. The authors show how trust has evolved in the finance industry over the long run, using data from a representative U.S. survey between 1978 and 2016. They find that “the level of trust of finance professionals has not only declined in absolute terms, but also relative to the general U.S. population. Simply put, while generalized trust has declined in U.S. society as whole, it has declined significantly more across finance professionals. This relative decline in trust is unique to finance.” They also find that “the relative decline in trust is particularly strong in the investment sector and among professionals with higher seniority, i.e., those who set the tone [in their organizations and in the industry as a whole]”. |
| “AntiNoise”, by Cheng and Struck | SUPRRISE The authors “employ machine learning techniques to quantify the extent to which noise traders' behavior creates systematic patterns in returns.” Studying U.S. equity markets, they “find that noise traders account for less than 1.21% of stock returns in recent years.” That is far less than most people would likely estimate. |
| “Who Benefits from Robo-advising? Evidence from Machine Learning”, by Rossi and Utkus | SURPRISE The authors “study the effects of a large U.S. hybrid robo-adviser on the portfolios of previously self-directed investors. Across all investors, robo-advising reduces investors' holdings in money market mutual funds and increases bond holdings. It also reduces idiosyncratic risk by lowering the holdings of individual stocks and US and international active mutual funds and raising exposure to low-cost indexed mutual funds. It further eliminates home bias by significantly increasing international equity and fixed income diversification. “Investors who benefit from robo-advice are those with little self-directed investment experience on the platform, those with prior high cash holdings, and those with high trading volume before adopting advice. Individuals invested in high-fee active mutual funds also display significant performance gains.” This analysis is fine as far as it goes. But sometimes it is the dog that doesn’t bark that provides the most important information. Because this analysis was completed before the COVID19 shock hit financial markets, it is silent on whether robo clients were fully invested when it hit. At the end of 2019, our model portfolio was fully defensive (with significant allocations to cash and gold), due to very high valuations across multiple asset classes and rapidly strengthening economic headwinds. When it comes to achieving long-term investing goals, over the years, here at The Index Investor we have repeatedly emphasized that avoiding large losses is mathematically more important than achieving big gains. Consider this simple example: If you start with 100, and earn 50%, you have 150. If you then lose 50%, you are left with 75. Another 50% gain only brings you back to 112.50. Whenever it is written, we look forward to reading how robo-advisors (and their clients) performed during the COVID19 shock. |
| | |
| | |
| | |
| | |
System Tipping Points/Critical Threshold Analysis
Like Professors Andrew Lo, Doyne Farmer and others, we regard financial markets as a complex adaptive system (CAS), that exist as part of a larger macro system comprised of other CAS between which there are multiple feedback loops. These other systems include those that produce technology innovations, and economic, environmental, national security (including cyber), social, demographic, and political outcomes.
We also find that these systems tend to operate and generate effects in a rough chronological sequence, albeit with many feedback loops between them. The following chart highlights that the changes we observe in different areas at any point in time are actually part of a much more complex evolutionary process.
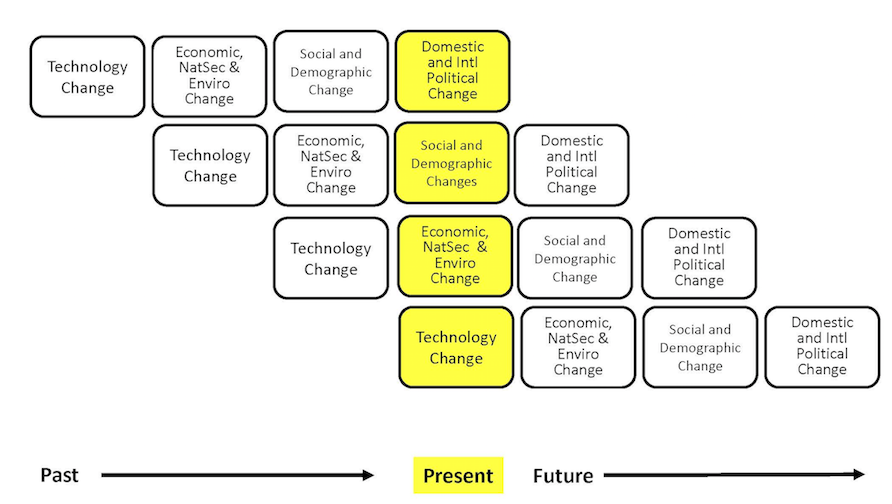
While most media coverage of these systems focused on flows (e.g., the size of the government deficit), rapid non-linear change in complex adaptive systems is often caused by a key stock (e.g., the amount of outstanding government debt) exceeding a critical threshold.
The next table highlights the key macro system stocks that we monitor.
In the next section, we will discuss information received over the past month that is related to these stocks, and which we believe is significant to our assessment of the probabilities that a critical threshold will be reached and a regime change will occur. We will conclude with our estimate, at the end of this month, of how close the macro system is to these critical thresholds, and the implications for financial market regime change probabilities.
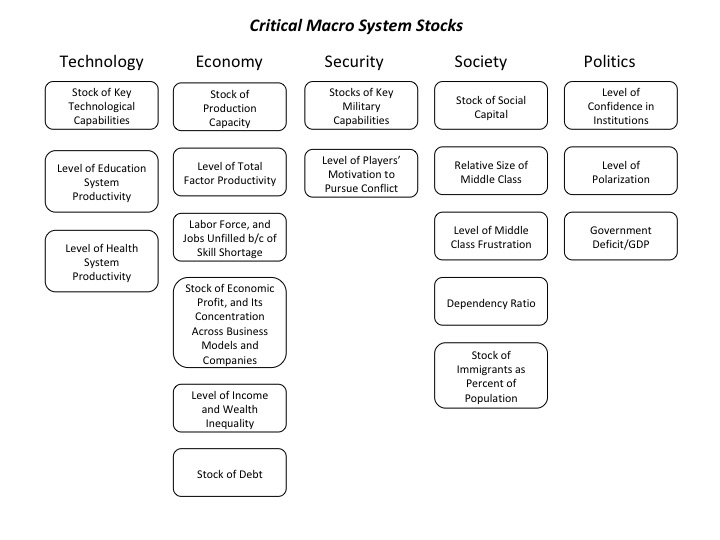
How Close is the Macro System to One or More Critical Thresholds?
As we have noted, the macro drivers of financial market regime changes typically follow a rough chronological sequence, from technology to economic, security, social, and political causes and effects. Yet there are many feedbacks loops between them, creating complex root causes for many of the critical thresholds we have identified.
Understanding the time dynamics in this complex system is critical to avoiding substantial downside investment risk.
We use the UK Met Office Warning Model to communicate our assessment of these time dynamics. We estimate the time remaining before a critical macro system threshold is reached that could trigger a regime change, which is usually accompanied by substantial changes in asset class valuations.
The model uses three increasingly serious levels of warning, from “Be Aware” (condition yellow), to “Be Prepared” (condition orange), to “Take Action” (condition red).
For our purposes, we denote as “Be Aware” (yellow) critical thresholds that we assess to be three or more years away. We estimate that “Be Prepared” (orange) thresholds could be reached within 1 to 3 years. “Take Action” thresholds are very likely to be reached within one year.
Given their nature, we also note that in our three “wildcard” areas (Environment and Energy related; Disease and Human Caused Bioevents; and Cyber and Electromagnetic Events), our forecasts have higher levels of uncertainty.
The following charts summarize our current estimate of the time remaining before different critical thresholds will be reached.
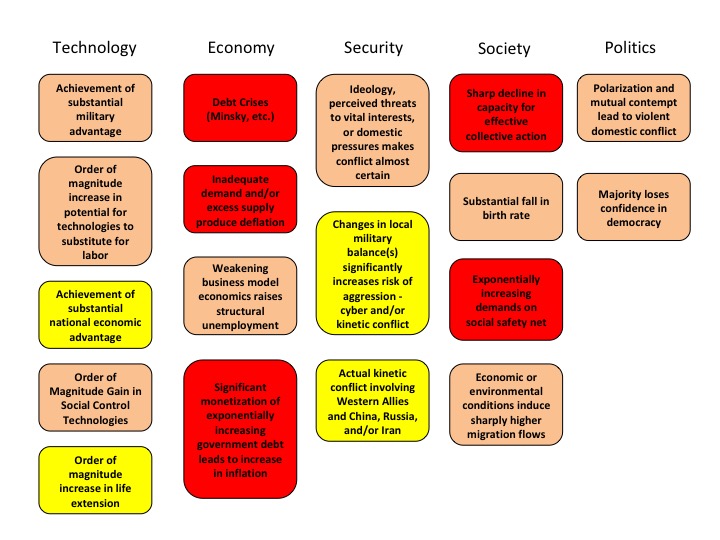
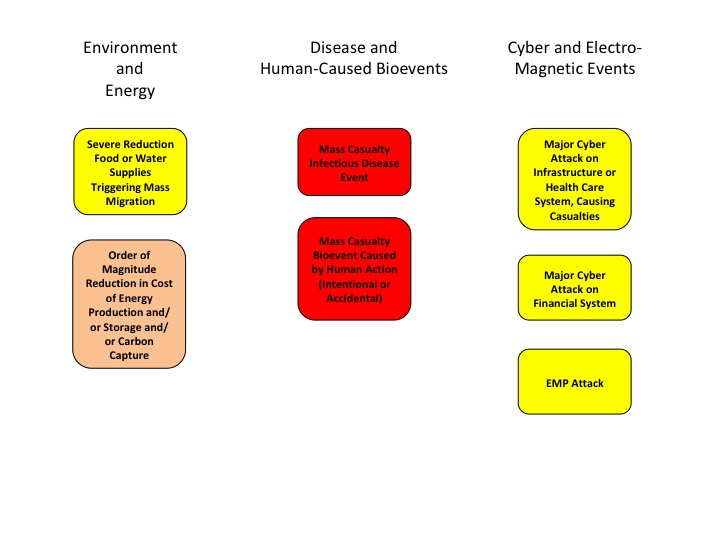
At the highest level, we believe the complex adaptive global macro system can be in one of four states, based on its degree of order versus disorder, and degree of social cooperation versus conflict. A very coarse-grained reading of history suggests that these states evolve in a predictable cycle, from ordered/cooperative, to disordered/cooperative, to disordered/conflicted, to ordered/conflicted.
We believe that the system is currently in its most uncertain state, characterized by high degrees of underlying disorder and social conflict, both domestically and internationally. Beyond some point, intensifying conflict eventually increases the degree of order in the system. That appears to be happening now, via the increasing conflict between China, Russia, and Iran and the United States and other Western nations.
If you have any questions about anything we have written in this issue, please don’t hesitate to get in touch, at contact@indexinvestor.com
Appendix: Anticipatory Thinking and Forecasting Methodologies
Our process is based on methods and tools developed over the past seven years at our affiliate, Britten Coyne Partners, which provides consulting services and education courses to executive teams and boards on strategic risk governance and management.
At The Index Investor, we engage in both anticipatory thinking to identify what could happen (e.g., different macro regimes and related events), and forecasting, to estimate the probability that events and regimes will happen, and the impact they will have if they do (e.g., on macro variables and broad asset class returns).
With respect to what could happen, we are acutely conscious of the conclusion reached by a 1983 CIA study of failed forecasts: "each involved historical discontinuity, and, in the early stages…unlikely outcomes. The basic problem was…situations in which trend continuity and precedent were of marginal, if not counterproductive value."
When it comes to forecasting, we know that in complex socio-technical systems that are constantly evolving, the accuracy of statistical or machine learning based forecasting methods declines exponentially as the time horizon lengthens, since the historical data set on which they were trained will (depending on the speed and effectiveness of any retraining cycle) bear less and less resemblance to the distribution of outcomes the system is likely to produce in the future.
Under these circumstances, forecast accuracy over longer time horizons depends on causal and counterfactual reasoning about the possible future effects of multiple interacting trends and uncertainties that are hard to quantify.
And we are acutely aware of the economist Rudi Dornbusch's famous warning: "Crises take a much longer time coming than you think, then happen much faster than you would have thought."
Our forecasting process also draws on lessons Tom Coyne learned from spending four years as a member of the Good Judgment Project team, which won the Intelligence Advanced Research Projects Activity’s forecasting tournament with forecast accuracy that was more than 50% better than the tournament's control groups (the team's experience is described in Professor Philip Tetlock's book, “Superforecasting").
Our analysis focuses on the probability of the global macro system being in four possible macro regimes 12 and 36 months from the date of our forecast: (1) Normal Times, where equity asset classes perform well; (2) a High Uncertainty regime that is usually short and transitory, where asset classes like short-term government bonds perform best and equities suffer significant declines; (3) High Inflation (which we deem 5% or more, year-on-year), where commercial property, real return bonds and other traditional hedges are favored; and (4) Persistent Deflation (a year-on-year decline in the US CPI), which up to now has only been seen in Japan, and in which the relative performance of different asset classes remains uncertain, but will likely favor high quality bonds and the consumer staples equity sector.
In response to subscriber requests, we have added a 36-month regime forecast to our existing 12 month forecast. The logic is that, in a complex evolving system like global macro, a longer forecast horizon gets beyond the “detection range” of algorithmic forecasting approaches, and therefore raises probability that a manager/investor can gain an edge in identifying emerging threats and opportunities.
That said, because evolving (i.e., “non-stationary”) complex systems populated by highly connected human agents are also capable of sudden non-linear changes (with which are hard for algorithmic approaches to predict), we are also keeping our 12 month forecast.
Our forecasting methodology starts with base rate/reference case data about the historical probability of large changes in equity and bond valuations. We then analyze the current situation from both a quantitative and qualitative perspective. In the latter, we focus on the key endogenous drivers of macro regime change, including technological, economic, national security, social, and political trends and uncertainties. We also focus on three potential sources of exogenous shocks that could also produce a macro regime change, caused by environmental, disease, and cyber related events.
While most of our attention typically focuses on various flows (e.g., economic growth, change in the price level, sales, earnings, job creation, etc.), endogenously caused regime changes result when those flows push key stocks beyond a critical threshold or tipping point, often setting off non-linear reactions across multiple areas. As noted by Hyman Minsky and others, a classic example is the steady accumulation of outstanding debt until it reaches the point where it can no longer be serviced and triggers a crisis.
Base Rate Data
Since the end of World War Two, there have been fifteen months where a downturn in the US equity market began that eventually reduced asset class value by 20% of more. That is a hazard rate of about 1.75% per month. Put differently, in any given month there is a 98.25% probability that a 20%+ downturn won’t occur, or, in a given year, an 81% probability.
However, as the time without a 20%+ downturn extends, the compound probability that one will not occur shrinks. At the end of August 2018, it is more than nine years since the last equity market decline of 20% or more. The probability of that happening is only 15%.
To estimate the base rate for a 20% fall in bond prices (which historically has been caused by a sharp increase in inflation, as we saw in the late 1970s and early 1980s), we analyzed monthly historical AAA bond yields since 1919. For consistency, we used them to calculate the price of a ten-year zero coupon bond. We then calculated the probability of a price decline of 20% or more over three different holding periods: 12, 18, and 24 months. In any month, the annualized probability of a decline of 20% or more over the subsequent 12 months is 12%; over 18 months, 20%, and over 24 months, 25%.
Market Stress Indicators Methodology
We view financial markets as a complex adaptive system. The size of changes generated by such a system follows a power law rather than a normal (Gaussian) distribution. The critical point is that large changes are much more common in complex adaptive systems than most people’s intuition leads them to believe.
While predicting the behavior of complex adaptive systems remains far more art than a science, various researchers have found that large changes in such systems are often preceded by subtle warning signs, as stress accumulates within them. While this research is not definitive, we believe that five warning signs are worth monitoring as potential indicators of growing stress within financial markets that could suddenly give rise to large changes in asset class valuations.
Our first indicator is the month-to-month autocorrelation of broad asset class returns (i.e., the relationship of this month’s returns to last month’s). A system under increasing stress loses resiliency, causing it to take longer to recover from perturbations; hence, autocorrelation increases as it approaches a critical transition (see, “Early Warning Signals for Critical Transitions” by Scheffer, et al).
The second market stress indicator we monitor is the Economic Policy Uncertainty Index published by the Federal Reserve Bank of St. Louis (via its FRED economic database), which is based on research by Baker, Bloom, and Davis (see their paper, “Measuring Economic Policy Uncertainty”). The index is based on automated text analysis of leading newspapers and magazine publications, to identify the frequency with which words and phrases are used that indicate uncertainty.
In humans’ evolutionary past, when uncertainty increased the probability of survival was enhanced by staying close to a group. All of us still have that instinct. Research has found that as uncertainty increases, we have an unconscious bias towards higher conformity of our own views with those of a larger group (i.e., reduction in cognitive diversity). Behaviorally, heightened uncertainty induces more “social copying” of others, likely due to both conformity bias and the rational belief that others may be acting on the basis of superior information. This increase in conformity and copying makes a social system more ordered as uncertainty increases, and also reduces its responsiveness to perturbations (i.e., increases autocorrelation) because of delays in the social copying process.
The key point is that increasing uncertainty induces more, not less order in social systems, and in so doing primes them for sudden non-linear change.
Our third market stress indicator is the spread between the yield on AAA rated bonds and the 10-year US Treasury. This is a proxy for the level of investor concern about financial system funding liquidity.
Our fourth market stress indicator is the yield spread between speculative BB rated bonds and the ten-year US Treasury. Throughout history, excessive credit growth has been a root cause of many financial crises. An indicator of such growth is falling credit spreads, particularly in the case of riskier borrowers. In contrast, rising BB spreads indicate growing investor concern about the consequences of such growth, and the financial distress lower rated companies could experience in an economic downturn.
Our fifth market stress indicator is what we term the “political risk premium” that is implicit in the price of gold. Our starting point for estimating this premium is the three different roles that gold plays. First, gold is a store of value in a world of fiat currencies. When the rate of money supply growth exceeds the growth of nominal GDP, gold’s price should increase to maintain its purchasing power. Between 2007 and 2017, the US money supply (M2) grew by about 86%, while nominal US GDP grew by 35%. The stock of gold grew by 18%, based on mine production over this period. We therefore infer that 33% of the increase in the price of gold represented the maximum potential gold price change that could be attributed to a desire to hedge inflation risk (86% less 35% less 18%).
Second, gold is a unit of account. We take this to mean that the annual change in GDP expressed in terms of physical gold (i.e., nominal GDP divided by the price of gold) should equal the change in real GDP calculated using the GDP price deflator to account for actual inflation over the period. A key challenge is the point at which to start this calculation.
We chose the price of gold in 1995/1996. In that period, the change in real global GDP measured using the IMF’s price deflator just about equaled the change in GDP measured in terms of physical gold. We interpret that coincidence as indicating that at that point in time, concerns about future inflation and political risk were minimal, and the change in the price of gold was mostly driven by its role as a unit of account. We calculated a subsequent series of gold prices that would produce the same change in “gold GDP” as the actual real GDP as calculated by the IMF. Between 2007 and 2017, “gold as a unit of account” warranted a 21% increase in its price.
Gold’s third role is as a hedge against inflation and what we term “political disaster” risk. We subtract the 21% estimated compensation for actual inflation from the 33% “gross” inflation risk hedge to derive an apparent 12% increase in the gold price that reflected the true risk premium to hedge against possible future inflation. However, between 2007 and 2017 the price of gold actually increased by 81%. This implies that 48% of this (81% less 21% less 12%) represented a premium for some other type of uncertainty at the end of 2017. The interesting question is the nature of the uncertainty for which gold is believed by some investors to be a superior hedge than traditional ports in a storm like short-term US government securities, or similar securities issued by other developed countries.
The logical inference is that the uncertainty in question must reflect a situation in which short term US Treasuries would be a less effective hedge than gold. This could be a world of widespread hyperinflation, capital controls, and/or radical changes in nations’ governments (of course, this would also imply a preference for investing in gold coins rather than bullion, as while the latter may be a store of value, it is far less convenient as a means of paying for transactions).
To put this in further perspective, this gold price “disaster risk” premium sharply increased from 2008 to 2012, then declined before sharply increasing again after 2016. Arguably, a significant part of the former increase reflects concerns about the potential inflationary consequences of dramatic quantitative easing by central banks. But this is not likely to be the case after 2016.