The Index Investor
May 2019
Key Takeaways
Many asset classes remain significantly overvalued. Timber and foreign developed market equities are exceptions.
Most market stress indicators remain weak. Asset class return indicators imply that aggregate expectations favor a return to the Normal Regime. We believe this conventional wisdom is wrong.
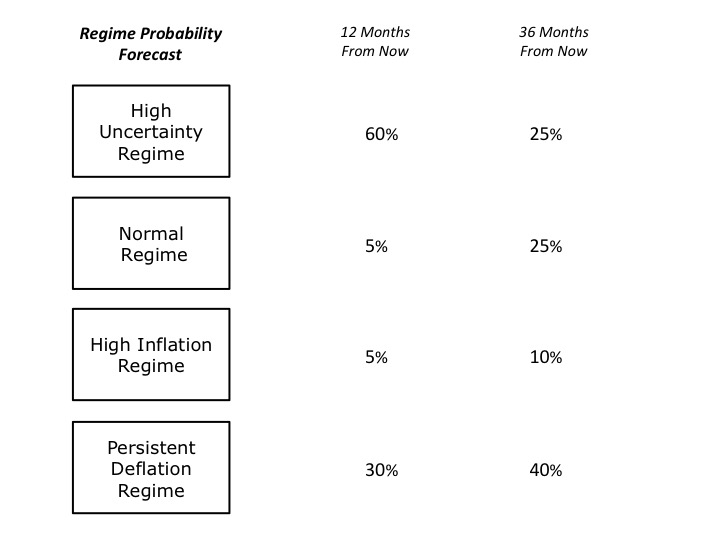
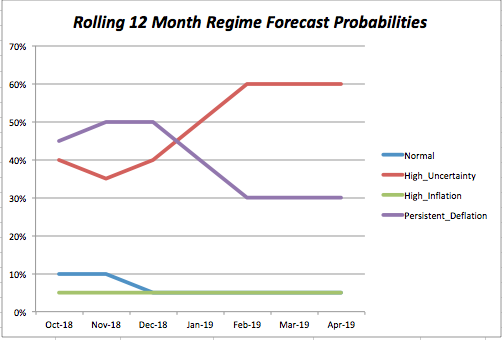
We have not changed our estimated probability that 12 months from now the macro system will still be in the High Uncertainty Regime (60%) or the Deflation Regime (30%). At a 36-month horizon, the regime probabilities are Deflation (40%), High Uncertainty (25%), Normal Regime (25%) and High Inflation Regime (10%).
It is critical to remember that the negative economic impact of high uncertainty only occurs with a lag. Moreover, high uncertainty also promotes higher conformity and more social copying, and thus a reduction of the number of narratives underlying people’s views. In sum, we believe the macro system today is highly fragile and primed for a large downside move, which will likely trigger a negative feedback loop that will cause uncertainty to increase even more.
Asset Class Valuation and Momentum Indicators (@30April19)
| Asset Class (ETF) | Valuation | 1 Month Return | Conclusion |
| US Real Return Govt Bond (TIP) | Likely Overvalued* | 0.22% | Increasing Overvaluation |
| US Nom Return Govt Bond (GOVT) | Likely Overvalued* | (0.41%) | Decreasing Overvaluation |
| US Investment Grade Credit (LQD) | Close to Fairly Valued* | 0.44% | Close to Fairly Valued |
| US High Yield Credit (HYG) | Very Likely Overvalued* | 0.98% | Increasing Overvaluation |
| US Commercial Property (VNQ) | Likely Undervalued* | (0.16%) | Increasing Undervaluation |
| US Equity (VTI) | Likely Overvalued* | 3.93% | Increasing Overvaluation |
| Foreign Developed Mkt Equity (VEA) | Likely Undervalued* | 2.84% | Decreasing Undervaluation |
| Emerging Markets Equity (VWO) | Almost Certainly Overvalued* | 2.14% | Increasing Overvaluation |
| Timber (WY) | Very Likely Undervalued* | 1.75% | Decreasing Undervaluation |
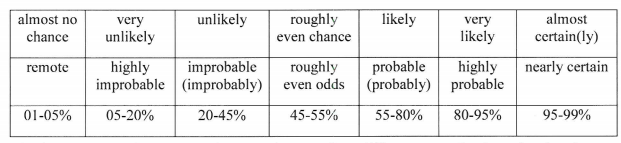
Note: The language we use to describe our estimated likelihood of asset class over or undervaluation is based on US Intelligence Community Directive 203 on Analytic Standards, which includes the following table:
Market Stress Indicators (@30Apr19)
| Market Stress Indicator | This Month vs Last Month |
| Asset Class Returns Autocorrelation (this month versus last month). Higher autocorrelation is an indicator of higher market stress. | .20 vs (.26) vs last month. Indicates a low level of market stress. |
| Economic Policy Uncertainty Index (how many days over the last 30 was index in top quartile of values since 1985?) | On 1 day the index was in the top quartile of daily values since 1984 (the 7th percentile of all rolling 30 day counts). |
| AAA Rated Bonds Spread over 10 Year Treasury Yield (month end). Higher spreads indicate rising concern about market liquidity. | 1.20% (48th percentile since 1983) vs 1.21% last month |
| BB Rated Bonds Spread over 10 Year Treasury Yield (month end). High spreads indicate increasing credit risk. | 2.26% (16th percentile since 1996), down from 2.39% last month). |
| Gold Price per Ounce in US Dollars (month end). Rising gold prices are an indicator of increasing market uncertainty and stress. | $1,285 vs.$1,191 last month. Down (0.46%). |
Market Stress Indicators: Forecast Discussion
We view financial markets as a complex adaptive system. The size of changes generated by such a system follows a power law rather than a normal (Gaussian) distribution. The critical point is that large changes are much more common in complex adaptive systems than most people’s intuition leads them to believe.
While predicting the behavior of complex adaptive systems remains far more art than a science, various researchers have found that large changes in such systems are often preceded by subtle warning signs, as stress accumulates within them. While this research is not definitive, we believe that five warning signs are worth monitoring as potential indicators of growing stress within financial markets that could suddenly give rise to large changes in asset class valuations.
Our first indicator is the month-to-month autocorrelation of broad asset class returns (i.e., the relationship of this month’s returns to last month’s). A system under increasing stress loses resiliency, causing it to take longer to recover from perturbations; hence, autocorrelation increases as it approaches a critical transition (see, “Early Warning Signals for Critical Transitions” by Scheffer, et al).
The one-month autocorrelation of returns for the broad asset classes we monitor was low in April as it was in March. This indicates that financial markets remained less ordered, and thus potentially further away from a critical transition point (which would most likely be accompanied by sudden and substantial changes in asset class values) than they were last month.
The second market stress indicator we monitor is the Economic Policy Uncertainty Index published by the Federal Reserve Bank of St. Louis (via its FRED economic database), which is based on research by Baker, Bloom, and Davis (see their paper, “Measuring Economic Policy Uncertainty”). The index is based on automated text analysis of leading newspapers and magazine publications, to identify the frequency with which words and phrases are used that indicate uncertainty.
In humans’ evolutionary past, when uncertainty increased the probability of survival was enhanced by staying close to a group. All of us still have that instinct. Research has found that as uncertainty increases, we have an unconscious bias towards higher conformity of our own views with those of a larger group (i.e., reduction in cognitive diversity). Behaviorally, heightened uncertainty induces more “social copying” of others, likely due to both conformity bias and the rational belief that others may be acting on the basis of superior information. This increase in conformity and copying makes a social system more ordered as uncertainty increases, and also reduces its responsiveness to perturbations (i.e., increases autocorrelation) because of delays in the social copying process.
The key point is that increasing uncertainty induces more, not less order in social systems, and in so doing primes them for sudden non-linear change.
Based on our continued research into the insights this index can provide, in 2019 we are focusing on the number of days, in the previous 30 days, that this index was in the top quartile of all values since the index series begins at the start of 1985. We then compare this statistic to the full set of rolling 30-day periods, and calculate its percentile at the end of the most recent month. At the end of April, our rolling 30 day count of top quartile values was in the 7th percentile – a significant drop from last month, which indicates the macro system is still not strongly primed for sudden, non-linear change.
Our third market stress indicator is the spread between the yield on AAA rated bonds and the 10-year US Treasury. This is a proxy for the level of investor concern about financial system funding liquidity. At the end of April 2019, this spread stood at 1.20%, (the 47th percentile since the series began in 1983), unchanged from last month. That said, in April of 2018 this spread was 1.00% - from this perspective, market liquidity stress has slowly but significantly increased over the past year.
Our fourth market stress indicator is the yield spread between speculative BB rated bonds and the ten-year US Treasury. Throughout history, excessive credit growth has been a root cause of many financial crises. An indicator of such growth is falling credit spreads, particularly in the case of riskier borrowers. In contrast, rising BB spreads indicate growing investor concern about the consequences of such growth, and the financial distress lower rated companies could experience in an economic downturn. At the end of April 2019, this spread was 2.26% (16th percentile since the series began in 1996), down from from 2.39% last month. This is a very low level for this late in what is already an exceptionally long period without a serious economic downturn, and where qualitative warning signs of danger ahead abound (see both this months Evidence file, and the cumulative Evidence file on our website). As such, the currently low BB spread likely indicates the further buildup of hidden stresses in credit markets.
Our fifth market stress indicator is what we term the “political risk premium” that is implicit in the price of gold. Our starting point for estimating this premium is the three different roles that gold plays. First, gold is a store of value in a world of fiat currencies. When the rate of money supply growth exceeds the growth of nominal GDP, gold’s price should increase to maintain its purchasing power. Between 2007 and 2017, the US money supply (M2) grew by about 86%, while nominal US GDP grew by 35%. The stock of gold grew by 18%, based on mine production over this period. We therefore infer that 33% of the increase in the price of gold represented the maximum potential gold price change that could be attributed to a desire to hedge inflation risk (86% less 35% less 18%).
Second, gold is a unit of account. We take this to mean that the annual change in GDP expressed in terms of physical gold (i.e., nominal GDP divided by the price of gold) should equal the change in real GDP calculated using the GDP price deflator to account for actual inflation over the period. A key challenge is the point at which to start this calculation.
We chose the price of gold in 1995/1996. In that period, the change in real global GDP measured using the IMF’s price deflator just about equaled the change in GDP measured in terms of physical gold. We interpret that coincidence as indicating that at that point in time, concerns about future inflation and political risk were minimal, and the change in the price of gold was mostly driven by its role as a unit of account. We calculated a subsequent series of gold prices that would produce the same change in “gold GDP” as the actual real GDP as calculated by the IMF. Between 2007 and 2017, “gold as a unit of account” warranted a 21% increase in its price.
Gold’s third role is as a hedge against inflation and what we term “political disaster” risk. We subtract the 21% estimated compensation for actual inflation from the 33% “gross” inflation risk hedge to derive an apparent 12% increase in the gold price that reflected the true risk premium to hedge against possible future inflation. However, between 2007 and 2017 the price of gold actually increased by 81%. This implies that 48% of this (81% less 21% less 12%) represented a premium for some other type of uncertainty at the end of 2017. The interesting question is the nature of the uncertainty for which gold is believed by some investors to be a superior hedge than traditional ports in a storm like short-term US government securities, or similar securities issued by other developed countries.
The logical inference is that the uncertainty in question must reflect a situation in which short term US Treasuries would be a less effective hedge than gold. This could be a world of widespread hyperinflation, capital controls, and/or radical changes in nations’ governments (of course, this would also imply a preference for investing in gold coins rather than bullion, as while the latter may be a store of value, it is far less convenient as a means of paying for transactions).
To put this in further perspective, this gold price “disaster risk” premium sharply increased from 2008 to 2012, then declined before sharply increasing again after 2016. Arguably, a significant part of the former increase reflects concerns about the potential inflationary consequences of dramatic quantitative easing by central banks. But this is not likely to be the case after 2016.
Over the last month, the price of gold fell by (0.46%). Since the end of 2017, it is now down by (0.86%). Therefore, on a rough approximation, the political uncertainty premium at the end of February 2019 stood at about 48% (48% - .86%) compared to a low of about 39% at the end of August 2018. On balance, this is another indication of falling market stress.
This is a very low level for this late in what is already an exceptionally long period without a serious economic downturn, and where qualitative warning signs of danger ahead abound (see both this months Evidence file, and the cumulative Evidence file on our website). As such, the currently low BB spread likely indicates the further buildup of hidden stresses in credit markets.
Macro Regime Forecast and Implications for Asset Class Values
Macro Regime Probabilities: Forecast Discussion
In response to subscriber requests, we are adding a 36 month regime forecast to our existing 12 month forecast. The logic is that, in a complex evolving system like global macro, a longer forecast horizon gets beyond the “detection range” of algorithmic forecasting approaches, and therefore raises probability that a manager/investor can gain an edge in identifying emerging threats and opportunities.
That said, because evolving (i.e., “non-stationary”) complex systems populated by highly connected human agents are also capable of sudden non-linear changes (with which are hard for algorithmic approaches to predict), we are also keeping our 12 month forecast.
This is consistent with what is perhaps the wisest insight I’ve come across in 40 years of forecasting -- this quote by the late economist Rudi Dornbusich: “Crises take a much longer time coming than you think, then happen much faster than you would have thought.”
12 Month Forecast
While there were certainly new pieces of high value information this month (as you can see later in this report), their cumulative weight was not sufficient to cause a change in our 12 month regime probabilities.
There were more indications that the global economy’s three demand motors (the US, EU, and China) are simultaneously weakening, which is a distinctly negative sign that could, given high debt levels, lead us into the deflation regime. However, as discussed in previous issues, housing has a heavy weight in the US CPI, and we have yet to see significant softening of prices in this sector; if uncertainty remains high, and GDP continues to weaken we almost certainly will. But we’re not there yet.
On the political front, the evidence continues to mount that the Democratic Party will struggle to avoid divisive (and very visible) internal battles in its presidential nomination process. At the same time, there is growing evidence (e.g., in the research of professor Lilliana Mason) that the growing alignment between political party identity and multiple other sources of identity (e.g., racial, economic, education, religious, regional, and ideological) has made party members increasingly intolerant of each other, and thus less likely to switch their vote due to leadership failures (e.g., Donald Trump’s behavior) or policy changes (e.g., the reversal of historical Democratic and Republican positions on immigration). This raises the probability that Donald Trump could be reelected in 2020, which would likely extend the current period of high uncertainty.
With respect to the high inflation regime, rising tensions between the United States and Iran could lead to armed conflict and attempt to block the Strait of Hormuz, which would sharply raise oil prices. A prolonged rise could, as in the past, give a strong boost to inflation while also reducing economic growth. However, given the dependence of China on oil from the Gulf, and the redeployment of more US military assets to the region, not to mention increased domestic oil production in the United States and the conflict between the Iran and the Sunni regimes in the Middle East, it seems unlikely that an oil price rise would be sustained long enough to substantially increase inflation.
36 Month Forecast
There are, however, two other new examples of the type of supply side shock that could cause a sustained increase in inflation. The first is the worsening of the Ebola hemorrhagic fever outbreak in the Democratic Republic of the Congo, which has a case fatality rate of over 60%. Attempts to control the outbreak are being limited by growing violence and the breakdown of public order that is putting medical personnel at increasing risk. The second example is the rapid increase of hemorrhagic African Swine Fever in China, that has killed or forced the culling of a substantial part of the world’s largest population of pigs, and a concomitant sharp rise in global pork prices. While these are both localized outbreaks (though the Swine Fever one has more potential to spread), they remind us of the range of potential supply side shocks that could lead to sustained higher inflation.
With respect to the Deflation Regime, the new Strategic Analysis from the Levy Economics Institute (see this month’s Evidence File) soberly reiterates that, “for better or worse, the structural problems in the US economy – with some important exceptions -- have not changed significantly over the last two-and-a-half decades.” They include, “(1) weak net export demand [with the exception of the balance on petroleum and gas trade]; (2) fiscal conservatism; (3) increasing income inequality; and (4) financial fragility…Importantly, the situation on most of these fronts is getting worse.”
Elsewhere, the IMF’s latest Global Financial Stability Review was the latest analysis to highlight the dangers posed by the global economy’s high debt levels. Astute commentators like William White (former chief economist at the Bank for International Settlements) suggest that a substantial amount of this debt is effectively unserviceable in a low growth economy (caused by declining demographics and low productivity). As such, provisions should be made for orderly debt reductions (e.g., via write-offs or debt/equity conversions). However, this seems unlikely given current levels of political polarization not to mention the extreme litigiousness of some of the funds that hold the riskiest debt. This raises the probability of an extended period of debt deflation in the case of a severe and prolonged economic downturn (which itself seems likely, given monetary policy stuck at the zero lower bound for interest rates, and fiscal policy hamstrung by political conflict).
The argument that we will have returned to the Normal Regime 36 months hence rests, in our view, of two non-exclusive possibilities. The first is a worsening of the conflict between the United States and China, possibly accompanied by more aggressive actions by Russia and Iran. The realization that the West faces a new and dangerous external threat that is likely to persist for years could lead to and improved domestic political consensus that would make it possible to address the fundamental structural issues that have increasingly hobbled Western economies and politics. The second possibility is that the Democratic Party in the United States avoids what Barack Obama memorably called the “risk of a circular firing squad” and elects a president on the basis of a policy platform that garners the support of the “moderate middle” whose votes increasingly seem to depend on the balance of fear and revulsion they feel towards both parties’ extremes.
Forecast Methodology
Our analysis focuses on four possible macro regimes: (1) Normal Times, where equity asset classes perform well; (2) a High Uncertainty regime that is usually short and transitory, where asset classes like short-term government bonds perform best and equities suffer significant declines; (3) High Inflation (which we deem 5% or more, year-on-year), where commercial property, real return bonds and other traditional hedges are favored; and (4) Persistent Deflation (a year-on-year decline in the US CPI), which up to now has only been seen in Japan, and in which the relative performance of different asset classes remains uncertain, but will likely favor high quality bonds and the consumer staples equity sector.
Our forecasting methodology is derived from our experience on the Good Judgment Project, as described in the book, “Superforecasting” by Gardner and Tetlock, as well as a range of other sources, from the intelligence community to systems dynamics and complex adaptive systems to statistics and political economy.
We start with base rate/reference case data about the historical probability of large changes in equity and bond valuations. We then analyze the current situation from both a quantitative and qualitative perspective. In the latter, we focus on the key endogenous drivers of macro regime change, including technological, economic, national security, social, and political trends and uncertainties. We also focus on three potential sources of exogenous shocks that could also produce a macro regime change, caused by environmental, disease, and cyber related events.
While most of our attention typically focuses on various flows (e.g., economic growth, change in the price level, sales, earnings, job creation, etc.), endogenously caused regime changes result when those flows push key stocks beyond a critical threshold or tipping point, often setting off non-linear reactions across multiple areas. As noted by Hyman Minsky and others, a classic example is the steady accumulation of outstanding debt until it reaches the point where it can no longer be serviced and triggers a crisis.
Base Rate Data
Since the end of World War Two, there have been fifteen months where a downturn in the US equity market began that eventually reduced asset class value by 20% of more. That is a hazard rate of about 1.75% per month. Put differently, in any given month there is a 98.25% probability that a 20%+ downturn won’t occur, or, in a given year, an 81% probability.
However, as the time without a 20%+ downturn extends, the compound probability that one will not occur shrinks. At the end of August 2018, it is more than nine years since the last equity market decline of 20% or more. The probability of that happening is only 15%.
To estimate the base rate for a 20% fall in bond prices (which historically has been caused by a sharp increase in inflation, as we saw in the late 1970s and early 1980s), we analyzed monthly historical AAA bond yields since 1919. For consistency, we used them to calculate the price of a ten-year zero coupon bond. We then calculated the probability of a price decline of 20% or more over three different holding periods: 12, 18, and 24 months. In any month, the annualized probability of a decline of 20% or more over the subsequent 12 months is 12%; over 18 months, 20%, and over 24 months, 25%.
The Current State of Quantitative Regime Predictors
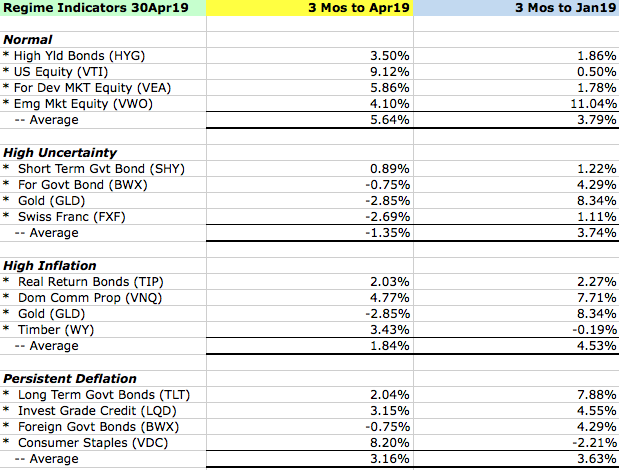
Our quantitative methodology focuses on the level and change in three-month returns, over the most recent and previous three-month periods, for those asset classes which should perform best under different regimes.
As you can see in the following table, based on three month returns to the end of last month, this analysis indicates that the balance of expectations across all four regimes was in rough balance, which we consider to be another indication of high underlying uncertainty.
That said, comparing the change between the two three month periods, positive momentum is strongest for both the Normal and the High Inflation Regimes.
Like Professors Andrew Lo, Doyne Farmer and others, we regard financial markets as a complex adaptive system (CAS), that exist as part of a larger macro system comprised of other CAS between which there are multiple feedback loops. These other systems include those that produce technology innovations, and economic, environmental, national security (including cyber), social, demographic, and political outcomes.
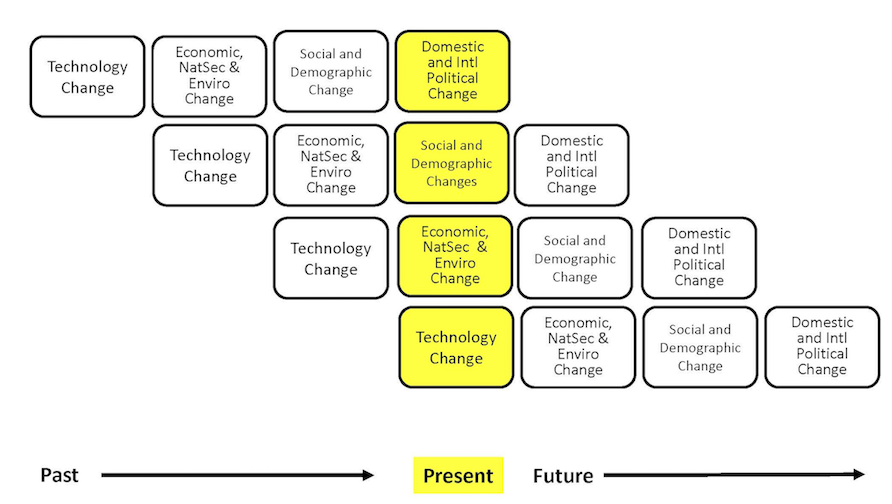
We also find that these systems tend to operate and generate effects in a rough chronological sequence, albeit with many feedback loops between them. The following chart highlights that the changes we observe in different areas at any point in time are actually part of a much more complex evolutionary process.
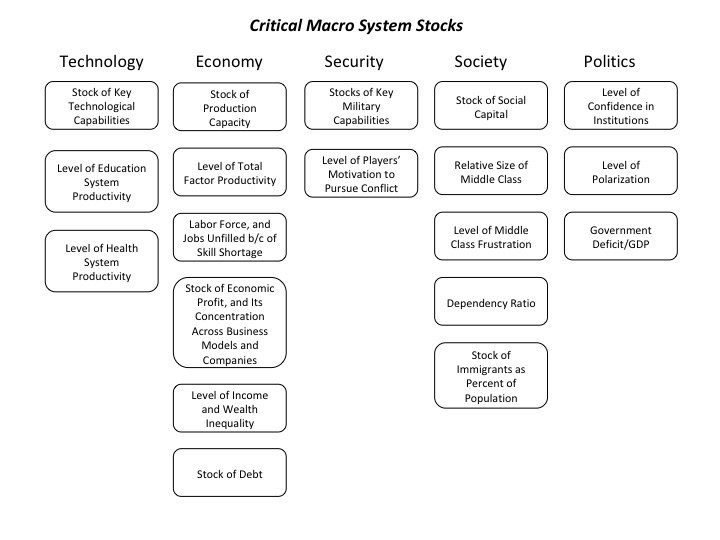
While most media coverage of these systems focused on flows (e.g., the size of the government deficit), rapid non-linear change in complex adaptive systems is often caused by a key stock (e.g., the amount of outstanding government debt) exceeding a critical threshold.
The next table highlights the key macro system stocks that we monitor.
In the next section, we will discuss information received over the past month that is related to these stocks, and which we believe is significant to our assessment of the probabilities that a critical threshold will be reached and a regime change will occur. We will conclude with our estimate, at the end of this month, of how close the macro system is to these critical thresholds, and the implications for financial market regime change probabilities.
In our methodology, we classify new information as significant and highly valuable if either it (1) is an “indicator”, which reduces or increases our uncertainty about the value of a parameter in our mental model for making sense of the dynamic macro system, or (2) it is a “surprise” which increases our uncertainty about, and causes us to revaluate the structure of our mental model.
| New Technology Information: Indicators and Surprises | Why Is This Information Valuable? |
| “Challenges of Real-World Reinforcement Learning”, by Dulac-Arnold et al | SURPRISE This paper is a timely reminder of the current limitations of this critical AI method when it applied to the complex, evolving problems that we frequently confront. “Reinforcement learning (RL) has proven its worth in a series of artificial domains, and is beginning to show some successes in real-world scenarios. However, much of the research advances in RL are often hard to leverage in real world systems due to a series of assumptions that are rarely satisfied in practice. “We present a set of nine unique challenges that must be addressed to ‘productionize’ RL to real world problems. At a high level, these challenges are: (1) Training off-line from the fixed logs of an external behavior policy. (2) Learning on the real system from limited samples. (3) High-dimensional continuous state and action spaces. (4) Safety constraints that should never or at least rarely be violated. (5) Tasks that may be partially observable, alternatively viewed as non-stationary or stochastic. (6) Reward functions that are unspecified, multi-objective, or risk-sensitive. (7) System operators who desire explainable policies and actions. (8) Inference that must happen in real-time at the control frequency of the system. (9) Large and/or unknown delays in the system actuators, sensors, or rewards. “While there has been research focusing on these challenges individually, there has been little research on algorithms that address all of these challenges together…An approach that does this would be applicable to a large number of real world problems.” |
| “Survey on Automated Machine Learning”, by Zoller and Huber | Like the paper above, this is another important indicator of the type of obstacles that will need to be overcome in order to speed the deployment of artificial intelligence applications. “Machine learning has become a vital part in many aspects of our daily life. However, building well performing machine learning applications requires highly specialized data scientists and domain experts. Automated machine learning (AutoML) aims to reduce the demand for data scientists by enabling domain experts to automatically build machine learning applications without extensive knowledge of statistics and machine learning. In this survey, we summarize the recent developments in academy and industry regarding AutoML.” |
| “Key Design Components and Considerations for Establishing a Single Payer Healthcare System”, by the US Congressional Budget Office | This is an excellent and brief summary of the key issues involved in establishing a more comprehensive single payer healthcare system in the United States. |
| “Prices Paid to Hospitals by Private Health Plans are High Relative to Medicare [Prices] and Vary Widely” by White and Whaley from RAND | SURPRISE The US healthcare system is characterized by multiple prices being charged by healthcare suppliers depending on who is paying. The lowest prices are for beneficiaries of the federal Medicare system for senior citizens; the highest are for uninsured individuals. Based on a sample of hospital prices charged in 25 states, this new report from RAND finds that in some states, charges to private health insurance payers are more than 300% higher than those charged to Medicare. This translates into higher insurance premiums for employers and reduced take-home pay for employees as their benefits costs increase. The authors conclude that the potential for cost savings from a “single price” system are, frankly, enormous. Whether moving to a single payer system would be required to move to a single price system is an uncertainty, as it is not clear that private health insurance payers and employer who purchase such insurance have enough power to bring about this change on their own. |
| “After 20 Years of Reform, Are America’s Schools Better Off?”, by Hess and Martin | In the short-term, lack of improvement in US education results will slow the deployment of AI and automation technologies; in the medium and long-term, however, it will speed many companies’ transition to “labor-lite” business models (e.g., based on AutoML technology noted above). This will likely worsen inequality and political conflict, increase social safety net spending, and lead to much higher taxes to fund it. “On the whole, it’s certainly possible to find some evidence of improvement — but progress is easiest to find in the metrics most amenable to manipulation…the U.S. also regularly administers the National Assessment of Educational Progress (NAEP) to a random, nationally representative set of schools. Because the NAEP isn’t linked to state accountability systems, it’s a good way to check the seemingly positive results of state tests. “From 2000 to 2017 (the most recent year for which data is available), NAEP scores showed that fourth-grade math results increased 14 points, which reflects a bit more than one year of extra learning. Eighth-grade math results also demonstrated significant improvement, increasing ten points in the same period. Fourth- and eighth-grade reading scores, meanwhile, barely budged. And almost all of the math gains were made in the decade from 2000 to 2010; performance has pretty much flatlined since then… “The Programme for International Student Assessment (PISA) is the only major international assessment of both reading and math performance. While PISA has its share of limitations, it offers a wholly independent view of American education and accountability systems. From the time PISA was first administered in 2000 to the most recent results from 2015, U.S. scores have actually declined, while America’s international ranking has remained largely static…there has been a lot of action, but not much in the way of demonstrated improvement. Just why this is the case remains an open question.” See also, “Why American Students Haven’t Gotten Better at Reading in 20 Years”, by Natalie Wexler in The Atlantic, and “US Achievement Gaps Hold Steady in the Face of Substantial Policy Initiatives” by Hanushek et al |
| “Predicting Success in the Worldwide Start-Up Network”, by Nonaventura et al | This paper highlights the increasing ability of advanced AI techniques (combined, in this case, with social network analysis methods) to either automate or augment cognitively complex activities, while also improving predictive performance. The speed and breadth at which these emerging technologies will be deployed remains highly uncertain; however, this paper, and others like it, provide an indication of what lies ahead. “By drawing on large-scale online data we construct and analyze the time varying worldwide network of professional relationships among start-ups. The nodes of this network represent companies, while the links model the flow of employees and the associated transfer of know-how across companies. We use network centrality measures to assess, at an early stage, the likelihood of the long-term positive performance of a start-up, showing that the start-up network has predictive power and provides valuable recommendations doubling the current state of the art performance of venture funds. Our network-based approach not only offers an effective alternative to the labour-intensive screening processes of venture capital firms, but can also enable entrepreneurs and policy-makers to conduct a more objective assessment of the long-term potentials of innovation ecosystems and to target interventions accordingly.” |
| | |
| | |
| | |
| | |
| | |
| | |
| | |
| New Economic Information: Indicators and Surprises | Why Is This Information Valuable? |
| “Can Redistribution Help Build a More Stable Economy?” by Papadimitrious et al from the Levy Economics Institute | For years, I've been a big fan of the Levy Economic Institute’s annual Strategic Analyses of the US economy, and the consistent stock/flow model upon which it is based. Their latest analysis, as usual, packed with insights, and well worth a read. They note that, “For better or worse, the structural problems in the US economy – with some important exceptions -- have not changed significantly over the last two-and-a-half decades.” They include “(1) weak net export demand; (2) fiscal conservatism; (3) increasing income inequality; and (4) financial fragility… Importantly, the situation on most of these fronts is getting worse.” The authors conclude that, “for a robust and sustainable economic future, the US economy requires deep structural reforms that deal with the aforementioned problems. There is no single policy that can achieve this.” |
| In April, the IMF released its biannual World Economic Update and Global Financial Stability Report | The WEO noted that the global expansion was “losing steam” in the face of “high policy uncertainty”, and that “global risks are skewed to the downside.” The deceleration of growth in the Euro area was particularly surprising. The WEO also concluded that, “Sustained excess external imbalances in the world’s key economies and policy actions that threaten to widen such imbalances pose risks to global stability…Over the medium term, widening debtor positions in key economies could constrain global growth and possibly result in sharp and disruptive currency and asset price adjustments.” The subtitle of the GFSR echoed the WEO’s warning: “Vulnerabilities in a Maturing Credit Cycle.” More specifically, “As the credit cycle matures, corporate sector vulnerabilities—which appear elevated in about 70 percent of systemically important countries (by GDP)— could amplify an economic downturn…” More specifically, as I’ve seen time and again over a 40 year career that has spanned multiple debt crises, high leverage (financial, operating, or both) makes companies much quicker to start layoffs when a business cycle turns down. And at a time when uncertainty about technology’s impact on future employment is already sky high, high debt levels have set the stage for a non-linear negative reaction when the downturn arrives. |
| “The Return of the Policy That Shall Not Be Named: Principles of Industrial Policy” by Cherif and Hasanov of the IMF | This is an excellent overview of industrial policy, and provides insightful comparisons between the policies pursued by fast developing Asian countries and other nations that have grown more slowly. The authors conclude that “true industrial policy” amounts to “Trade and Innovation Policy” or “TIP”… Innovation-driven growth is key to sustaining productivity gains and achieving high-income status.” TIP focuses on “(i) the support of domestic producers in sophisticated industries, beyond the initial comparative advantage; (ii) export orientation; and (iii) the pursuit of fierce competition with strict accountability”… The state has to set the level of ambition of its goal, and then implement the right policies while imposing accountability and being able to adapt fast as conditions change—Ambition, Accountability, and Adaptability (AAA), or a triple A, of the “leading hand of the state”… Trade and Innovation Policy has been applied with different degrees of intensity, and therefore success. The authors observe that, “The strategy of the Asian miracles’ industrial policy/state intervention can be summed up as follows: (1) Intervene to create new capabilities in sophisticated industries: Pursue policies to steer the factors of production into technologically sophisticated tradable industries beyond the current capabilities to swiftly catch up with the technological frontier. (2) Export, export, export: A focus on export orientation as any new industrial product was expected to be exported right away with the use of market signals from the export market as a feedback for accountability. As conditions changed, both the state and the firms adapted fast. (3) Cutthroat competition (at home and abroad) and strict accountability: No support was given unconditionally although performance assessment was not necessarily based on short-term profits. While specific industries may get support, intense competition among domestic firms was highly encouraged in domestic and international markets.” |
| Citicorp Briefing on Modern Monetary Theory, by Buiter and Mann | The authors conclude that the case for MMT (more specifically, having the central bank monetize debt issued to finance government deficits) is strongest when monetary policy is at the zero lower bound and private sector demand is weak and contracting. At all other times, large government deficits financed by central bank debt monetization run the risk of substantially increasing inflation. |
| “Lost in Deflation: Why Italy’s Woes are a Warning to the Whole Eurozone” by Servaas Storm of the Oxford Institute for New Economic Thinking | SURPISE Lest you think the IMF paper on Industrial Policy is just the theoretical musings of academics economists, this paper focuses on a very practical example that has been much in the news of late: Italy. The author notes, “Lacking political voice, about the only thing the ‘left behinds’ can do is to “send in a wrecking ball to disrupt the system”1—which means voting against the establishment and “having more of the same”, even if it is less clear what exactly one is voting for. ‘Brexit’ and Trump are clear manifestations of such anti-establishment anger, and similar sentiments are building up elsewhere as well. In Italy, the third largest economy of the Eurozone, the ‘wrecking ball’ came in the form of the anti-establishment, anti-euro and anti-austerity ‘government of change’, as the League‒Five Star Movement coalition prefers to call itself. The two coalition parties surfed a wave of discontent2 with roots deep in Italy’s economic crisis, the origins of which go back almost three decades and the symptoms of which are manifold: a secular stagnation of productivity growth; stagnant real wages, high (youth) unemployment and stalling incomes; a sustained loss of international competitiveness; a crumbling infrastructure suffering from chronic under-investment; a manufacturing industry, made up of mostly small- and medium-scale enterprises, prone to offshoring; and a government and banking system crippled by debts. Promising drastic changes away from austerity and a fundamental break with discredited establishment politics, the Five Star Movement (M5S) and the League (Lega) garnered the votes of more than 16 million of mostly working-class and middle-class people—an increase of six million voters compared to Italy’s 2013 general elections and about 50% of all votes in 2018…” “Using macroeconomic data for 1960-2018, this paper analyzes the origins of the crisis of the ‘post-Maastricht Treaty order of Italian capitalism’. After 1992, Italy did more than most other Eurozone members to satisfy EMU conditions in terms of self-imposed fiscal consolidation, structural reform and real wage restraint—and the country was undeniably successful in bringing down inflation, moderating wages, running primary fiscal surpluses, reducing unemployment and raising the profit share. But its adherence to the EMU rulebook asphyxiated Italy’s domestic demand and exports—and resulted not just in economic stagnation and a generalized productivity slowdown, but in relative and absolute decline in many major dimensions of economic activity. Italy’s chronic shortage of demand has clear sources: (a) perpetual fiscal austerity; (b) permanent real wage restraint; and (c) a lack of technological competitiveness which, in combination with an overvalued euro, weakens the ability of Italian firms to maintain their global market shares in the face of increasing competition of low-wage countries. These three causes lower capacity utilization, reduce firm profitability and hurt investment, innovation and diversification. The EMU rulebook thus locks the Italian economy into economic decline and impoverishment. The analysis points to the need to end austerity and devise public investment and industrial policies to improve Italy’s ‘technological competitiveness’ and stop the structural divergence between the Italian economy and France / Germany. The issue is not just to revive demand in the short run (which is easy), but to create a self-reinforcing process of investment-led and innovation-driven process of long-run growth (which is difficult).” |
| “What Happened to US Business Dynamism?” by Akcigit and Ates | SURPRISE This paper explores one aspect of the widening divide between the top tier companies in many industries and all the others. Research has shown that this is a key contributor to worsening inequality. One theory is that the faster adoption of advanced technology by leading firms and its slower adoption by others is due to the former’s ability to recruit and retain the limited number of highly talented graduates of our education system. This paper focuses on these firms’ aggressive use of patents to prevent the diffusion of advanced technology to others. “In the past several decades, the U.S. economy has witnessed a number of striking trends that indicate a rising market concentration and a slowdown in business dynamism. In this paper, we make an attempt to understand potential common forces behind these empirical regularities through the lens of a micro-founded general equilibrium model of endogenous firm dynamics. Importantly, the theoretical model captures the strategic behavior between competing firms, its effect on their innovation decisions, and the resulting “best versus the rest” dynamics. “We focus on multiple potential mechanisms that can potentially drive the observed changes and use the calibrated model to assess the relative importance of these channels…Our results highlight the dominant role of a decline in the intensity of knowledge diffusion from the frontier firms to the laggard ones in explaining the observed shifts. “We conclude by presenting new evidence that corroborates a declining knowledge diffusion in the economy. We document a higher concentration of patenting in the hands of firms with the largest stock and a changing nature of patents, especially in the post-2000 period, which suggests a heavy use of intellectual property protection by market leaders to limit the diffusion of knowledge. These findings present a potential avenue for future research on the drivers of declining knowledge diffusion.” |
| “Global Declining Competition” by Diez et al from the IMF | Like the previous paper, this analysis focuses on the changing dynamics of competition, and the changes in market power that have contributed to the stagnation of real wages for the middle class, and thus a worsening of inequality and a rise in social and political conflict in many Western nations. “Using a new firm-level dataset on private and listed firms from 20 countries, we document five stylized facts on market power in global markets. First, competition has declined around the world, measured as a moderate increase in average firm markups during 2000- 2015. Second, the markup increase is driven by already high-markup firms (top decile of the markup distribution) that charge increasing markups. Third, markups increased mostly among advanced economies but not in emerging markets. Fourth, there is a non-monotonic relation between firm size and markups that is first decreasing and then increasing. Finally, the increase is mostly driven by increases within incumbents and also by market share reallocation towards high-markup entrants.” The previous paper further supports findings from another paper published last year by Song et al from the Federal Reserve Bank of Minneapolis, “Firming Up Inequality”. The authors “use a massive, matched employer-employee database for the United States to analyze the contribution of firms to the rise in earnings inequality from 1978 to 2013. They find that, “one-third of the rise in the variance of earnings occurred within firms, whereas two-thirds of the rise occurred between firms. However, this rising between-firm variance is not accounted for by the firms themselves: the firm-related rise in the variance can be decomposed into two roughly equally important forces: a rise in the sorting of high-wage workers into high-wage firms and a rise in the segregation of similar workers between firms…” “Our main result is that the rise in the dispersion between firms in firm average earnings accounts for the majority of the increase in total earnings inequality.” |
| “Peak Profit Margins? A Global Perspective” by Jensen et al from Bridgewater Associates | SURPRISE In its February analysis of US profit margins, Bridgewater concluded that, “Over the last two decades, US corporate profit margins have surged and have contributed more than half of the excess return of equities relative to cash. Without that consistent expansion of margins, US equities would be 40% lower than they are today…Over the last few decades, almost every major driver of profit margins has improved. Labor’s bargaining power fell, corporate taxes fell, tariffs fell, globalization increased, technology allowed for greater scale and lower marginal costs, anti-trust enforcement fell, and interest rates fell. These factors have produced the most pro-corporate environment in history. Many of these drivers of high profit margins are now under threat.” In this latest report, the Bridgewater team expands its focus to global profit margins. The authors conclude that, “Corporations around the world simultaneously benefited from the broad-based decline in labor’s bargaining power, increased globalization, lower antitrust enforcement, technology allowing for greater scale and lower marginal costs, and lower corporate taxes, interest rates, and tariffs. These factors have produced the most pro-corporate environment in history globally, with the US benefiting the most… Looking ahead, some of the forces that have supported margins over the last 20 years are unlikely to provide a continued boost. Incentives for offshore production have been reduced as global labor costs have moved closer to equilibrium, with domestic costs and rising trade conflict increasing the risk from offshoring, while the potential tax rate arbitrage from moving abroad is now much smaller.” |
| US Senator (and presidential candidate) Elizabeth Warren proposed a program to forgive a substantial amount of US college student loan debt. This is the first salvo in what will likely become a much larger and more painful conversation about the inability of many economies to service the amount of debt they have taken on, given projections for slow demographic and productivity growth, and how unavoidable debt-relief will occur. | SURPRISE At the beginning of 2019, student loan debt stood at $1.6 trillion, having tripled since 2004, as household earnings stagnated and college costs rose at rates well above inflation. Numerous authors have claimed that this represents a significant drag on economic growth (e.g., “Student Loans are Beginning to Bite the Economy”, Bloomberg, 20Aug18 and “The Student Debt Crisis: Could It Slow the Economy? Knowledge at Wharton, 22Oct18), though others claim the effects are small. The most thorough analysis we have seen is “The Macroeconomic Effects of Student Debt Cancellation” by Fullwiler et al from the Levy Economics Institute. The authors conclude that “debt cancellation lifts GDP, decreases the average unemployment rate, and results in little inflationary pressure (all over the 10-year horizon of our simulations), while interest rates increase only modestly. Though the federal budget deficit does increase, state-level budget positions improve as a result of the stronger economy…[Moreover] Research suggests many other positive spillover effects that are not accounted for in these simulations, including increases in small business formation, degree attainment, and household formation, as well as improved access to credit and reduced household vulnerability to business cycle downturns. Thus, our results provide a conservative estimate of the macro effects of student debt liberation.” Warren’s proposal met with both support and opposition. However, it served the larger purpose of increasing public focus on the potential need for widespread debt forgiveness and restructuring, in a highly leveraged economy that is potentially facing, due to demographic and productivity factors, an extended period of low real growth. This is a point that has previously been made by William White, former Chief Economist at the Bank for International Settlements, who I have long regarded as one of the most astute observers of the global economy; for example, White was warning about the building negative pressures in the global economy and financial system long before the 2008 crisis exploded. This month, in a 9Apr19 interview with the Swiss publication “Finanz und Wirtschaft”, (“Central Banks are Biased Towards Loose Policy”), White reiterated his view that to avoid the next economic downturn triggering an uncontrolled debt deflation, policy makers need to plan for a more structured approach to debt reduction, noting that, “You must identify which debt is not serviceable and take steps to make sure that it is written off. The supervisors in the banking system have to force the banks to restructure as opposed to provide support to zombie firms. In the next recession, we should have a combination of fiscal stimulus and a credible longer term debt sustainability target and pay much greater attention to debt restructuring. But nobody likes to talk about this.” |
| The United States eliminated waivers that had enabled limited sales of Iranian oil to continue. | SURPRISE The reduction in Iranian oil supply, to say nothing of the heightened risk of violent conflict (which could include Iranian attempts to close the Strait of Hormuz to oil traffic, and/or attacks on Saudi oil facilities) runs the risk of triggering a sharp increase in world oil prices, which would reduce global demand, increase uncertainty, and likely trigger a worldwide recession. |
| Negotiations between China and the US took a turn for the worse in early May, leading to further increase in US tariffs on Chinese goods, and a promise to respond in kind by China. | This has further ratcheted up uncertainty (whose full impact will only be felt with a lag), which makes the global economy even more susceptible to a sharp downward break. |
| | |
| New National Security Information: Indicators and Surprises | Why Is This Information Valuable? |
| “The New Revolution in Military Affairs” by Christian Brose | SURPRISE A recurring pattern in the history of private and public sector organizations is the lag in their adoption of disruptive technologies, due to the time it takes to rethink strategy and doctrine to incorporation them, and then implement the new approach via changes in processes, systems, structure, staffing, and often culture. This creates a dynamic in which organization(s) – including companies and nations – can gain a significant (if temporary) competitive advantage by being the first to complete these changes. However, this often carries with it the seeds of later danger, as established advantages tend to blind an organization to the emergence of disruptive technologies and their adoption by others. This paper documents the same process at work in the US military, and in particular its intensifying Great Power competition with China. Brose notes, for more than 20 years now (since the term “Revolution in Military Affairs” or RMA first entered the language), “the basic idea has remained the same: emerging technologies will enable new battle networks of sensors and shooters to rapidly accelerate the process of detecting, targeting, and striking threats, what the military calls the “kill chain.” “The idea of a future military revolution became discredited amid nearly two decades of war after 2001 and has been further damaged by reductions in defense spending since 2011. But along the way, the United States has also squandered hundreds of billions of dollars trying to modernize in the wrong ways. Instead of thinking systematically about buying faster, more effective kill chains that could be built now, Washington poured money into newer versions of old military platforms and prayed for technological miracles to come (which often became acquisition debacles when those miracles did not materialize). “The result is that U.S. battle networks are not nearly as fast or effective as they have appeared while the United States has been fighting lesser opponents for almost three decades. Yet if ever there were a time to get serious about the coming revolution in military affairs, it is now. “There is an emerging consensus that the United States’ top defense-planning priority should be contending with great powers with advanced militaries, primarily China, and that new technologies, once intriguing but speculative, are now both real and essential to future military advantage. Senior military leaders and defense experts are also starting to agree, albeit belatedly, that when it comes to these threats, the United States is falling dangerously behind. This reality demands more than a revolution in technology; it requires a revolution in thinking. And that thinking must focus more on how the U.S. military fights than with what it fights. The problem is not insufficient spending on defense; it is that the U.S. military is being countered by rivals with superior strategies. The United States, in other words, is playing a losing game. The question, accordingly, is not how new technologies can improve the U.S. military’s ability to do what it already does but how they can enable it to operate in new ways. It is still possible for the United States to adapt and succeed, but the scale of change required is enormous. The traditional model of U.S. military power is being disrupted, the way Blockbuster’s business model was amid the rise of Amazon and Netflix. A military made up of small numbers of large, expensive, heavily manned, and hard-to replace systems will not survive on future battlefields, where swarms of intelligent machines will deliver violence at a greater volume and higher velocity than ever before. Success will require a different kind of military, one built around large numbers of small, inexpensive, expendable, and highly autonomous systems. The United States has the money, human capital, and technology to assemble that kind of military. The question is whether it has the imagination and the resolve.” For an argument that China will struggle to develop and implement disruptive military technologies, see, “Why China Has Not Caught Up Yet: Military- Technological Superiority and the Limits of Imitation, Reverse Engineering, and Cyber Espionage”, by Gilli and Gillin in International Security. See also, “America’s Nightmare” by Harry Kazianis in National Interest; “Piercing The Fog Of Peace: Developing Innovative Operational Concepts For A New Era” by Mahnken et al from CSBA; and “Forecasting Change in Military Technology, 2020-2040” by Michael O’Hanlon for a detailed discussion of potential technology developments, and his companion paper “A Retrospective on the Revolution in Military Affairs, 2000-2020” |
| “America’s Strategy-Resource Mismatch” by Bonds et al is a major new analysis from RAND | SURPRISE “The 2018 National Defense Strategy (NDS) identifies long-term, strategic competition with China and Russia as the central challenge to U.S. security and the principal priority for the U.S. Department of Defense (DoD). The NDS tasks DoD with simultaneously defending the homeland and deterring aggression in Europe, the Indo-Pacific, and the Middle East. The NDS also directs DoD to counter North Korea and Iran and defeat terrorist threats to the United States…Unfortunately, the NDS is not adequately supported by military forces, causing a strategy-resource gap… “Significant gaps exist in the ability of the United States and its allies to deter or defeat aggression that could threaten their national interests. NATO members Estonia, Latvia, and Lithuania remain vulnerable to a rapid Russian invasion. South Korea is vulnerable to a drawn out barrage from a relatively small percentage of North Korea’s artillery. China’s neighbors— especially Taiwan—are vulnerable to coercion and aggression. Finally, violent extremists continue to pose a threat in the Middle East, Afghanistan, and around the world. “Solutions to these problems will take both money and time. In the United States, the needed funds are limited today by the Budget Control Act and the competing imperatives to modernize nuclear and conventional forces.” The authors make recommendations for “discuss which missions should be prioritized and suggest changes to U.S. strategy and investments to best close these gaps” |
| Two other new reports from RAND, focused on Russia, must be seen in light of the above report | SURPRISE “Overextending and Unbalancing Russia”, evaluates low cost options for weakening Russian power through low cost means that exploit its many serious economic, social, and military vulnerabilities. “Deterring Russian Aggression in the Baltic States Through Resilience and Resistance” proposes a wide spectrum of deterrence, low and high intensity warfare options that would enable national governments, along with their NATO allies, to prevent a successful Russian takeover of Balkan territory, as occurred in the Crimea. |
| This month saw the publication of two new thought-provoking documents on China | As mandated by law, the US Defense Department published its annual “Chinese Military Power Report.” It summarized China’s strategy as follows: “China’s leaders have benefited from what they view as a “period of strategic opportunity” during the initial two decades of the 21st century to develop domestically and expand China’s “comprehensive national power.” “Over the coming decades, they are focused on realizing a powerful and prosperous China that is equipped with a “world-class” military, securing China’s status as a great power with the aim of emerging as the preeminent power in the Indo-Pacific region. In 2018, China continued harnessing an array of economic, foreign policy, and security tools to realize this vision… “China’s leaders employ tactics short of armed conflict to pursue China’s strategic objectives through activities calculated to fall below the threshold of provoking armed conflict with the United States, its allies and partners, or others in the Indo-Pacific region. These tactics are particularly evident in China’s pursuit of its territorial and maritime claims in the South and East China Seas as well as along its borders with India and Bhutan… “In support of the goal to establish a powerful and prosperous China, China’s leaders are committed to developing military power commensurate with that of a great power. Chinese military strategy documents highlight the requirement for a People’s Liberation Army (PLA) able to fight and win wars, deter potential adversaries, and secure Chinese national interests overseas, including a growing emphasis on the importance of the maritime and information domains, offensive air operations, long-distance mobility operations, and space and cyber operations… “China’s military modernization also targets capabilities with the potential to degrade core U.S. operational and technological advantages.” SURPRISE The second important publication was “The Sources of CCP Conduct”. Its author, US Congressman Mike Gallagher, has extensive experience in the intelligence community, as well as a PhD in International Relations. He notes that his title deliberately echoes George Kennan’s famous Long Telegram and anonymously published 1947 article on “The Sources of Soviet Conduct” that advocated a long-term policy of containment. Gallagher argues that “understanding the CCP is essential to understanding China’s external ambitions and why they cannot be reconciled with those of the free world.” He describes three fundamental sources of the CCP’s conduct: (1) “Chinese history – or, more precisely, two strongly held and CCP-perpetuated narratives about China’s history…The first narrative comes from Chinese dynastic history. Unlike Europe, where countries competed constantly for power, China enjoyed long periods without true rivals … Xi’s message is clear: It is time for the Americans to leave and for China to return to its Idealized traditional primacy over its Asian neighbor-vassals… The second narrative is that the greatest threat to China is weak central leadership that invites foreign aggression and corresponding national humiliation… (2) The second source of CCP conduct, and one habitually discounted by Westerners, is the Party’s own history as an underground influence organization. From its earliest days, the CCP has played the role of insurgent, first within China and then abroad as it has sought to expand its power. A central tool in this struggle has been “United Front” work, or “a range of methods to influence overseas Chinese communities, foreign governments, and other actors to take actions or adopt positions supportive of Beijing’s preferred policies (3) The third defining source of CCP conduct is the dictatorial nature of its power. Like the ruling class in any autocracy, CCP leaders fear losing power. The party perceives itself to be engaged in a “life-or-death struggle” against Western ideas, including democracy, the universality of human rights, neoliberal economic policy, and even independent journalism… [This] sense of ideological struggle also creates an absolutist view of security.” |
| “Sri Lanka’s Pain is Going to Spread”, by Mihir Sharma, Bloomberg, 22Apr19 | SURPRISE Following the Easter terrorist attacks in Sri Lanka, the author concludes that, “The entire subcontinent that the British once ruled from Delhi has seen, over the past decade, religious and ethnic identities harden and divisions deepen…The naive presumption that economic growth and prosperity, or even increasing education, would help minimize these cleavages and prevent them exploding into violence stands completely discredited… “The truth is that all of our postcolonial states have failed in one crucial respect. They never built up the sort of modern, inclusive, all=embracing national identity that is the only defense against violence in a region as integrated and as burdened with history as this one. India came close. But the Indian state’s preferred belief in the country’s “composite culture” depended on the myth that different communities had lived in peace with each other for centuries before colonialism. That was, of course, nonsense; and a liberal project of nation-building that centers upon lies about the past cannot survive.” See also, “How Hindu Nationalism Went Mainstream in Modi’s India”, by Amy Kazin, FT 8May19 |
| US-Iranian relations are rapidly deteriorating, with an increasing chance of some type of kinetic conflict between the two. | Key developments have included the US designating the Iranian Republic Guard Corps as a terrorist organization, the decision to eliminate sanctions waivers on Iranian oil exports (which will put more pressure on its economy, with the IMF forecasting a 6% decline in GDP), Iranian threats to break its nuclear treaty and resume uranium enrichment (a precursor to nuclear weapons development), deployment of additional US military resources to the Middle East (in response to reports that Iran was “escalating its military activity”), and Iranian threats to block the Strait of Hormuz and sink American ships. About 19 million barrels/day of oil pass through the Strait, out of a forecast global total daily consumption of about 100 million b/d in 2019. For more on this, see, “How Iran Could Strike the US Military in a War”, by Harry Kazianis and “Worry About This: Could Iran Sink America's Aircraft Carriers in a Fight?” by Kyle Mizokami, both in National Interest |
| | |
| | |
| | |
| | |
| | |
| | |
| | |
| | |
| New Health and Disease Information: Indicators and Surprises | Why Is This Information Valuable? |
| The escalating Ebola hemorrhagic fever outbreak in Democratic Republic of the Congo (current case count 1,600, which is increasing at an accelerating rate) amid a deteriorating local security situation). The case fatality rate is 63%. Elsewhere, African Swine [hemorrhagic] Fever has been spreading rapidly in China, world’s largest pig producer. It is a highly contagious virus (between pigs) and has a very case fatality rate. Anytime a contagious deadly disease infects pigs, there is an elevated threat of a viral mutation or recombination that could lead to human infection (e.g., as in the case of strains of the influenza virus), because of the similarity of pig and human respiratory tracts. | Both of these situations remind us of the potential threat posed by infectious diseases and the substantial supply and demand side shocks they can cause. These wildcard risks are always out there, which makes early detection and accurate assessment of the threat they pose critical to avoiding the large downside losses they potentially can cause. |
| | |
| New Social Information: Indicators and Surprises | Why Is This Information Valuable? |
| The OECD published a new report on “Under Pressure: The Squeezed Middle Class” | Based on a broader analysis than many other similar reports, the OECD still reaches familiar conclusions. Across many countries, the costs of housing and education are rising faster than incomes, and employment is increasingly uncertain and under threat from automation. Moreover, “the middle class is also concerned about their children’s future prospects; the current generation is one of the most educated, and yet has lower chances of achieving the same standard of living as its parents.” All these factors are leading to higher levels of political instability and increasing the appeal of more extreme parties, messages, and candidates.” The report concludes with a set of policy recommendations that are as familiar (e.g., “improve education and training”) as they are lacking in specifics about how to overcome the substantial obstacles to their successful implementation. See also, “The Changing Nature of Work”, a major new report by the World Bank |
| “Accelerating Dynamics of Collective Attention” by Lorenz-Spreen et al in Nature Communications | SURPRISE This paper provides new evidence that confirms many people’s lived experience: we face vastly more competition for our limited attention, which we find exhausting. This creates the potential for greater swings in public attention, narratives, beliefs, emotions and behavior over ever shorter periods. “With news pushed to smart phones in real time and social media reactions spreading across the globe in seconds, the public discussion can appear accelerated and temporally fragmented. “In longitudinal datasets across various domains, covering multiple decades, we find increasing gradients and shortened periods in the trajectories of how cultural items receive collective attention. Is this the inevitable conclusion of the way information is disseminated and consumed? Our findings support this hypothesis. "Using a simple mathematical model of topics competing for finite collective attention, we are able to explain the empirical data remarkably well. Our modeling suggests that the accelerating ups and downs of popular content are driven by increasing production and consumption of content, resulting in a more rapid exhaustion of limited attention resources. In the interplay with competition for novelty, this causes growing turnover rates and individual topics receiving shorter intervals of collective attention.” |
| “America’s Upper Middle Class Feeling the Pinch Too”, by Alexandre Tanzi in Bloomberg, 13Apr19 | This article highlights another source of heightened political frustration and instability. “Newly available net worth data from the Federal Reserve suggests that the “left-behind” contagion has spread to all Americans aside from the top 10 percent. While still wealthier overall than most other groups, even the upper-middle class is feeling the pinch of income stagnation. The growth rate of this group’s incomes is lagging behind that of those both lower and higher on the socioeconomic ladder. “The cost of many products and services the upper middle class buys, from autos to college educations, is outpacing overall inflation. While having access to credit, these households are increasingly tapping into costlier forms of debt”, [especially student loans.]” |
| “Narratives About Technology Induced Job Degradation Then and Now” by Robert Shiller | SURPRISE This fascinating paper puts current concerns over the impact of artificial intelligence and automation into a much longer historical context. As Shiller notes, “Concerns that technological progress degrades job opportunities have been expressed over much of the last two centuries by both professional economists and the general public. “These concerns can be seen in narratives both in scholarly publications and in the news media. Part of the expressed concern about jobs has been about the potential for increased economic inequality. But another part of the concern has been about a perceived decline in job quality in terms of its effects on monotony vs creativity of work, individual sense of identity, power to act independently, and meaning of life. Public policy should take account of both of these concerns, inequality and job quality.” For an example of this, see, “How Amazon automatically tracks and fires warehouse workers for ‘productivity’”, by Colin Lecher |
| “The End of Aspiration”, by Joel Kotkin in Quillette | “Since the end of the Second World War, middle- and working-class people across the Western world have sought out—and, more often than not, achieved—their aspirations. These usually included a stable income, a home, a family, and the prospect of a comfortable retirement. However, from Sydney to San Francisco, this aspiration is rapidly fading as a result of a changing economy, soaring land costs, and a regulatory regime, all of which combine to make it increasingly difficult for the new generation to achieve a lifestyle like that enjoyed by their parents… “Three quarters of American adults today predict their child will not grow up to be better-off than they are, according to Pew. These sentiments are even more pronounced in France, Britain, Spain, Italy, and Germany. In Japan, a remarkable three-quarters of those polled said they believe things will be worse for the next generation…This generational gap between aspiration and disappointment could define our demographic, political, and social future.” |
| “Divided Europe” by Colijn and Konings from ING Bank | SURPRISE “In September 2008, the bankruptcy of Lehman Brothers marked the low point of the financial crisis. Ten years on, the European economy has recovered, but the scars of the crisis are still visible at a regional level. While employment – measured as employed persons - for the European Union is now 2% above the 2008 peak, this is not the case for many local economies. The crisis has had a long-lasting and deep effect on economic activity and on employment, and many regions have only recently begun to recover. “Some regions have not even shown signs of bottoming out, with employment still in decline. Deep scars caused by the crisis are still impacting regional labour markets across Europe. Many regions are still recovering, with the unemployment rate still above the natural rate, according to our estimates.” “Structural strength or weakness seems to be driven in part by the region’s digital infrastructure, the vulnerability to globalisation, the innovative capacity of the region and the residents’ level of education. “A large divide between urbanised and younger regions and rural and ageing regions, with the latter in general performing much more poorly. This confirms the view of a split in society between areas that are vulnerable to population outflow and ones with prolonged high structural unemployment and those which are more vibrant and generally profit from large societal trends. “More redistribution at the European level seems unlikely given the political environment at the moment. With stagnation a possibility for many regions, the appetite for the populist vote, from an economic perspective, at least, could increase.” |
| “The City of Europe’s Future”, by Ben Judah in The American Interest The author provides a revealing in-depth analysis of Rotterdam. | SURPRISE “Transformed not only by the European Single Market but also by mass migration, Rotterdam is an incubator for populist politics of all persuasions. It has a Muslim mayor, its own Islamist Party, and a statue of the pioneer of modern rightwing nativism, Pim Fortuyn…” “In the most recent elections, Rotterdam seemed more polarized than ever. Thierry Baudet’s party came first, then Wilder’s party, winning a combined 29 percent. The Green Left came third, with 12 percent, with Denk winning 8 percent and Nida 2 percent of the vote. The traditional centrist parties, with no clear message in the culture war, struggled even in traditional fractured Dutch politics... “This offers a sobering lesson to those in Britain and America who think populism can be calmed by strong growth, successful investment, and sinking unemployment. Because Rotterdam has all of those features and a prosperity hard to imagine for those who were born there a generation or more ago. Rather, Rotterdam appears to be warning, the great culture war that is emerging in Europe—in every election, in every country—really is about culture assimilation and ethnic change after all. It’s not the economy.” |
| “A new estimate suggests global migration is much higher than we thought”, by Urton-Washington, published by the World Economic Forum | SURPRISE “Researchers have unveiled a new statistical method for estimating migration flows between countries... “They show that rates of migration—defined as an international move followed by a stay of at least one year—are higher than previously thought, but also relatively stable, fluctuating between 1.1 and 1.3 percent of global population from 1990 to 2015… “In addition, since 1990 approximately 45 percent of migrants have returned to their home countries, a much higher estimate than other methods… |
| | |
| | |
| | |
| | |
| | |
| New Political Information: Indicators and Surprises | Why Is This Information Valuable? |
| “Many Across the Globe are Dissatisfied with How Democracy is Working”, by Wike et at from Pew Research | “Across 27 countries polled, a median of 51% are dissatisfied with how democracy is working in their country; just 45% are satisfied…Anger at political elites, economic dissatisfaction and anxiety about rapid social changes have fueled political upheaval in regions around the world in recent years… |
| The Financial Times’ Martin Wolf has written a succinct summary of the six crises confronting the United Kingdom. To varying degrees, they also apply in many other countries today, especially the United States (“Britain is Once Again the Sick Man of Europe”, FT, 18Apr19) | “The first crisis is economic”, specifically the slow growth of productivity since the shock of 2008. “The second crisis is over whether national identify has to be exclusive...The third crisis, Brexit, has weaponised identity, turning differences into accusations of treason…” “The fourth crisis is political. The existing parties, based historically on class divisions, do not fit the current identify divisions”… “The fifth crisis is constitutional (by which I mean that it relates to the rules of the political game)”… “The sixth and perhaps most important crisis of all is leadership” – i.e., the quality of the people most likely to become the next UK Prime Minister. |
| “Conservatives Have a Different Definition of Fair”, by Dan Meegan (author of “America the Fair: Using Brain Science to Create a More Just Nation”) | SURPRISE This excellent article reminds us that the aggregate political opinions and behavior we observe emerges from a complex mix of individual and group level factors. “There is more than one way to decide who is deserving of what. One is by need: Some people have more than they need, and others need more than they have. Even when liberal leaders describe policies that are beneficial to everyone, they make it clear that the most important beneficiaries are those whose needs are most urgent… Still, there are other ways of judging what’s fair… “Conservatives tend to value equity, or proportionality, and they see unfairness when people are asked to contribute more than they should expect to receive in return, or when people receive more than they contribute… “This conservative version of fairness is wired deeply in the human brain, and liberals ignore it at their peril. In the laboratory, psychologists study the roots of economic and political attitudes through exercises like the ultimatum game, in which one player (the allocator) makes an offer to another player (the recipient) about how to split a small pot of money put up by the researchers. The recipient can accept the other player’s offer and take the cash—or reject it, in which case neither player gets anything. Not surprisingly, when the allocator offers a 50-50 split, recipients accept it. “However, very unfair offers, such as a 90-10 split favoring the allocator, are often rejected by recipients, even though 10 percent of the pot is better than no money at all… Why would the brain’s default mode be to reject something in favor of nothing? “Cognitive scientists have discovered that such seemingly irrational behavior often has an adaptive purpose. Rejection of unfair treatment, for example, has the purpose of enforcing social norms about the allocation of resources Acceptance of an unfair offer now all but guarantees continued mistreatment at the hands of the allocator, whereas rejection sends a clear message: Don’t take advantage of me, and don’t help yourself to more than you deserve… “One might conclude from this that liberals, in their emphasis on helping the needy, are superior to conservatives because they strive to overcome biological determinism. Yet one could also accuse liberals of neglecting other definitions of fairness and—to their political detriment—of paying too little attention to how many other human beings instinctively think.” |
| “The Unwitting Committee to Re-Elect the President”, by Joel Kotkin | Kotkin succinctly summarizes the increasingly heard argument that the Democratic Party seems intent on snatching defeat from the jaws of victory in the 2020 US Presidential election, potentially handing another four year term to Donald Trump. “Democrats could succeed easily if they focused on basic middle class issues, such as health care and reforming the tax system, where popular opinion, including among working class whites, is largely on their side. Infrastructure spending, if they can somehow disassociate it from the usual pork-barreling, could also gain support, particularly from construction workers. “Instead many Democratic candidates appear if they are trying to win the campus and media intersectionality challenge, emphasizing cultural “purity” in ways that worry such craftier politicians as Barack Obama. The views now commonly expressed on gender, race, immigration and the environment may work in the deep blue recesses of our majority cities, but are unlikely to play in Peoria.” |
| However, there is more to the case for a Trump victory in 2020 than a claim that the Democrats will lose the race. Donald Trump is still very much the same person we all knew when I lived in New York in the late 70s and early 80s; he hasn’t changed. What I find far more interesting is how the electorate changed to the point that so many people were willing to vote for him for president in spite of his manifest flaws – and may well vote for him again in 2020 (e.g., see “Voters’ Capacity for Being Appalled by Trump is Waning” by Janan Ganesh, Financial Times 24Apr19) A number of other recent articles and papers have helped me to better understand how this could come to pass. | In “All the Progressive Plotters”, Victor Davis Hanson provides an extensive list of the ways that Trump supporters will likely argue that his opponents have attempted to both prevent and then overturn his election. These arguments are sure to appear again in the 2020 campaign. In “Progressivism and the West”, Bo Winegard identifies six aspects of progressivism, in its modern form (certainty not Teddy Roosevelt’s) that are generating increasing opposition: “(1) Misunderstanding human nature, in the form of its selective claims of “blank slatism” when genetic science findings conflict with its ideological principles; (2) Elevating victims and encouraging victimhood; (3) Encouraging censorship of speech and academic/scientific inquiry that doesn’t accord with its ideology; (4) Eroding due process and the presumption of innocence; (5) Encouraging “mobocracy” and disproportionate punishment; and (6) Encouraging contempt for the West and its icons.” In two other articles, Hanson uses Herbert Stein’s famous dictum (“if something cannot go on forever, it will stop”) to address the likely impact of the near unprecedented level of immigration (both legal and otherwise) on politics in the United States. In “Are There Any Limits on Immigration?” Hanson notes “there is a general expectation in Mexico and Latin America that American immigration law is unenforced. Or it is so bizarre that simple illegal entry almost always ensures temporary legal residence, pending an asylum hearing.” He goes on to describe, in great detail, how unchecked immigration has changed life in the California central valley town where he has lived for 65 years. In “Things That Can’t Go on Forever Simply Don’t”, Hanson invokes Stein’s Law and notes that, “For history’s rare multiracial and multiethnic republics, an “e pluribus unum” cohesion is essential. Each particular tribe must owe greater allegiance to the commonwealth than to those who superficially look or worship like them…Yet over the last 20 years, we have deprecated unity and championed diversity… “But unchecked tribalism historically leads to nihilism. Meritocracy is abandoned as bureaucrats select their own rather than the best-qualified. A Tower of Babel chaos ensues as the common language is replaced by myriad local tongues, in the fashion of fifth century imperial Rome. “Class differences are subordinated to tribal animosities. Almost every contentious issue is distilled into racial or ethnic victims and victimizers. “History always offers guidance to the eventual end game when people are unwilling to give up their chauvinism. Vicious tribal war can break out as in contemporary Syria. The nation can fragment into ethnic enclaves as seen in the Balkans. Or factions can stake out regional no-go zones of power as we seen in Iraq and Libya. “In sum, the present identity-politics divisiveness is not a sustainable model for a multiracial nation, and it will soon reach its natural limits one way or another. On a number of fronts, if Americans do not address these growing crises, history will. And it won’t be pretty.” |
| Both very insightful and equally worrying are various research papers by Professor Lilliana Mason, author of the book “Uncivil Agreement: How Politics Became Our Identity” | SURPRISE Mason’s argument begins with the observation that, “Social cooperation seems to require that we think of an “us” and a “not us.” These types of social categories help us to make sense of a complicated world. She notes that, “civilization more broadly seems to require that we identify with groups, and that we privilege our own groups over others. This doesn’t necessarily mean hating other groups. It simply means liking our own group the most, and doing the most work to help our group.” In recent years, however, a number of interacting social sorting mechanisms have caused a much greater alignment of preferences and outcomes on different dimensions (e.g., race, religion, geography, education, income, social views, etc.) with political party identifications, which have become what Mason calls “meta-identities.” As she notes, “partisanship can now be thought of as a mega-identity.” Mason concludes that this has had negative consequences whose impact is not widely recognized. “Because a highly aligned set of social identities increases an individual's perceived differences between groups, the emotions that result from group conflict are likely to be heightened among well-sorted partisans.” Put differently, “Individuals who feel fewer cross pressures from their multiple identities become more intolerant of perceived ‘out-groups’.” In contrast, in societies with less aligned identities, “cooler heads are more likely to prevail.” Even more important, when a range of different social identities are all aligned with allegiance to a particular political party, when that party changes its policy positions it is much less likely to lose voters that would have been the case in the past, because today party identification has a larger impact than a party’s position on a given issue. In sum, because social sorting and has increased the alignment of multiple identities, party allegiance has become much more durable, and intraparty conflict much more heated and antagonistic. That is a critical change from the past, and one that I believe will likely take a near existential external threat to the nation to overcome. |
| | |
| | |
| | |
| | |
| | |
| New Financial Markets and Investor Behavior: Indicators and Surprises | Why Is This Information Valuable? |
| “Stress Testing Networks: The Case of Central Counterparties” by Berner, Cecchetti, and Schoeholtz | As the Financial Times’ John Dizard has often warned, the authors of this paper conclude that, “the network created by central clearing can act as an important transmission mechanism for shocks emanating from Europe. |
| According to the Schroeders 2018 Investor Survey, on average, investors expect their portfolios to deliver annual returns of 9.9% over the next five years. Investors who consider their level of investment knowledge to be advanced/expert expect returns of 10.9% per year over the next five years | SURPRISE The Schroeder’s estimate seems high, particularly given another piece of new data, the most recent estimate of equity market risk premiums used by global investors, based on a survey by Pablo Fernandez of IESE Business School. In the US, he found an average ERP of 5.6%, and median of 5.5%, roughly unchanged from 2015, despite rising valuation levels and an increasingly uncertainty economic outlook. |
| “Fact vs. Affect in the Telephone Game” by Brithaupt et al | As we have repeatedly mentioned, researchers have found that when uncertainty is high, human beings tend to conform to the views of their group, and rely more heavily on social learning/social copying and less on their own private and information when making decisions. Hence understanding the way that stories and narratives are socially transmitted is of great interest. The authors find that, “When people retell stories, what guides their retelling? Most previous research on story retelling and story comprehension has focused on information accuracy as the key measure of stability in transmission. This paper suggests that there is a second, affective, dimension that provides stability for retellings, namely the audience affect of surprise. In a large-sample study with multiple iterations of retellings, we found evidence that people are quite accurate in preserving all degrees of surprise in serial reproduction –even when the event that produced the surprise in the original story is dropped or changed [in the process of retelling].” This finding is consistent with the conclusion of an earlier paper, which found that, “when messages are propagated through diffusion chains, they tend to become shorter, gradually inaccurate, and increasingly dissimilar between chains. In contrast, however, the perception of risk is propagated with higher fidelity due to participants manipulating messages to fit their preconceptions, thereby influencing the judgments of subsequent participants” (“The Amplification of Risk in Experimental Diffusion Chains” by Moussaid et al) |
| “Estimating the Anomaly Base Rate” by Chinco et al | Today we are frequently confronted with critiques of the exploding number of factors that produce anomalies in asset returns compared to the traditional efficient market hypothesis, and further claims that these factors can be used to generate superior risk-adjusted returns. From a Bayesian point of view, the true test of the claim that a new factor/anomaly has been discovered should go beyond the simple p-value (i.e., the likelihood that it is not just a random result), and also rest on the prior base rate for the discovery of anomalies in general. Unfortunately, the latter is not an subject that has been much researched in financial economics. This paper finally does that, calculating the base rate for anomalies since 1973. While technical, it is well worth a read both by active managers seeking to discover and exploit factors, and by index managers who seek to replicate them. |
| “Liquidity Risk after 20 Years” by Pastor and Stambaugh | The authors note the successful replications of their original findings about the existence of a liquidity risk premium. They also note how liquidity risk premiums have increased in recent years. This aligns with multiple articles over the years that have claimed that different market developments have negatively affected market liquidity, including higher bank capital requirements, the rise of algorithmic trading across multiple locations, and the growth in value of ETF investments. |
| “Fundamental Trends in Dislocated Markets”, by Bakrania et al from AQR | The authors begin by noting two principles of AQR’s investment philosophy which align with our own (which in turn underlies the value provided by our global macro forecasts): that some types of information are only slowly incorporated into asset prices, and that those prices have a tendency to overshoot. They then describe “two approaches to global macro investing: a systematic strategy focused on identifying fundamental trends and an opportunistic strategy capitalizing on extreme dislocations between prices and fundamentals. [They also] explore the potential benefits of combining these approaches into a single integrated macro strategy.” |
| Private equity once again in the news. First, some firms have launched so-called “super carry” funds in which managers obtain 30%, rather than 20% of profits above a threshold return (in addition to fund management fees). Second, as Robin Wigglesworth reported in the 15Apr19 Financial times, “Quant Funds Train Their Sights on Private Equity.” | For the better part of 20 years, The Index Investor has wrestled with and commented on the basic question of whether private equity offers a superior risk/return tradeoff to public market equities with similar characteristics. Time has not changed our view that in most cases it does not, and should be avoided by most investors. Having been “present at the creation” as it were, we are the first to admit that transactions by the original 1980s Leveraged Buyout funds created value, as the exploited a rich set of targets with too high costs and too little leverage. Research also found that value creation by these funds also benefited from skill in choosing when to return companies the public market. Over time, however, private equity investing has become a much, much more difficult game to win. Potential targets were run much more efficiently and leveraged up their balance sheets. That forced PE funds to attempt new games, such as sector rollups (which often created value via cost cuts and increased pricing power), and attempts to increase revenues by improving value propositions (which has been a much greater challenge). While today some PE funds are well known, the much larger number that failed to raise “Fund 2” are not. According to Prequin, at the end of 2018, PE funds had $1.2 trillion in dry powder (uninvested capital), and these days too many PE deals are, as they say, priced to perfection, with highly leveraged balance sheets required to hit target returns on equity. However, servicing this large amount of debt depends on successfully hitting very aggressive operating targets in an economy that will likely face and extended downturn during the life of the fund. Moreover, too many PE “exit” transactions are now taking the form of “pass the potato” sales to other PE funds. In our view, this chapter in PE history is very unlikely to end on a happy note for funds’ limited partners (and too many portfolio companies). |
| | |
How Close is the Macro System to One or More Critical Thresholds?
As we have noted, the macro drivers of financial market regime changes typically follow a rough chronological sequence, from technology to economic, security, social, and political causes and effects. Yet there are many feedbacks loops between them, creating complex root causes for many of the critical thresholds we have identified.
Understanding the time dynamics in this complex system is critical to avoiding substantial downside investment risk.
We use the UK Met Office Warning Model to communicate our assessment of these time dynamics. We estimate the time remaining before a critical macro system threshold is reached that could trigger a regime change, which is usually accompanied by substantial changes in asset class valuations.
The model uses three increasingly serious levels of warning, from “Be Aware” (condition yellow), to “Be Prepared” (condition orange), to “Take Action” (condition red).
For our purposes, we denote as “Be Aware” (yellow) critical thresholds that we assess to be three or more years away. We estimate that “Be Prepared” (orange) thresholds could be reached within 1 to 3 years. “Take Action” thresholds are very likely to be reached within one year.
Given their nature, we also note that in our three “wildcard” areas (Environment and Energy related; Disease and Human Caused Bioevents; and Cyber and Electromagnetic Events), our forecasts have higher levels of uncertainty.
The following charts summarize our current estimate of the time remaining before different critical thresholds will be reached.
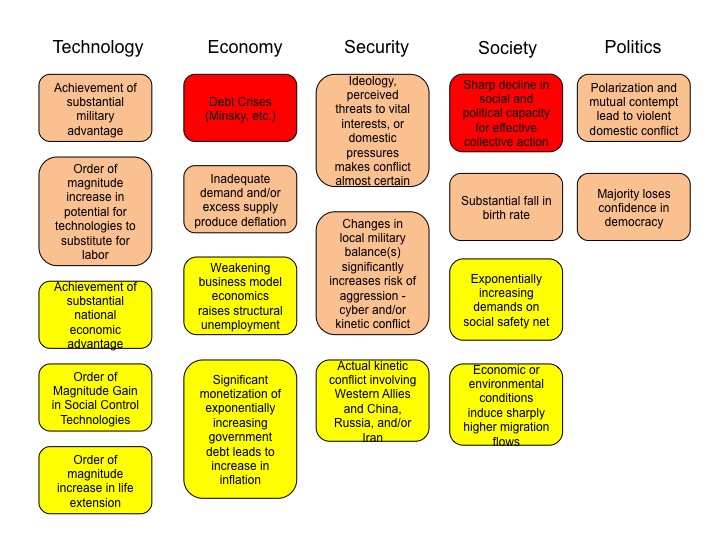
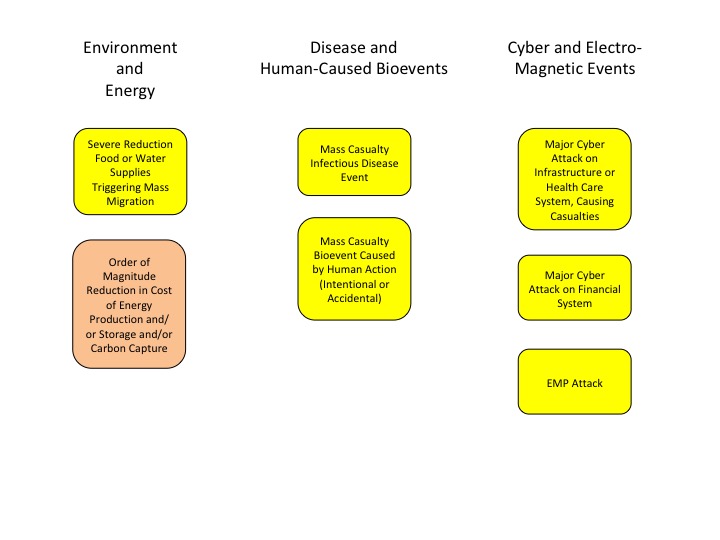
At the highest level, we believe the complex adaptive global macro system can be in one of four states, based on its degree of order versus disorder, and degree of social cooperation versus conflict. A very coarse-grained reading of history suggests that these states evolve in a predictable cycle, from ordered/cooperative, to disordered/cooperative, to disordered/conflicted, to ordered/conflicted.
We believe that the system is currently in its most uncertain state, characterized by high degrees of underlying disorder and social conflict, both domestically and internationally. Beyond some point, intensifying conflict eventually increases the degree of order in the system. That appears to be happening now, via the increasing conflict between China, Russia, and Iran and the United States and other Western nations.
Pre-Mortem Analysis
One of the most important forecasting disciplines is to ask yourself why your forecast could be wrong. Dr. Gary Klein’s research has shown that a very powerful and insightful way to do this is via a “pre-mortem analysis.” This method asks you to assume that it is a point in the future, and your forecast has been proven wrong (or your strategy or company has failed). You are then asked to look backward from this imagined point in the future, to explain why you failed, what you missed, and what you could have done differently to avoid your fate.
The pre-mortem method takes advantage of the fact that humans reason much more concretely and in more detail when explaining the past than they do when trying to forecast the future.
So let us assume that it is one year from now, and our current forecast has turned out to be wrong.
How did this happen? What developments did we fail to anticipate?
At the end of April 2019, the leaders of the world’s three major powers – Xi Jinping, Donald Trump, and Vladimir Putin are all facing weakening economies and declining political popularity. History teaches us that this can lead to increased “foreign adventurism” to distract the public from worsening domestic conditions, as a nation rallies around its leader in a period of heightened external conflict. Should such a conflict develop between China and the United States, or between Russia and one or more European countries, it would generate a sharp increase in uncertainty that would likely cause an equally sharp economic slowdown and, given high debt levels, speed the arrival of the Persistent Deflation Regime.
As described in this month’s feature article, while remote, a supply side shock of some type could produce a sudden increase in inflation – the most likely scenario being a reduction in oil supplies due to a sudden intensification of the simmering conflict between Iran and Saudi Arabia.
While we believe it is highly improbable, we can envision a scenario in which for a range of possible reasons, both Xi Jinping and Donald Trump leave their current roles, and are replaced by leaders who are more committed to lessening conflicts both between China and the United States and in the international system as a whole. This would likely provide a strong boost to confidence (and thus lead to an equally strong reduction in uncertainty). Whether this would also create an opening for a reduction in domestic political conflict in the United States, and thus progress on policy reforms to address weak growth and rising inequality isn’t clear.
Note: Combining this Forecast with Others and Extremizing the Result Should Increase Predictive Accuracy
Research has found that three steps can improve forecast accuracy. The first is seeking forecasts based on different forecasting methodologies, or prepared by forecasters with significantly different backgrounds (as a proxy for different mental models and information). The second is combining those forecasts (using a simple average if few are included, or the median if many are). The final step, which significantly improved the performance of the Good Judgment Project team in the IARPA forecasting tournament, is to “extremize” the average (mean) or median forecast by moving it closer to 0% or 100%.
Forecasts for binary events (e.g., the probability an event will or will not happen within a given time frame) are most useful to decision makers when they are closer to 0% or 100% than the uninformative “coin toss” 50%. As described by Baron et al in “Two Reasons to Make Aggregated Probability Forecasts More Extreme”, forecasters will often shrink their probability estimates towards 50% to take into account their subjective belief about the extent of potentially useful information that they are missing.
When you average multiple forecasters’ estimates, you are including more information, which should increase forecast confidence and push the mean estimate closer to 0% or 100%. However, this doesn’t happen when you use simple averaging. For this reason, forecast accuracy is increased when you employ a structured “extremizing” technique to move the mean estimate closer to 0% or 100%.
You can download an extremizing model from our website to use when combining the forecasts you use in your decision process.
The extremizing factors in our model are those that the Good Judgment Project found maximized the accuracy of combined forecasts. Note that the extremizing factor is lower when average forecaster expertise is higher. This is based on the assumption that a group of expert forecasters will incorporate more of the full amount of potentially useful information than will novice forecasters.
Across the social sciences the greatest challenge confronting researchers and practitioners is explaining and/or predicting the behavior of complex adaptive systems, which have many parts that interact in non-simple ways (e.g., multiple possible causes for an effect, feedback processes and non-linear effects, and time delays between causes and effects).
In such systems, behavior emerges from these complex interactions, not just from the rules followed by any individual agent. Moreover, as the agents that populate these systems constantly adjust their beliefs and behavior to achieve their (sometimes conflicting) goals, the structure of a complex adaptive system itself constantly evolves; more technically, such systems are “non-stationary” data-generating processes, in which an understanding of the past does not automatically confer an ability to accurately predict the future. In sum, complex adaptive systems are organic, not mechanistic, and are far more likely to produce outcomes whose distribution is best described by a power law, rather than the more familiar bell curve.
Explanation and prediction challenges become exponentially more difficult as more than one complex adaptive systems are interconnected. For example, our model of “global macro” includes changes in six key areas: technology, the economy, national security, society, politics, and financial market structure and behavior. We also recognize the potential for substantial “wildcard” effects from less predictable changes in the areas of health and infectious disease; energy and the environment; and cyber and solar events.
There are a number of different approaches that can be used to address the challenge of predicting the behavior of complex adaptive systems.
One approach is directly modeling them (albeit at a high level). For example, Monte Carlo and System Dynamics are top down quantitative modeling approaches based on underlying causal beliefs. The former captures the impact of variation in the values of key variables, while the latter focuses on the impact of feedback effects and stock/flow constraints (e.g., a bathtub that eventually catastrophically overflows if the rate of water inflow exceeds the rate of water outflow). In contrast, agent-based modeling is a bottom-up technique that seeks to identify the outcomes that emerge from the interaction of agents who follow a limited number of assumed goals rules to guide their behavior. In some cases, aspects of these techniques are combined (e.g., see, “Agent-Based Stock-Flow Consistent Macroeconomics: Towards a Benchmark Model” by Caiani et al, and papers by Giovanni Dosi, Didier Sornette, Doyne Farmer, Brian Arthur, Xavier Gabaix, and Car Hommes – to name just a few of the growing number of researchers in this area).
Another family of quantitative approaches to the prediction challenge is associative, rather than causal, and based on statistical methods. These include a wide range of econometric techniques that seek to reduce the dimensionality of the problem, for example by identifying a limited number of factors whose variation, at least in the past, can account for a substantial portion of the variation in a much larger number of outcomes (e.g., using Fama-French factors to forecast equity returns).
Finally, uncertainty about the nature of relationships between the variables in the system being modeled, and/or multiple conflicting goals can often be managed through so-called “ensemble modeling”, which combines the results of multiple runs of different models to estimate the full range of possible system outcomes.
In contrast to the hypothesis testing method that underlies econometrics, “machine learning” approaches (including deep learning artificial intelligence techniques) seek to maximize predictive accuracy without making any assumptions about the underlying causal model. In effect, these methods analyze historical or synthetic data to create extremely complex statistical models to predict a target outcome from a very diverse set of inputs. A key issue with such models is whether end users will trust their outputs if they cannot easily understand how they were derived (hence the growing popularity of “explainable AI”).
Qualitative methods are also used to predict the behavior of complex adaptive systems. Perhaps the most familiar is the use of historical analogies (e.g., “applied history” techniques, or the case method). Another widely used approach is the scenario method, which derives alternative future narratives from the interaction of relatively predictable trends and a limited number of critical uncertainties.
At the Index Investor, we use an approach that combines some of these techniques. Fist, we specify our forecasting goal: accurately estimating the probability that the global macro system will be in one of four regimes at some point in the future (e.g., in 12 and 36 months). Based on our analysis of economic and financial market history, we define these regimes as normal times (which equities and high yield debt deliver the highest relative returns); high inflation (when inflation linked bonds, property, and commodities like gold and timber perform best); high uncertainty (usually a transitory regime in which short term government securities, gold, and the Swiss Franc usually outperform); and persistent deflation, as we have seen in Japan over the past thirty years (where long term government and high quality corporate bonds and consumer staples equities should outperform). These four different regimes can be thought of as “macro factors” that drive the relative returns on broadly defined asset classes.
We assume that the emergence of these regimes reflects the interaction of five six macro drivers, including changes in technology (including healthcare and education as two critical “social technologies”); the economy; national security; social values, beliefs, and behavior; politics; and the structure of financial markets. As noted above, we also recognize the potential for “wildcard” effects on regime probabilities from changes in the areas of health and disease; energy and the environment; and cyber and solar events.
Critically, our model assumes that the effects produced by these drivers occur in a rough chronological pattern (albeit with many feedback loops), in which changes in technological possibilities drives changes in the economy and national security (with an interaction between those two), which produce social changes that have a significant impact on political changes. These interact with changes in the structure of financial markets (e.g., increases algorithmic trading, increased connectivity between global markets, new products like ETFs, increased assets committed to private capital strategies, etc.) to determine the macro (broadly defined) regime we are in at any point in time.
To reduce the complexity of these drivers, we employ a scenario approach, based on the interaction of two critical uncertainties. This generates four possible outcomes for each of our five key drivers (technology, the economy, national security, society, and politics). Mathematically, this simplifying approach generates a still unwieldy 1,024 (4 to the 5th power) possible scenarios – without considering the wildcards or changes in financial market structure.
To further simplify our forecasting problems, we employ the Bayesian concept of Likelihood. Working either backward in time from future regimes through different drivers (i.e., “prospective hindsight”) or forward in time starting with technology drivers, we ask whether, given our starting scenario, one scenario in the next set of drivers is significantly more likely than others. For example, slow economic growth and worsening inequality make it less likely that immigration problems will be resolved and social capital renewed. To be clear, this method does not make causal assumptions, as all of our scenario outcomes emerge from complex processes that can at best be imperfectly understood. Rather, our approach is associative, and is based on our estimate of the extent to which a scenario outcome for a given driver is more likely to be observed than others for that driver assuming a specific scenario for another driver occurs.
We use this method to construct a limited number of logically and chronologically coherent pathways through the 1,024 possible scenarios that lead to different regime outcomes. Finally, given variations in the likelihood ratios, some pathways will appear more and less uncertain that others, which in turn helps us to focus our information collection efforts.
The graph below presents a visual overview of this methodology. The red arrows show a narrative pathway proceeding forward in time from a technology scenario, while the green arrows show a pathway that proceeds backwards in time from an assume future regime outcome. The dashed lines represent weak likelihood ratios.
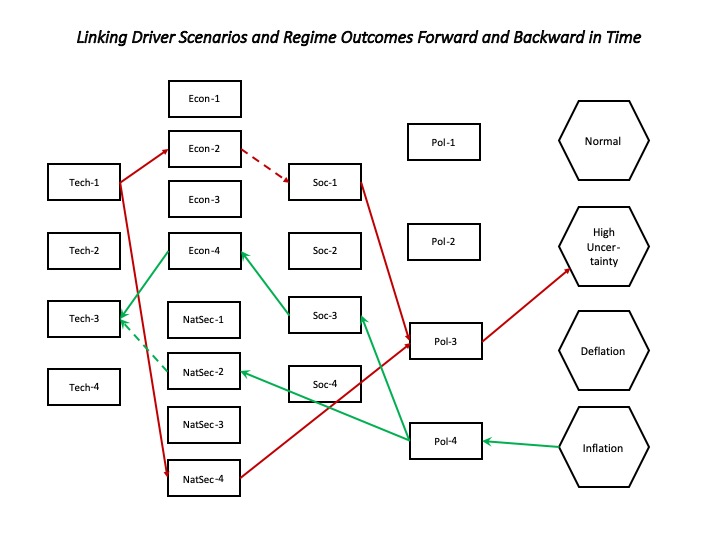
Let’s now turn to the current assumptions we are using in our analytical model, beginning with the two uncertainties that underlie our four scenarios for each macro driver:
Technology
Fast versus slow development and deployment of automation and artificial intelligence technologies.
Strong versus weak productivity growth in healthcare and education, the two key “social technologies” that now account for almost 25% of US GDP.
Economy
Faster versus slower growth in aggregate demand.
Increasing or declining inequality.
National Security
More cooperative or more conflict driven US-China relations.
Increase versus either no change or decrease in China’s military power relative to the United States and its allies.
Society
Consensus solution to immigration problem is implemented, or no solution is arrived at and conflict over this issue worsens.
Social capital increases, or continues to decrease, as it has in recent years.
Politics
The relative strength of the center strengthens or weakens.
The popular legitimacy of government institutions strengthens or weakens.
The construction of our narrative pathways connecting different driver scenarios to regime outcomes is based on a set of beliefs about likely associations that we try to make explicit (not always an easy task). The most important are summarized below:
Fast development and deployment of automation and artificial intelligence technologies will be associated with higher demand growth, all else being equal, via productivity improvement. Slower D&D of A&A is associated with slower demand growth.
Faster healthcare and education productivity improvement (and hence reduced cost/price and pressures and improved outcomes) is associated with reduced inequality. Slower productivity improvement in these areas is associated with increased inequality.
All else being equal, slower development and deployment of automation and artificial intelligence technologies in the US is associated with weakening of national power vis-a-vis China. Faster D&D of A&A maintains or improves the balance in favor of the US.
Falling inequality in the United States is associated with a reduction in the level of conflict in the US-China relationship, which in part based on the search for an external “other” to blame for worsening domestic conditions. Rising inequality is associated with a higher level of conflict.
Faster demand growth and reduced inequality are associated with reduced conflict over immigration (which, as in the case of China, provides an external “other” to blame for worsening domestic conditions). Slower growth and increasing inequality are associated with increased conflict over immigration issues.
Weakened US national power vis-a-vis China is associated with increasing social capital in the face of a potentially dangerous external threat. Increasing national power vis-à-vis China is not associated with increasing social capital.
Weakened US national power vis-a-vis China is associated with increasing institutional legitimacy (assuming this leads to higher degrees of cooperation and better institutional functioning in the face of a strengthening external threat). Increasing national power vis-à-vis China is not associated with increasing institutional legitimacy.
Reduced inequality is associated with increasing social capital. Worsening inequality is associated with declines in social capital.
Strengthened social capital is associated with the relative strengthening of the political center. Weakened social capital is associated with further weakening of the political center.
Reduced conflict over immigration is associated with strengthened institutional legitimacy. Continued or worsening conflict over immigration is associated with further weakening of institutional legitimacy.
Key Elements of Four Pathway Narratives
Pathway #1
Technology
Fast Automation and AI Development and Deployment
Strong Productivity Growth in Healthcare and Education
Economy
Faster demand growth
Declining inequality
National Security
Improving US-China relations
No or negative change in China’s relative power
Social
Consensus solution to immigration
Increase in social capital
Political
Relative strength of the center increases
Institutional legitimacy increases
Macro Regime
Return to Normal
Pathway #2
Technology
Fast Automation and AI Development and Deployment
Slow Productivity Growth in Healthcare and Education
Economy
Faster job displacement leads to falling demand
Rising inequality
National Security
Worsening relations with China
Either no or negative change in China’s relative power
Social
No consensus solution to immigration
Decrease in social capital
Political
Increased popularity of extremes; further collapse of center
Decreased institutional legitimacy
Macro Regime
Deflation
Pathway #3
Technology
Slow Automation and AI Development
Slow Productivity Growth in Healthcare and Education
Economy
Slow demand growth
Increasing inequality
National Security
Increasing US-China conflict
China gaining relative power
Social
Immigration not resolved
China perceived as a unifying external threat, increasing social capital
Political
Increased popularity of extremes; further collapse of center
Institutional legitimacy (defense and security) increases
Macro Regime
High Uncertainty
Pathway #4
Technology
Slow Automaton and AI Deployment
Fast Productivity Growth in Healthcare and Education
Economy
Slow growth
Declining inequality
National Security
Improving relations with China
China also gaining relative power
Social
Immigration not revolved
But social capital increases
Political
Center strengthens
Whether institutional legitimacy recovers depends on balance between fear of increasing relative Chinese power versus slow growth and failure to resolve immigration
Macro Regime
High Uncertainty
To summarize, both quantitative and qualitative methods can be used to forecast the behavior of complex adaptive systems. All of these methods are imperfect, and at best will provide a “coarse grained” understanding of the system’s dynamics and possible outcomes.
In the case of the complex “system of system” that we call “global macro” we prefer to base our forecasts on the structured, scenario-based approach we have described. It has the virtues of flexibility and explainability, while also providing a systematic way to incorporate both experience and new information.
Most importantly, perhaps, our approach is sufficiently different from the methods used by other macro forecasters that combining our estimates with those based on other approaches will almost certainly improve overall forecast accuracy.
If you have any questions about anything we have written in this issue, please don’t hesitate to get in touch, at contact@indexinvestor.com