The Index Investor
March 2021
Recent Quantitative Indicators
Tactical Asset Allocation Implications of Our Forecasts
Forecast Pre-Mortem Analysis
Combining and Extremizing Forecasts to Improve Predictive Accuracy
Feature Article: The Probability of a US-China War Over Taiwan Is Increasing
High Value Information Observed Last Month:
- Technology
- Energy and Environment
- Health and Disease
- Economy
- National Security
- Society
- Politics
- Financial Markets and Investor Behavior
Critical System Thresholds/Tipping Points Analysis
Appendix: Anticipatory Thinking and Forecasting Methodologies
Current Macro Forecast
Fast forward 32 years. Debt is exploding again, and “r” and “g” are back in the headlines. This time around, it is Stanford’s John Cochrane who is providing some very timely insights about an important dynamic that will, along with other factors, cause the emergence of different macro regimes in the years ahead.
Cochrane begins his new paper, “r < g” (that's really the title) with a statement of what should be obvious, but for too many still is not: “Fiscal sustainability is the most important macroeconomic issue of our time. The US is embarked on a historically unprecedented peacetime fiscal expansion. The debt to GDP ratio, passing 100%, is already higher than it has ever been. And current deficits, spending plans, and looming entitlements mean we are only halfway done.”
He then notes the siren song of “r minus g” (i.e., when the interest rate on government debt is less than the rate of GDP growth), which “seems to offer a delicious opportunity. Briefly, suppose the government borrows a huge amount, and simply rolls over the debt, borrowing new money to pay principal and interest on the old. Then debt grows at the rate of return on government debt, r. But if GDP grows at a greater rate r < g, then the ratio of debt to GDP slowly declines. The borrowing need never be repaid by higher later tax revenues or lower spending. Public debt, apparently, has no fiscal cost.”
[Moreover], “The federal government is more and more just borrowing and sending checks to people, businesses, and other levels of government. Indeed, since the Fed is buying most treasury debt, the government is basically printing money and sending it to people. The sense that such government spending, must eventually come from taxation has totally disappeared from policy discourse.”
After setting the stage, Cochrane asks out loud what many people are wondering these days: “Will this work?”
He begins by identifying a central but mostly unacknowledged assumption behind the argument that if the interest rate on government debt is less than the economic growth rate, then over time the government debt/GDP ratio will decline: the government will not run a deficit; all spending will be paid for with tax revenue.
Unfortunately, the US last had a federal budget surplus in 2001. Since then, the average annual deficit has equaled (4.6%) of GDP; the median was (3.9%).
Cochrane then asks, if, rather than a declining debt/GDP ratio, we just want to keep it constant, what is the maximum deficit the government can run, as a percentage of GDP? It is the difference between the cost of its borrowing and the growth rate of GDP.
Let’s take a closer look at that. Today, the real yield on ten year, inflation protected US Treasury securities (TIPS) is negative (0.67%).
As we show in our monthly valuation analysis (our assumptions in parentheses), in theory, the real yield is a function of the future annual rate of labor force growth (0.5%), the future rate of total factor productivity growth (0.5%), the standard deviation of real annual GDP growth (1.5%), investors’ time preference (.75) and their relative risk aversion (.38). Note that for the latter two parameters, we use research findings on their values for long-term, institutional investors. These parameters produce a required real yield (“r”) of 0.97% today.
What about the prospects for long-term future GDP growth? The US Bureau of Labor Statistics projects the labor force will grow by only 0.5% per year in the future.
What about long term US productivity growth (known as either total factor productivity – TFP – or multifactor productivity – MFP)? Between 1990 and 2005, TFP grew by an average of 1.20% per year. But between 2006 and 2019 this shrunk to just 0.51% (OECD data).
If they remain unchanged, these rates of annual labor force and productivity growth imply the potential long term real growth rate of the US economy is only about 1.0% per year.
If this is the case, it presents a very troubling picture of the likely future state of “r-g”.
Today, the real cost of government debt (the yield on the 10 year TIP) is 1.67% below the forecast long-term real growth rate of the economy. If the federal government ran a balanced budget from today forward, debt/GDP would decline by just 1.67% per year (in real terms, assuming zero inflation).
Alternatively, if the US doesn’t want to reduce debt/GDP, but instead just wants to keep this ratio constant, it could run annual budget deficits equal to 1.67% of GDP. US nominal GDP is currently about $22 trillion; 1.67% equals annual deficits of up to $367 billion. The last year the federal deficit was below that was 2007.
But if the real cost of government debt returns to 0.97%, and labor force and productivity growth remain unchanged, then “r-g”, will be about equal, and just keeping the debt/GDP ratio constant would require running balanced federal budgets – something the United States has been unable to do for the past twenty years.
As Cochrane euphemistically says, “If the r < g opportunity vanishes while we are still at a high debt to GDP ratio, a sudden fiscal reckoning awaits.”
Whether and when the United States will face this “sudden fiscal reckoning” depends on two critical uncertainties: the future real interest rate on government debt and the nation’s future real GDP growth rate. Let’s look at how they could evolve in the future.
Future Real Interest Rates
In recent years, two popular theories have been offered to explain the decline of real interest rates not just on US sovereign debt, but on the sovereign debt of many other countries as well.
The “Savings Glut” hypothesis claims that falling real rates have been caused by a higher than normal level of desired savings relative to capital investment demand. High level of savings are attributed to a number of causes, including weak government pension plans in many developing nations, and the baby boom generation in developed countries reaching their peak saving years.
In contrast, the “Secular Stagnation” hypothesis claims that low rates are caused by weak investment demand, which in term is attributed to various factors including rising inequality, high debt levels, an increasingly short-term focus by company management teams, legalization of share buybacks, and reduction in government infrastructure investment as social safety net spending has risen.
On balance, the evidence suggests that the Savings Glut hypothesis may have exerted a stronger effect, while Secular Stagnation played a smaller role (see, “Secular Stagnation and Returns on Capital”, by Gomme et al, “Focus on Low Rea Interest Rate Might Be Misplaced” by Crews et al, and “Low for Long? Causes and Consequences of Persistently Low Interest Rates” by Bean et al).
However, two other analyses that use longer data sets cast doubt on both the Savings Glut and Secular Stagnation hypotheses as explanations for the long-term decline in real yields on sovereign debt.
In “Why So Low For So Long? A Long-Term View Of Real Interest Rates” Borio et al analyze a data set for 19 countries that begins in 1870. They conclude that the relative impact of monetary factors in the determination of the real interest rate may have been underestimated.
A much longer data set is used by Paul Schmelzing in his paper, “Eight Centuries Of Global Real Interest Rates, R-G, and the ‘Suprasecular’ Decline, 1311–2018.”
He observes that, “global real rates have shown a persistent downward trend over the past five centuries, declining within a corridor of between -0.9 (safe asset provider basis) and -1.59 basis points (global basis) per annum, with the former displaying a continuous decline since the deep monetary crises of the late medieval “Bullion Famine”. This downward trend has persisted throughout the historical gold, silver, mixed bullion, and fiat monetary regimes, is visible across various asset classes, and long preceded the emergence of modern central banks. It appears not directly related to growth or demographic drivers, though capital accumulation trends may go some way in explaining the phenomenon. But whoever posits particular recent savings-investment dislocations in the context of an alleged “secular stagnation” needs to face the likelihood that such “imbalances” may have been a continuous key driver for five centuries.”
This obviously begs the question of what causal drivers produced this decline in real interest rates across the centuries. Other research offers one hypothesis.
A number of authors have noted the steady increase in the complexity of economic, social, and political organization across the centuries (e.g., “Complexity Rising: From Human Beings to Human Civilization, a Complexity Profile”, by Yaneer Bar-Yam, and “Quantitative Historical Analysis Uncovers A Single Dimension Of Complexity That Structures Global Variation In Human Social Organization”, by Turchin et al).
We also know that increased complexity typically increases uncertainty, which induces predicable effects in humans, including greater social copying and conformity. It is therefore not unreasonable to conjecture that the same increases in complexity that drove faster economic growth (e.g., the “great takeoff” in the growth of GDP/Capita in England after 1750) also increased uncertainty. If the resulting precautionary savings consistently grew faster than investment, that could account for the observed centuries long decline in real rates.
Schmelzing continues, “Similarly, negative long-term real rates have steadily become more frequent since the 14th century, and I show that they affected around 20% of advanced economy GDP over time, a share that has historically risen by 1.2 basis points every year: once more, this suggests that deeply-entrenched trends are at work – the recent years are a mere “catch-up period” in this and a number of related aspects” …
“Whatever the precise dominant driver –simply extrapolating such long-term historical trends suggests that negative real rates will not just soon constitute a “new normal” – they will continue to fall constantly. By the late 2020s, global short-term real rates will have reached permanently negative territory. By the second half of this century, global long-term real rates will have followed.
“The standard deviation of the real rate – its “volatility” – meanwhile, has shown similar properties over the last 500 years: fluctuations in benchmark real rates are steadily declining, implying that rate levels are set to become both lower, and stickier.”
However, other analysts have argued that the steady decline in real interest rates may reverse in the future.
In his paper, Cochrane claims that as the gap between “r” and “g” narrows, and the US gets closer to an explosive debt trap, investors will likely demand higher risk premiums on US Treasury debt, which will increase real rates.
An argument base on the economic impact of aging societies in set forth in the Bank for International Settlements paper “Demographics Will Reverse Three Multi-Decade Global Trends”, by Goodhart and Pradham. The authors claim that, “aging will lower both desired savings and desired investment, but desired savings will fall by more. The resulting imbalance will require the real interest rate to rise for the market to clear.”
They acknowledge that, “This is clearly our most controversial proposition, and much of the pushback we receive is based on the argument that demographics will lower potential output growth, and hence real interest rates. We agree wholeheartedly with the first argument regarding output growth. But we disagree that it will also lower real interest rates. Indeed, there is much less reason to believe the two are connected than many believe…
“Rather than looking for explanations of falling real rates in any one country at a time, the focus needs to be on global factors. Ex post, savings have to equal investment in a closed economy, ie the world. So, if one points to a particular country, say China, where savings have exceeded investment and there is a current account surplus, then by definition there is another country (or countries such as the United Kingdom or United States) where savings have been below investment and there is a current account deficit. What we need to look at is the ex ante desired savings versus investment dynamics on a global scale, and think of the equilibrating price as a global
price.
“Most of the demographics studies that we have seen take one of two routes. One set of studies looks only at national demographic trends and tries to explain wages and consumer price changes through local dynamics. Studies about Japan are the classic example here. The other set includes a model of two or more countries with differing demographic trends that determine local prices, which then impact the domestic and foreign economies. We think both could go a step further and consider truly global labour force dynamics that set global prices. And nothing we have seen pays more than lip service to what we believe is the crucial factor – China…
“Everything about China is enormous; its demographic dynamics have been and remain remarkable, and the consequential movements in its savings and investment ratios have been extraordinary. As China’s labour force dynamics change direction, the savings-investment balance within and even outside China will change as a result.
“Demographics will ensure that China’s extraordinary savings will fall. Prior to modern times, the (relatively few) old in China were cared for in the extended family. But the one-child policy, extended for too long, has meant that support has gotten more and more scarce for the aged. With an insufficient social safety net, personal savings rose to plan for retirement. Add to this the incentive on the managers of state-owned enterprises to retain, rather than pay out, profits, and the explanation of these extraordinary savings ratios becomes clearer.
“What will happen in the future? Although a higher proportion of the old work in Asia than in Europe or North America, increasing longevity will increase the dependency ratio, in China and elsewhere. The result will be a decline in the personal sector savings…
The authors then argue why investment will fall by less than savings, thus driving up real interest rates: “A smaller population naturally requires less investment, but we argue that the reluctance of the old to relocate and corporate behaviour will help explain why investment will remain supported…
“Many expect that as population growth slows down, the demand for housing will decline sharply. However, that does not take into account the elderly’s preferences. As nations become richer, the old stay in their existing homes rather than relocate to their adult children’s homes. Moving is stressful, and those among the old who are homeowners have little incentive to relocate. As the young come of age and gain financial independence, they will not move into existing housing vacated by the elderly, but will move into new homes that have to be built. In our view, a shift in the balance of the population of a given size towards more old and fewer workers will raise, not lower, the desired stock of housing. That will support residential and housing-related investment…
“One aspect of the demographic impact that doesn’t suggest a ready answer is the behaviour of the corporate sector. There are two polar arguments. The popular argument is that the corporate sector will respond to demographic headwinds by slowing down the rate at which it accumulates capital so that the capital/labour ratio falls. Our view is that the corporate sector is likely to respond by raising the capital/labour ratio, i.e., by adding capital to compensate for labour, which is the factor of production that is getting scarcer and more expensive.”
Future Real GDP Growth
Broadly speaking, potential GDP growth is a function of two factors: growth in the labor force, and growth in productivity.
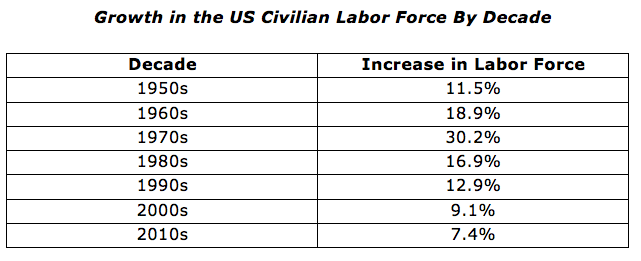
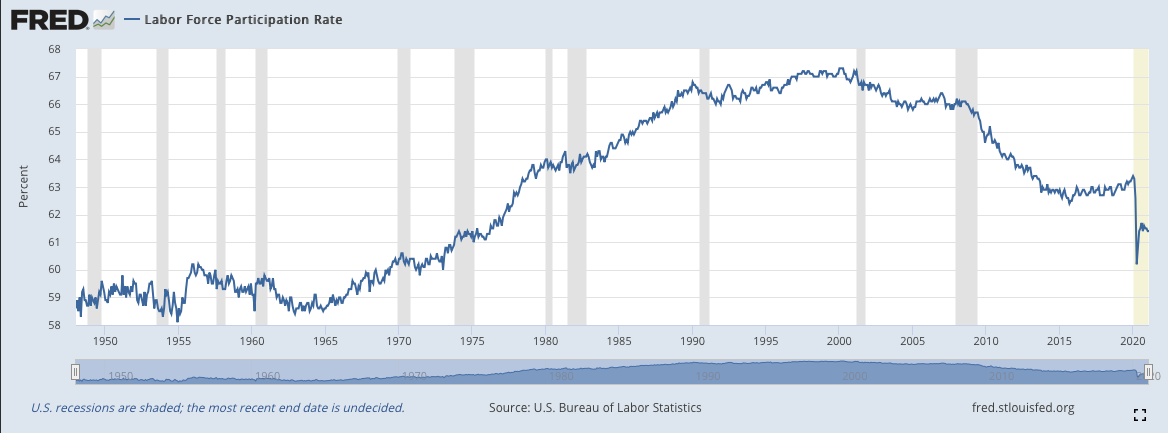
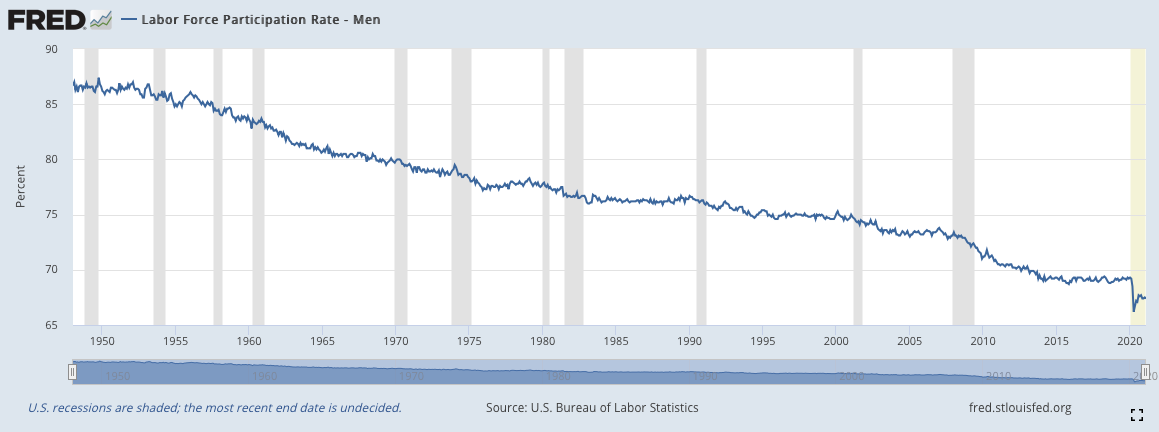
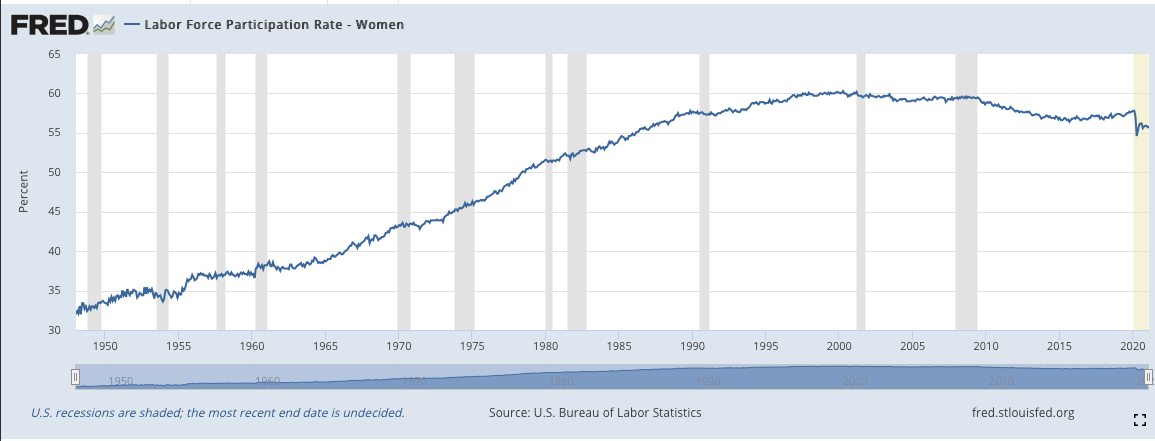
Growth in the labor force is a function of two main variables: (1) The rate at which the civilian labor force is grows, and (2) the “participation rate”, or the percent of the total labor force that is either working or searching for work.
As you can see in the following table, the growth rate of the labor force has been declining:
In recent years, the constraint on growth caused by the slowdown in the rate at which the civilian labor force has been growing has been further compounded by a decline in the percent of working age people who are in the labor force (known as the participation rate), as shown in the following charts:
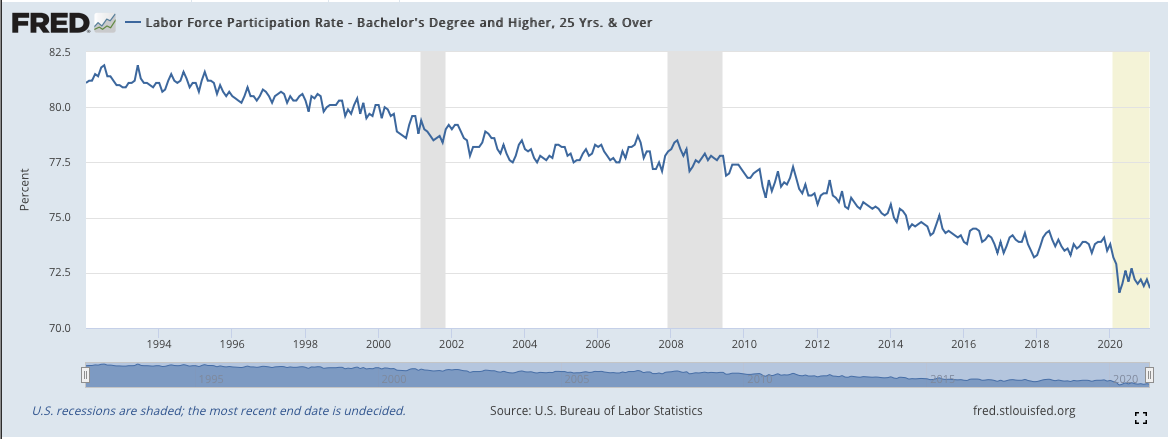
Note that since the mid-1990s, the decline in the labor force participation has affected people with all levels of education, including those with college degrees:
Taken together, the slowing growth in the size of the civilian labor force, along with the falling participation rate, have been putting downward pressure on the potential rate at which the US economy can grow in the future. For example, the Congressional Budget Office forecasts that in the future total work hours in the economy will only grow by 0.50% per year. Their low estimate is 0.40% and their high estimate is 0.80%.
However, the CBO report doesn’t explicitly take into account the impact of improving automation and artificial intelligence technologies, and their increasing deployment in the economy. In the absence of a substantial improvement in human capital quality, this will likely be a two-edged sword – potentially further reducing labor force participation rates while increasing the rate of productivity growth.
In sum, achieving significantly higher rates of productivity growth will be critical to keeping “r” below “g”.
What are the chances that will happen?
Productivity growth measures the increase in output per unit of input over time. It is typically broken down into growth in labor and capital productivity, as well as a residual known as total or multifactor productivity (TFP or MFP), which essentially captures improvements in a range of other factors, including technology, human capital quality, and improvements in the management of organizations.
TFP/MFP growth is critical, because the labor and capital inputs into productivity calculations are based on what can be easily quantified (e.g., hours worked or the value of capital services provided – such as machine hours -- which is assumed to be fixed proportion of the capital stock). As a result, many of the improvements to labor and capital quality are captured in TFP/MFP (e.g., see, “Total Factor Productivity Growth in Historical Perspective”, by Robert Shackleton from the CBO).
Unfortunately, in the United States, and indeed across most OECD countries, TFP/MFP growth has been declining in recent years. OECD data shows that between 1990 and 2005, TFP grew by an average of 1.20% per year. Between 2006 and 2019 this declined to 0.51%.
Data from the US Bureau of Labor Statistics helps explain one of the important causal factors that have been at work: The declining share of US employment in relatively high productivity manufacturing, and the increasing share of employment in sectors where MFP was initially growing much more slowly, and where in recent years it has been negative.
The BLS finds that between 1990 and 2005, the average rate of annual MFP growth in the production of industrial equipment and consumer durables was 3.92%. In other sectors it 0.43%. Between 2006 and 2019, the corresponding MFP growth rates were 2.74% and negative (0.32%).
Whether the US can generate a substantial and sustained increase in TFP/MFP is one of the most critical uncertainties facing the nation. Unfortunately, you wouldn’t know that by looking at what has been happening in many sectors where productivity growth has been minimal or negative.
Two of the largest are healthcare and education. In both of these you see well-organized interest groups defending current business models, regardless of the drag them impose on productivity growth in the US economy. It is a classic case of large negative externalities whose heavy costs are mostly unrecognized, much less priced.
A second hypothesized cause of the slowdown in TFP growth has been talent scarcity due to stagnant education results at a time when technology has been growing more sophisticated. Effectively using that technology requires employees with more knowledge and skill. Unfortunately, neither the education system nor initiatives to “reskill” existing employees has been meeting demand. This has limited the diffusion of the most advanced (and productivity boosting) technologies, and widened the competitive advantage of companies that can attract employees with scarce knowledge and skills.
A third possible cause for the slowdown in TFP growth has been identified by Stanford’s Erik Brynjolfsson. He argues that some of the delay in TFP has been due to the same type of “J-Curve” phenomenon we saw in the 1990s during the last big wave of new technology adoption. Back then the full productivity benefits of new technologies didn’t appear until companies made very difficult organizational changes to their structures, processes, and staff – a difficult process that typically takes longer than most people expect. To some extent, that is also true today.
A fourth hypothesized cause of slow TFP growth has been a relatively weak level of business investment (e.g., in advanced capital goods and digital technologies) due to continuing high levels of uncertainty about future demand growth (e.g., due to rising inequality and high levels of outstanding debt in the private sector). Instead of investing in expanding and upgrading production capacity, companies have instead given substantial amounts of money back to their shareholders, especially via stock buybacks.
Conclusion
For people too young to remember Tim Congdon’s 1989 warning about “The Debt Threat”, John Cochrane has provided a very timely new reminder about the critical relationship between the real interest rate on a government’s debt, and the real rate at which its economy grows.
The following table shows different scenarios that are driven by the average 10 Year TIP yield (i.e., the real rate of interest on government debt) and the growth of total factor productivity over the next five years.
Each scenario also shows the maximum deficit the federal government could run while keeping the debt/GDP ratio constant. Finally, we note our current subjective probability estimate that each scenario will develop over the next five years.
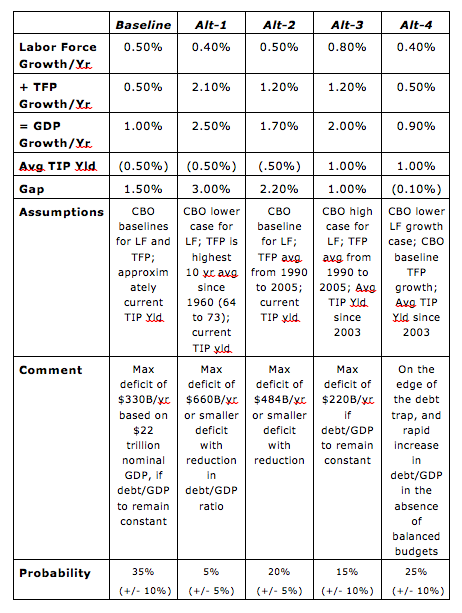
If real rates stay low while productivity growth regains the heights it reached in the 60s and 90s, there is a high probability that the Normal regime will emerge and be sustained. But if the opposite happens (the real rate increases while productivity continues to stagnate), the probability of the Persistent Deflation and, at some point (assuming a more attractive alternative to the US dollar is available) High Inflation regimes increase.
Finally, we’ll leave you with some parting words of wisdom from John Cochrane: “If our fiscal situation is so dire, why do bond investors still lend money to the government at astonishingly low rates?
“First, recall that bond markets have never seen trouble coming, or waning. They did not see inflation in the 1970s, they did not see disinflation in the 1980s, they did not see Lehman or Greece coming… Surely the USA will not borrow and spend itself into a debt crisis.
“Fixing our structural budget problems is not hard as a matter of economics, or, really, once everyone recognizes it has to be done, as a matter of politics. I hazard bond markets assume the US will, as usual, get around to doing the right thing after we try everything else. Let us hope so.”
This Month’s Regime Forecasts
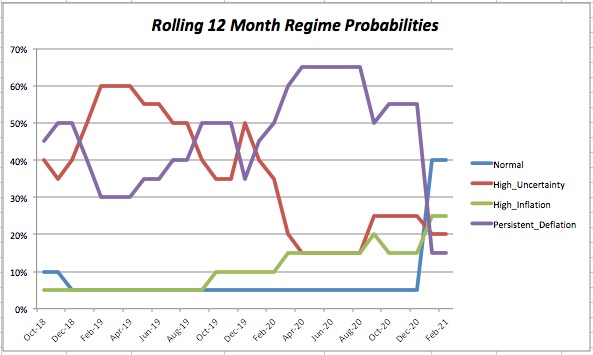
Our 12-month regime forecast probabilities remain unchanged from last month.
In light of the size and composition of the Biden stimulus package, and the progress of COVID vaccination programs, we forecast that the probability of being in the Normal Regime 12 months from now is 40%. Based on the assumption that COVID’s negative impact on supply capacity will not recover quickly, there is a 25% probability that 12 months from now we could be in the High Inflation Regime.
However, that high inflation is almost certain to have a negative impact on equity and debt valuations, which could slow spending and increase business insolvencies. The speed at which this could happen, and uncertainty about the depth and breadth of its cascading impact across a complex global economy leads to our forecasts of a 20% probability of being in the High Uncertainty Regime 12 months from now, and a 15% probability of being in the Persistent Deflation Regime (which assumes faster and deeper negative effects).
Our 36-month forecast reflects two main analytical results. The first is last month’s assessment of the 30% probability that over the next three years, the Biden Administration will avoid seven possible crises (a feat which would result in the Normal Regime):
(1) An increase in inflation, and the popping credit and equity market bubbles rising rates would very likely trigger;
(2) A US sovereign debt and/or dollar crisis (though the latter would also require a more attractive new currency home for investors fleeing the dollar, which at this point seems unlikely);
(3) An LDC debt crisis, due to heavy corporate borrowing in foreign currency;
(4) A Eurozone sovereign debt crisis, most likely triggered by Italy;
(5) A severe private sector solvency crisis, as the government support that enabled many companies to survive during the pandemic is withdrawn but the economy remains weak;
(6) SARS-CoV-2 mutations that significantly reduce vaccine efficacy, forcing another return to lockdowns (as we have recently seen in the UK and EU);
(7) A violent conflict between the US and China (most likely over Taiwan), or between the US and/or Israel and Iran
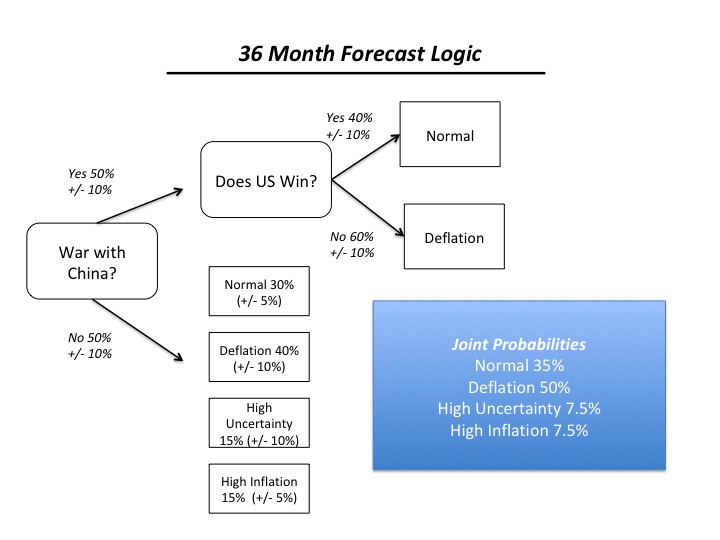
The second is the result of this month’s feature article, which uses new evidence to update last October’s assessment of the likelihood that war between the US and China could break out over Taiwan at some point over the next 36 months, and the potential results if it does. We estimate that the probability has risen to 50% (as the Financial Times’ John Dizard recently observed, “War risk is consistently underestimated by money people”).
Combining the two assessments yields the following probabilities for our four global macro regimes:
This not only slows the diffusion of new information throughout social systems like economies and financial markets, but also causes these systems to coalesce around a small number of narratives. However, as tension increases on various fault lines in the global macro system, the dominant narrative or narrative grows increasingly fragile.
Under these conditions, rapid, non-linear changes are very likely to occur, that are out of proportion to the apparent trigger that sets them off.
Forecast Logic: Quantitative Indicators
Implications of the Most Recent Three Month Asset Class Returns
Our forecasting methodology also includes quantitative analyses of asset class valuations, market stress indicators, and the level and change in three-month returns, over the most recent and previous three-month periods, for those asset classes, which should perform best under different regimes (in this sense, our regimes can be regarded as macro factors).
We assume that that the rolling three month returns reflect investors’ views regarding the relative probability that a given macro regime will develop in the future.
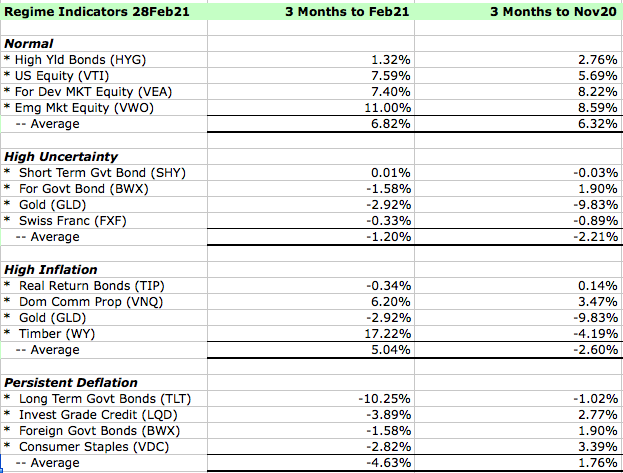
On a 12-month time horizon, we don’t disagree with the regime forecasts implied by recent market returns. At a 36-month time horizon, we think the market’s current expectations are overly optimistic.
Asset Class Valuation and Momentum Indicators (@28Feb21)
| Asset Class (ETF) | Valuation | 1 Month Return | Conclusion |
| US Real Return Govt Bond (TIP) | Likely Overpriced* | (1.69%) | Decreasing Overvaluation |
| US Nom Return Govt Bond (GOVT) | Likely Overpriced* | (1.84%) | Decreasing Overvaluation |
| US Investment Grade Credit (LQD) | Likely Overpriced* | (2.26%) | Decreasing Overvaluation |
| US High Yield Credit (HYG) | Almost Certainly Overpriced* | (0.24%) | Decreasing Overvaluation |
| US Commercial Property (VNQ) | Within Fairly Priced Range* | 3.43% | Fairly Valued |
| US Equity (VTI) | Almost Certainly Overpriced* | 3.14% | Increasing Overvaluation |
| Foreign Devel Mkt Equity (VEA) | Likely Overpriced* | 2.43% | Increasing Overvaluation |
| Emerging Markets Equity (VWO) | Almost Certainly Overpriced* | 1.57% | Increasing Overvaluation |
| Timber (WY) | Likely Underpriced | 8.59% | Decreasing Undervaluation |
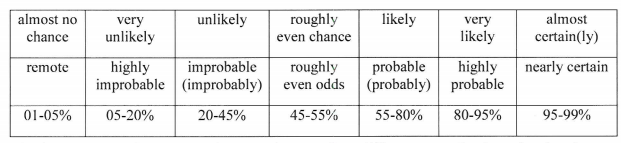
Note: The language we use to describe our estimated likelihood of asset class over or undervaluation is based on US Intelligence Community Directive 203 on Analytic Standards, which includes the following table:
Market Stress Indicators (@28Feb21)
| Market Stress Indicator | This Month vs Last Month |
| Asset Class Returns Autocorrelation (this month versus last month). Higher autocorrelation is an indicator of more tightly coupled and fragile markets. | .19 versus .30 the previous month. This indicates a declining level of market stress. |
| Economic Policy Uncertainty Index (how many days over the last 30 was index in top quartile of values since 1985?). A higher number equals more market stress. | On 21 days last month the index was in the top quartile of daily values since 1985 (the 93rd percentile of all rolling 30-day periods), a slight decrease from 27 days last month. |
| AAA Rated Bonds Spread over 10 Year Treasury Yield (month end). Higher spreads indicate rising concern about market liquidity. | 1.42% (58th percentile since 1983), essentially unchanged from last month. |
| BB Rated Bonds Spread over 10 Year Treasury Yield (month end). High spreads indicate increasing credit risk. | 2.58%, (29th percentile) down from 2.80% (37th) last month, indicating a low level of stress. Given our Regime forecast, this is almost certainly inadequate compensation for the risk being taken with BB rated bonds. |
| Gold Price per Ounce in US Dollars (month end). Rising gold prices are an indicator of increasing market uncertainty and stress. | $1,765 versus $1,852, down (4.7%) from the previous month. At the end of 2017, we estimated the “disaster premium” in the gold price was 47% (see our methodology in the Appendix). At the end of last month it was 83%, down from 90% the previous month. Given our forecast, this seems far too low. |
Portfolio Allocation Implications of Our Forecast
We take two approaches to deriving the tactical asset allocation implications from our analyses (i.e., deviations from our "neutral" or base case model portfolio).
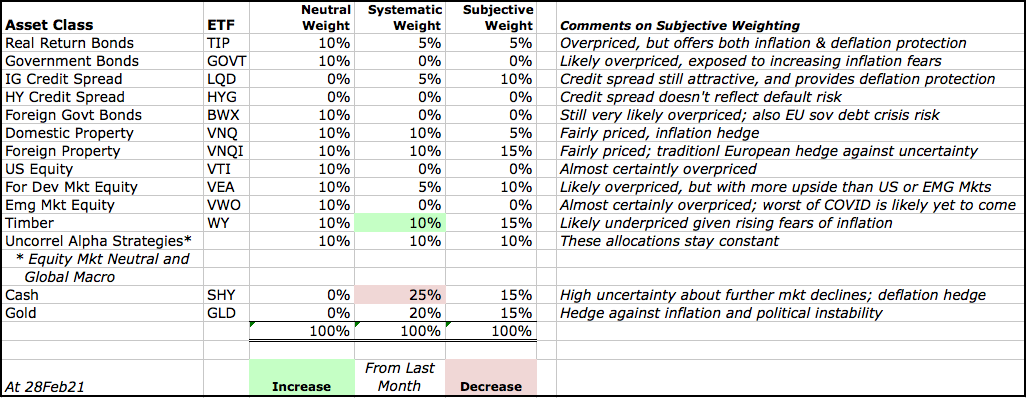
The first takes a systematic approach, and is based on relative asset class valuations. Our starting point is our neutral model portfolio, which is equally weighted across nine broad asset classes, and also includes 5% allocations to alpha strategies (equity market neutral and global macro) that are designed to have a low correlation to returns on broad asset classes.
Based on asset class valuations, we systematically vary the asset class weights (but not the active strategy weight), increasing from 10% to 15% when an asset class is likely undervalued, and 15% when it is very likely undervalued. In the case of overvaluations, we go to 5% and then into cash, if there are no undervalued asset classes with room for an increase. In effect, this replicates the systematic rebalancing strategy we used for 15 years in our previous model portfolios.Based on subscriber requests, this month we are re-introducing a feature from the previous version of The Index Investor: Tactical Asset Allocation Implications from our analyses.
The second tactical approach is based on our subjective view not only of current asset class valuations, but also of the implications of the broader macro trends and uncertainties that we analyze each month. Importantly, this subjective view reflects our primary goal of avoiding large downside losses, rather than seeking large upside gains.
Three final notes: First, with respect to US fixed income, we include credit products (investment grade and high yield) in the same asset class as government debt, and will shift into the former when their valuations become attractive.
Second, we regard gold not as a separate asset class to be held long-term, but rather as a complement to cash, into which we shift in periods of substantial overvaluation across multiple asset classes.
Third, we continue to be deeply concerned by the distortion in asset class valuations that have been created by negative real interest rates on sovereign bonds, which are the foundation of most asset pricing models. In August, we decided to address this distortion by using in our asset class valuation models our estimate of the economically logical real yield on inflation protected US government bonds (TIPs). This brings our quantitative valuation conclusions much closer to those based on our qualitative analysis.
More information about our investment beliefs, including our core philosophy, approach to asset allocation (including our model portfolios and their long-term track record), and views on various approaches to active and passive management can all be found here.
Here is our latest asset allocation view:
Pre-Mortem Analysis
One of the most important forecasting disciplines is to ask yourself why your forecast could be wrong. Dr. Gary Klein’s research has shown that a very powerful and insightful way to do this is via a “pre-mortem analysis.” This method asks you to assume that it is a point in the future, and your forecast has been proven wrong (or your strategy or company has failed). You are then asked to look backward from this imagined point in the future, to explain why you failed, what you missed, and what you could have done differently to avoid your fate.
The pre-mortem method takes advantage of the fact that humans reason much more concretely and in more detail when explaining the past than they do when trying to forecast the future.
So let us assume that it is one year from now, and our current forecast has turned out to be wrong.
How did this happen? What developments did we fail to anticipate?
- Following the election of Joe Biden, the removal from office Xi Jinping could lead to a reduction in the dangerously growing conflict between the US and China. The impact of this surprise seems uncertain. To the extent that reduced external threat reduces the perceived urgency of implementing structural reforms in the US, it would increase the probability of the High Inflation Regime. Yet at the same time, it could accelerate economic and political reforms in China, which would increase economic growth there, creating a more dangerous medium term situation for the United States.
- A supply side shock of some type – beyond the disruption of global supply chains caused by COVID-19 -- could produce a sudden increase in inflation. The most likely scenario is a reduction in oil supplies due to a prolonged kinetic conflict between Iran and the US. An unlikely scenario could be major crop failures associated with the next solar cycle, which NASA forecasts will be the weakest in 200 years. McKinsey recently concluded that the probability of such a failure has increased due to changes in the environment, and now stands at about 10% over the next five years ("Will the World’s Breadbaskets Become Less Reliable?”).
Note: Combining Our Forecasts with Others From Other Sources and Extremizing the Result Should Increase Your Predictive Accuracy
Research has found that three steps can improve forecast accuracy. The first is seeking forecasts based on different forecasting methodologies, or prepared by forecasters with significantly different backgrounds (as a proxy for different mental models and information). The second is combining those forecasts (using a simple average if few are included, or the median if many are). The final step, which significantly improved the performance of the Good Judgment Project team in the IARPA forecasting tournament, is to “extremize” the average (mean) or median forecast by moving it closer to 0% or 100%.
Forecasts for binary events (e.g., the probability an event will or will not happen within a given time frame) are most useful to decision makers when they are closer to 0% or 100% than the uninformative “coin toss” 50%. As described by Baron et al in “Two Reasons to Make Aggregated Probability Forecasts More Extreme”, forecasters will often shrink their probability estimates towards 50% to take into account their subjective belief about the extent of potentially useful information that they are missing.
When you average multiple forecasters’ estimates, you are including more information, which should increase forecast confidence and push the mean estimate closer to 0% or 100%. However, this doesn’t happen when you use simple averaging. For this reason, forecast accuracy is increased when you employ a structured “extremizing” technique to move the mean estimate closer to 0% or 100%.
You can download an extremizing model from our website to use when combining the forecasts you use in your decision process.
The extremizing factors in our model are those that the Good Judgment Project found maximized the accuracy of combined forecasts. Note that the extremizing factor is lower when average forecaster expertise is higher. This is based on the assumption that a group of expert forecasters will incorporate more of the full amount of potentially useful information than will novice forecasters.
Feature Article: The Probability of a US-China War Over Taiwan Is Increasing
One of my favorite quotes about its root cause comes from Thomas Schelling: “There is a tendency in our planning to confuse the unfamiliar with the improbable. The contingency we have not considered seriously looks strange; what looks strange is thought improbable; what is improbable need not be considered seriously.”
At the turn of the 20th century, the world economy had reached unprecedented levels of integration, with international trade at an all-time high. This led many to believe that war was unthinkable, because its economic costs would be so high. Yet World War One still occurred.
In 2019, the value of goods and services trade between the US and China was over $600 billion; between the EU and China it was closer to $700 billion. Once again, many people believe that China would not go to war over Taiwan because the potential economic costs would be too high. Unfortunately, accumulating evidence suggests a rising probability that they are wrong.
Specifically, four developments have caused us to change the forecast we made last October (“Will Xi Jinping Launch a Surprise Attack on Taiwan Before the 20th Party Congress of the CCP in November 2022? And What Happens if He Does?”):
1. The surprise declassification in January (shortly before the Trump administration left office) of the “US Strategic Framework for the Indo-Pacific Region.”
2. Publication of “Xi Jinping’s Conception of Socialism” by Charlie Lyons Jones of the Australian Strategic Policy Institute (ASPI).
3. January changes to China’s National Defense Law.
4. Testimony given at the US China Economic and Security Review Commission’s February hearing on “Deterring PRC Aggression Towards Taiwan.”
US Strategic Framework for the Indo-Pacific Region
This document contains the following points about China:
• Under “National Security Challenges” – “How to maintain US strategic primacy in the Indo-Pacific region and promote a liberal economic order while preventing China from establishing new, illiberal spheres of influence...
• Under “Assumptions”:
- “Loss of US preeminence in the Indo-Pacific would weaken our ability to achieve US interests globally.”
- “Strategic competition between the United States and China will persist, owing to the divergent nature and goals of our political and economic systems. China will circumvent international rules and norms to gain an advantage.”
- “China aims to dissolve US alliances and partnerships in the region. China will exploit vacuums and opportunities created by these diminished bonds.”
- “Chinese economic, diplomatic, and military influence will continue to increase in the near-term and challenge the US ability to achieve its national interests in the Indo-Pacific region.”
- “China seeks to dominate cutting-edge technologies, including artificial intelligence and bio-genetics, and harness them in the service of authoritarianism. Chinese dominance in these technologies would pose profound challenges to free societies.”
- “China’s proliferation of its digital surveillance, information controls, and influence operations will damage US efforts to promote our values and national interests in the Indo-Pacific region and, increasingly, in the Western Hemisphere and at home.”
- “China will take increasingly assertive steps to compel unification with Taiwan.”
Xi Jinping’s Conception of Socialism
“Is Xi Jinping more Hitlerian or Stalinist in his view of Chinese socialism? The answer to that question is important because it bears on the policy choices China’s adversaries will need to make.
“George Kennan, the godfather of America’s policy of ‘containment’ of the Soviet Union, made clear in his 1946 ‘long telegram’ that Adolf Hitler’s vision of ‘national socialist’ modernity wasn’t a force that could be contained; the reason was that Hitler had a timetable according to which the Third Reich was to achieve global domination and his strategy could be thwarted only by annihilating Nazism by means of total war. The Soviet Union, in contrast, could be contained through Western domestic resilience and a resolve to counter territorial revanchism. That was because Joseph Stalin had in mind no specific time by which the world would need to reach the communist phase of development.”
“Precisely where Xi Jinping sits on the spectrum of totalitarianism is a matter of dispute. Elements of Xi’s ideology are notably Hitlerian. His ambition to achieve ‘the great rejuvenation of the Chinese nation’ introduces a nationalist character to the Chinese Communist Party’s understanding of socialism. Unifying China and Taiwan is one revanchist mission driving Xi’s ‘great rejuvenation’, but revanchism is only one part of the nationalism Xi has begun to emphasise in CCP ideology—militarism and capitalism are the others…
“The party has allowed China to undergo capitalist industrialisation since Deng Xiaoping, having repudiated Maoist collectivisation, but remained committed to a strong supervisory state. The political economy Xi has inherited is thus similar to the economic structure Hitler presided over in the Third Reich. The problem for the CCP, however, is that China’s state-supervised yet market-oriented economy necessarily repudiates any notion of socialism being driven by Marxism. To a political party that supposedly follows traditional Marxism-Leninism, that contradiction constitutes an existential threat. The way to negate it, for Xi, is to unify ‘state and race’ by integrating nationalist notions of China’s ‘great rejuvenation’ into CCP ideology. China’s economic model has forced Xi to take a leaf out of Hitler’s book…
“Xi views leadership in terms of a sacred bloodline and believes nationalism to be essentially ethnic. He probably sees the nationalisation of socialism as his personal mission on behalf of the Chinese nation.
“National socialist images of a sacred bloodline have now become a feature of CCP ideology … The national socialist mission of unifying race, party, nation and state seems to have taken on singular import for the CCP, while its Leninist role of securing a path to communism has been subordinated. Nationalism is no longer a necessary step on the road to communism, but the driving force behind Chinese socialism…
“The CCP’s role in securing China’s path to communism is being subordinated to Xi’s vision for China’s nationalist resurgence. The likeliest result of this phenomenon is a less patient, more erratic and risk-hungry foreign policy. Indeed, the prominence of Beijing’s ‘wolf warrior’ diplomats and the CCP’s track record of economic coercion are good indicators that Chinese foreign policy is already taking on that distinctly Hitlerian quality.”
January Changes to China’s National Defense Law
• Changes to the National Defense Law have transferred important powers from civilian officials (the State Council) to the military (the Central Military Commission).
• The CMC is led by Xi Jinping. After the changes, it now has full power to mobilize military and civilian assets to defend national interests both within China and abroad. The Chinese military is now completely under Xi.
• For more discussion on these changes, see “China’s Updated National Defense Law: Going for Broke”, by Ben Lowsen of the Jamestown Foundation
Hearing on Deterring PRC Aggression Towards Taiwan
Testimony by Lonnie Henley, retired Defense Intelligence Officer for East Asia at the Defense Intelligence Agency
• “The PLA has systematically built the capabilities they believe they need for a war with the United States over Taiwan. They probably have achieved initial capability.
• “A failed Taiwan landing would not end the war. The Communist Party (CCP) leadership could not afford to accept defeat. The passions aroused by the war itself and by the propaganda effort in support of the war would not allow the Party to stop short of a political outcome they could credibly sell as a victory. China would continue the conflict by whatever means available, primarily blockade. The PLA would have the advantage in that extended phase of the conflict even after severe losses.
• “Most of the operational approaches available to US forces would not serve to end the war.
- Defeating the amphibious landing
- Destroying the PLA Navy and Air Force
- Cutting off China’s international trade
- Trying to spark internal unrest or crises on China’s periphery
- Other “cost imposition” strategies
• “Penetrating a Chinese blockade of Taiwan would be a slow, grinding battle stretching over many months… If we cannot defeat the blockade, we will not prevail.
• “Taiwan’s will to resist is vital but unknowable. Equally vital, and knowable but inexcusably not known, is their ability to endure a long-term blockade and what they would need to survive.
• “The military center of gravity of this conflict is the PLA integrated air defense system in southeast China. If we can disable that, we can win militarily. If not, we probably cannot…
• “Over many years of participating in Taiwan Strait war games and tabletop exercises, I observe that Taiwan’s air defenses are almost always disabled within the first few days of the conflict, but China’s integrated air defense system (IADS) along the Taiwan Strait remains effective for as far into the conflict as the exercise examines. This in turn limits the United States to long-range stand-off weapons or precision-strike incursions by stealth platforms. I assume I am not the only person to have observed this and that US forces are working on the issue.
• “Success in this area would have the greatest impact on the overall conflict, more even than finding a way to defend US air bases from Chinese missile strikes. Poorly defended bases will still generate some combat sorties, particularly as the conflict drags on and the Chinese expend their inventory of theater-range missiles. But a functioning air defense network greatly reduces the impact those sorties can have. Conversely, defeating the Chinese IADS would open the door to the kind of air campaign that has proven decisive against less capable opponents.
• “More specifically, enabling US air operations over the Strait would be our best hope for getting cargo into Taiwan’s western ports. The PLA’s short-range anti-ship assets can be extremely effective under a tight air defense umbrella, but much less so in the glare of US air power. The PLA air blockade, meanwhile, simply ceases to exist without the IADS.
Testimony by Oriana Skylar Mastro, Center Fellow, Freeman Spogli Institute for International Studies, Stanford University. She also serves in the Air Force Reserve, as a strategic planner for the US Indo-Pacific Command
• “Cross-strait deterrence is arguably weaker today than at any point since the Korean War. Impressive Chinese military modernization, U.S. failure to build robust coalitions to counter Chinese regional aggression, and Xi Jinping’s personal ambition, all coalesce to create a situation in which Chinese leaders may see some aggregate benefit to using force. I support this assessment.
• “The most realistic pathway to conflict used to be that Taipei or Washington crosses a redline that precipitates conflict. For example, if Taiwan were to declare independence, China would undoubtedly use force to reverse the decision, potentially even using the opportunity to push for ‘reunification.’ In case we needed reminding, the Chinese Ministry of Defense clearly stated on January 28, 2021 that “Taiwan independence means war.”
• “But the basic argument in my testimony is that the situation has changed. The greatest threat now is that Beijing will launch a military operation to force ‘reunification,’ irrespective of Washington’s or Taipei’s policies or actions. Specifically, I believe Xi Jinping will use force to compel Taiwan to unite with the mainland once he is confident in the Chinese military’s ability to succeed in relevant joint operations, like an amphibious attack…
• “Because of [organizational] reforms [focused on improving the ability to conduct joint operations] and the modernization of Chinese equipment, platforms, and weapons, China may now be able to prevail in cross-strait contingencies even if the US intervenes in Taiwan’s defense. China’s improved anti-access/area denial capabilities and its strides in cyber and artificial intelligence also contribute to the weakening of cross-strait deterrence. In the words of Michèle Flournoy, ‘In the event that conflict starts, the United States can no longer expect to quickly achieve air, space, or maritime superiority.’ As Beijing hones its spoofing and jamming technologies, it may be able to interfere with US early warning systems and thereby keep US forces in the dark. Worryingly, other analysts have concluded that Chinese interference with satellite signals is only likely to grow more frequent and sophisticated.
• “China also possesses offensive weaponry, including ballistic and cruise missiles, which if deployed, could destroy US bases in Western Pacific in days. Finally, the US intelligence community warns that, “China has the ability to launch cyber attacks that cause localized, temporary disruptive effects on critical infrastructure—such as disruption of a natural gas pipeline for days to weeks—in the United States.”
• “Because of these aforementioned capabilities, many US experts are concerned with a fait accompli, a scenario in which China takes Taiwan before even the most resolved United States could act decisively. Recent war games jointly conducted by the Pentagon and RAND Corporation have shown that a military clash between the United States and China over Taiwan would likely result in a US defeat, with China completing an all-out invasion in a matter of days.
• “In the end, Chinese perceptions of their likelihood of victory are more important than the reality in determining if they use force. It is not a good sign that Chinese sources express an increasing confidence that the PLA is well prepared for potential military confrontation with the United States over the Taiwan issue. The multiple large-scale military exercises (at least nine) conducted simultaneously in the Yellow Sea, the South China Sea, and the Bohai Gulf by the PLA in August 2020 are considered a credible demonstration of its ability to conduct complex, intense joint operations. While Chinese strategists acknowledge US military superiority generally, the conventional wisdom is that China’s proximity to Taiwan, corresponding access to operational resources and resolute stance, makes the local balance of power favorable to Beijing.
• “The bottom line is that for the first time in Chinese history, Xi will believe that he has at his disposal a military capable of forcing unification. While many Western observers think China will be able to do so in the next five to eight years, Chinese military leaders have told me that they will be ready within a year. It is telling that, in Xi’s first order to China’s armed forces in 2021, he emphasized the importance of “full-time combat readiness” and said the PLA must be ready to “act at any second”…
• If Beijing thinks the US will intervene on Taiwan’s behalf, then time becomes crucial. Chinese military strategists believe that if you let the United States fight the way it is used to, which includes time to mobilize and amass firepower in theater, then victory is unlikely.
• “Thus, if Chinese leaders believe the US is likely to intervene, they are more likely to move quickly to the highest level of violence that the scenario requires to force Taiwan’s capitulation to Beijing’s demands before the US can intervene. If China’s objective in the scenario is unification (versus punishing Taiwan or compelling a reversion to the status quo) and it expects US intervention, then it could even preemptively hit US basing in the region to cripple Washington’s ability to respond.
• “In other words, US deterrence and defense are working at cross purposes. The more credible our resolve to fight, the more likely Chinese leaders are to escalate rapidly and hit US forces in the region in their opening salvo – thus making a US victory less likely. But if there is a possibility that the United States will stay out, Chinese strategists would avoid such a move, as it would inevitably bring the United States into the war. In this scenario, as China focuses on compelling Taiwan’s capitulation at lower levels of violence, the United States would have time to mount an adequate defense” …
• In response to Commission members’ questions about Mastro’s testimony, she acknowledged that since the United States’ place in the world would be at stake if China invades Taiwan, Chinese leaders almost certainly assume that the United States will intervene. While on one hand this would argue for a very strong “first strike” attack by China on the United States, Mastro also noted that Chinese leaders are well aware of the reactions that followed similar surprise attacks on Pearl Harbor and 9/11.
• Elsewhere, Mastro has written about the challenges China would likely face in trying to limit the escalation of violence once a war with the United States had begun (e.g., “Can China Stop Wars Once They Start?”).
• “The United States does not usually accept a return to the status quo antebellum after blood has been spilled. If China uses force against Taiwan, US leaders may want a war termination settlement that sufficiently punishes Beijing for this action—likely by demanding concessions on Taiwan’s political status that Beijing will not make. In this scenario, Beijing will turn to its tendency for disproportionate escalation to bring about an end to the war on its terms. China will start by increasing the costs on US military forces in the region; if that does not work, they will consider civilian targets in the United States. However, due to range limitations (China has limited conventional options25 for hitting the US homeland), this is more likely through nontraditional means like cyber or counterspace attacks. This is one of the few scenarios in which the leadership may consider using nuclear weapons, though I do not believe they would use nuclear weapons first.
• “Maintenance of the status quo is no longer desirable for Chinese leaders. Xi has publicly called for concrete movement toward ‘reunification,’ an explicit demand that stakes his legitimacy on progress in that direction. By doing so, he moved the goalpost from preventing Taiwan independence, which means living with the 40-yearlong status quo, to an actual change in the nature of the cross-strait relationship, which is substantially less achievable without the use of force. Xi Jinping has stated multiple times his position that his program of national rejuvenation cannot be complete without ‘reunification.’ His ambition to “resolve the Taiwan issue” during his tenure is common knowledge among the Chinese people. Xi has also expressed in various ways that he is more willing than his predecessor, Hu Jintao, to use force. Additionally, in a major speech, Xi articulated that “the long-existing political discrepancy is the root cause of cross-Strait instability, it cannot go on generation to generation.”
• “Xi also seems to be ruling over an increasingly impatient Chinese population. A recent Global Times poll revealed that around 70 percent of mainlanders support war to unify Taiwan, and 37 percent of them think it best if war occurs in three to five years. (The next most popular answer is one to two years, with only approximately 10 percent saying unification can wait for more than 10 years.) Furthermore, 64 percent of mainlanders anticipate a full-scale war to unify Taiwan, and 72 percent of them think China would definitely win. Luo Yuan, a major general in the Chinese military, recently said that China’s leaders “can only follow the will of all Chinese nationals [and] realize reunification by force,” should Taiwan refuse to cede to Beijing’s leadership.
• In response to Commission members’ question about her testimony, Mastro made a critical point: “Military success is not the criteria for success in the Chinese view of the world. The key question for them is can the application of military force achieve our strategic objectives?” From this perspective, and given his personal ambitions, Mastro noted that Xi Jinping might see significant military losses as being worth the political benefits of conquering Taiwan by force (not to mention the very substantial negative impact this would have on limiting the United States’ access to advanced semiconductor chips produced by in Taiwan Semiconductor Manufacturing Company’s (TSMC) fabs on the island. Xi is also very likely to be tempted by the potential benefits of imposing a military defeat on the United States, which would make China the de facto hegemon of Asia.
• Mastro concluded that, “When Xi Jinping is confident that his military can win a war across the strait, I think he’s going to go for it… The key is reducing his confidence that he can win… Our number one concern today is not deterring China; it’s deterring Xi.”
Testimony of Mark Cozad from The RAND Corporation
• Cozad argues that, “even though Beijing’s confidence in all elements of PRC national power has increased significantly over the past two decades and continues to grow, Chinese political leaders probably remain cautious about the PLA’s ability to execute high-intensity operations, most notably a major campaign to force unification with Taiwan. Even though the PLA has made great strides over the past two decades, military publications, official statements, and reform programs suggest that its modernization has not progressed as rapidly as Beijing thinks necessary in several areas critical to fighting modern wars.”
• In particular, while the PLA has made substantial progress in upgrading its doctrine and equipment, “Beijing remains concerned about the PLA’s overall level of experience and proficiency [particularly in conducting joint and amphibious operations]… PLA self-evaluations often address qualitative concerns, such as personnel quality, decision making, reliability, and command. These evaluations deal heavily with internal PRC and PLA issues of demographics, organizational culture, and differing cognitive styles… PLA modernization imperatives—such as informatization, jointness, and systems warfare—cannot be realized without qualitative intangibles, such as capable personnel and efficient, effective command.”
• “Based on the nature of PLA weaknesses, a key question in our understanding of China’s calculations regarding the use of force against Taiwan is how Beijing’s views of the PLA’s weaknesses might shape or constrain its decision to take military action against the island.”
• In their discussion of Cozad’s testimony, Commission members agreed that a critical indicator would be any successful small-scale “real world” demonstration by China of its amphibious and joint operational capabilities, which would serve as a test run for a much larger invasion of Taiwan. A likely candidate would be a Chinese amphibious attack to retake small islands that Vietnam claims and has fortified in the South China Sea.
Conclusion
In our October 2020 feature article, we asked, “What Is The Probability That China Will Launch A Surprise Attack On Taiwan Before The 20th Congress Of The CCP In 2022?”
We concluded then that there was a 25% probability that China would attack Taiwan before the 20th CCP Congress, which is scheduled for November 2022.
Based on the latest evidence, we now estimate that the probability has significantly increased to 50% (+/- 10%) between now and March 2024.
It is almost certain that the increasing risk of war between the United States and China is not fully reflected in asset class prices today. For example, Chinese equities account for almost 40% of the MSCI Emerging Markets Index today.
In terms of our macro regime probabilities and their implications for portfolio asset allocation, an increasing likelihood of a Chinese attack on Taiwan should initially lead to a relative increase in the probability of being in the High Uncertainty regime.
Once the war begins, and assuming it results in severe disruption of supply chains and capital flows, there would likely be an initial burst of shortages and inflation in some product categories (the largest US imports from China are electronics, such as computers, cellphones, and related products). However, this would also be accompanied by a sharp reduction in private consumption and investment spending.
What comes next likely depends on the nature of the war. If the war begins with a surprise Chinese attack on broad range of US assets, including civilian assets located in the United States (e.g., pipeline and power grids), causing significant loss of life, it would, like Pearl Harbor and 9/11, almost certainly trigger a sustained national mobilization. If the US defeats China, this would very likely lead to an eventual transition from the High Uncertainty to the Normal regime.
However, if the US suffers a defeat in the Western Pacific, a global crisis of confidence in the United States would ensure, and the slump in private consumption and investment spending would almost certainly deepen, leading to increased insolvency problems, and likely a transition to the Persistent Deflation regime. Whether the very substantial increase in national anger, will, and defense spending and the accelerated replacement of foreign supply chains following a defeat would be sufficient to escape this deflation is a toss-up.
In sum, we are almost certainly entering a period of substantially higher uncertainty that has not yet been recognized by investors and reflected in asset class valuations.
High Value Information Observed In February 2021
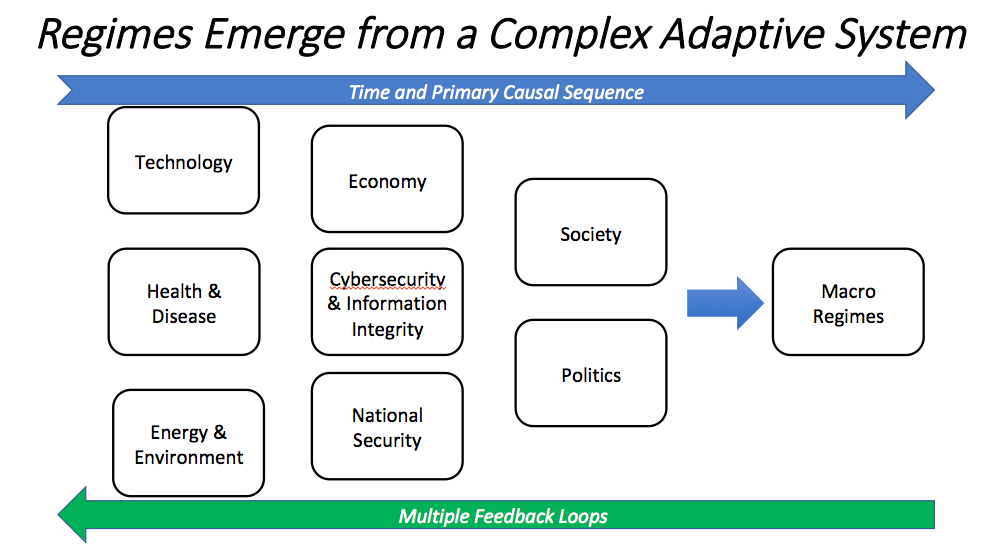
In our model of the complex global macro system, change drivers are arrayed across a roughly chronological process (albeit one with many feedback loops), in which technological, health, and environmental changes precede changes in the economy and national security, which in turn lead to changes in society and politics, all of which produce (albeit with multiple feedback loops) the effects we observe in investor behavior and financial market valuations and returns.
To generate alternative future scenarios and critical forecasting questions, we use this framework to identify multiple paths across these issue areas, including alternative outcomes for critical uncertainties.
In our methodology, we take a Bayesian approach, and classify new information as significant and highly valuable if either it (1) is an “indicator”, which reduces our uncertainty about the value of a parameter in our mental model for making sense of the dynamic macro system, or (2) it is a “surprise” which increases our uncertainty about either the range of potential values for a parameter or the structure of our model.
With respect to indicators, the higher our priori probability is for a regime, the more we look for indicators that it will not occur, and the lower our prior probability for a regime, the more we look for indicators that it will occur. Put differently, try to systematically search for high value indicators that disconfirm our prior views.
| New Technology Information: Indicators and Surprises | Why Is This Information Valuable? |
| “Super Mario meets AI: The Effects of Automation on Team Performance and Coordination in a Videogame Experiment”, by Dell’Acqua et al | SURPRISE “Recent advances in artificial intelligence (AI) have piqued interest in how these technological advances will transform jobs and labor markets. While prior work has focused on understanding the tasks where AI outperforms humans, we ask how the introduction of automated agents affects teams, their routines, and organizations… “We demonstrate experimentally that even in a task where automated agents outperform humans, the introduction of an automated agent decreases team performance. These effects are especially large in the short-term and in low- and medium-skilled teams. “We furthermore document that automation can generate adverse spillover effects into teams that do not receive an automated agent but must coordinate with it. “Our results indicate that these effects are driven by an increase in coordination failures, and we provide suggestive evidence that automation reduces team trust and individual effort provision. “Overall, our team-based approach highlights that human-machine interaction is key to expanding our understanding of how AI will transform teams, organizations, and work more broadly.” |
| “Deepfake is the Future of Content Creation”, by Bernd Deubusmann of the BBC | This is another indication that uncertainty about information integrity will very likely exponentially increase in the coming years. “When most people think of deepfakes, they imagine fake videos of celebrities…Despite the negative connotations surrounding the colloquial term deepfakes (people don't usually want to be associated with the word "fake"), the technology is increasingly being used commercially. “More politely called AI-generated videos, or synthetic media, usage is growing rapidly in sectors including news, entertainment and education, with the technology becoming increasingly sophisticated.” “One of the early commercial adopters has been Synthesia, a London-based firm that creates AI-powered corporate training videos for the likes of global advertising firm WPP and business consultancy Accenture. ‘This is the future of content creation,’ says Synthesia chief executive and cofounder Victor Riparbelli.” |
| | |
| | |
| | |
| | |
| | |
| | |
| | |
| | |
| | |
| | |
| | |
| New Energy and Environment Information: Indicators and Surprises | Why Is This Information Valuable? |
| “Low Energy: Estimating Electric Vehicle Electricity Use”, by Burlig et al | SUPRRISE “We provide the first at-scale estimate of electric vehicle (EV) home charging. Previous estimates are either based on surveys that reach conflicting conclusions, or are extrapolated from a small, unrepresentative sample of households with dedicated EV meters. We combine billions of hourly electricity meter measurements with address-level EV registration records from California households. The average EV increases overall household load by 2.9 kilowatt-hours per day, less than half the amount assumed by state regulators. Our results imply that EVs travel 5,300 miles per year, under half of the US fleet average. This raises questions about transportation electrification for climate policy.” |
| “US Power Line Tensions Rise Over Green Energy Surge”, in the Financial Times. It described the fight over a proposal to build a new 230 kilometer (143 mile) high voltage electricity transmission line through the Maine forests. “Clearing a path for linear infrastructure — such as highways, oil pipelines or electric transmission — always encounters resistance. The fight over permitting the Maine power line shows how fearsome that resistance can be. “An Iberdrola subsidiary in the US, called Avangrid, launched the NECEC project in 2018 to carry 1.2 gigawatts of hydropower — enough to supply more than 1m households — from dams in Quebec. Utility customers in Massachusetts will fund the cost under that state’s policy to drive down emissions. “The project has splintered environmentalists. It was endorsed by the Conservation Law Foundation and Union of Concerned Scientists, who cited the clean energy that would flow into New England. “But the Sierra Club, the Appalachian Mountain Club and the Natural Resources Council of Maine sued to block the line and last month won the court stay of tree-cutting on a 53-mile segment. “They are not the only opponents. The political action committee challenging Iberdrola’s Spanish roots on TV, called Mainers for Local Power, was bankrolled by merchant generators that stand to lose sales in New England’s power market… “The Maine and New Hampshire experiences show why expectations are modest for the Biden administration’s transmission goals. US states can veto transmission lines that cross their borders — unlike natural gas pipelines, in which the permitting authority of the Federal Energy Regulatory Commission reigns supreme… [Also], “most interstate lines are owned by utilities, which earn returns on equity of about 10 percent under rates regulated by FERC, according to C Three Group, an infrastructure research firm. Parceling out the costs of transmission across different states and customers has been a roadblock for new projects.” | SUPRRISE In December, Princeton University published “Net Zero America”, a very detailed 345 page analysis of the steps required to get to net zero emissions in the United States by 2020. At the end, it included just one slide on “Potential bottlenecks for a 2050 Net-Zero America.” They included the following very non-trivial issues: • “Creation of the coalitions of public support and political will needed to achieve 2020’s targets. • Upfront cost premiums for efficient and electric consumer durable goods (EV’s, heat pumps, etc.). • Rate of mobilization of risk-capital to support project development and construction activities. • Rate of divestment/new investment among incumbent supply-side and demand-side firms. • Regulatory capacity to review and permit investment proposals at the required scale and pace. • Building the [Engineering, Procurement, and Construction company] and the supply chain capacities needed to support deployment rates. • Developing human / skills capacity at the pace required to support the transition. • Concentrated employment losses in particular communities. • Community opposition to visual and land-use impacts of wind, solar, transmission; bioenergy industrialization; environmental impacts of CO2 sequestration; nuclear power due to safety and environmental concerns.” The FT story highlights just how challenging this last obstacle is likely to be. The other will likely be no easier to overcome. |
| “Risk Of Tipping the Overturning Circulation Due To Increasing Rates Of Ice Melt”, by Lohmann and Ditlevsen “Current Atlantic Meridional Overturning Circulation Weakest In Last Millennium”, by Caesar et al | SURPRISE Lohmann and Ditlevsen state that, “central elements of the climate system are at risk for crossing critical thresholds (so-called tipping points) due to future greenhouse gas emissions, leading to an abrupt transition to a qualitatively different climate with potentially catastrophic consequences. “Tipping points are often associated with bifurcations, where a previously stable system state loses stability when a system parameter is increased above a well-defined critical value. However, in some cases such transitions can occur even before a parameter threshold is crossed, if that the parameter change is fast enough. “It is not known whether this is the case in high-dimensional, complex systems like a state-of-the-art climate model or the real climate system. Using a global ocean model subject to freshwater forcing, we show that a collapse of the Atlantic Meridional Overturning Circulation can indeed be induced even by small-amplitude changes in the forcing, if the rate of change is fast enough… “Furthermore, we show that due to the chaotic dynamics of complex systems there is no well-defined critical rate of parameter change, which severely limits the predictability of the qualitative long-term behavior. The results show that the safe operating space of elements of the Earth system with respect to future emissions might be smaller than previously thought.” Caesar et al begin by noting that, “the Atlantic Meridional Overturning Circulation (AMOC)—one of Earth’s major ocean circulation systems—redistributes heat on our planet and has a major impact on climate.” They “compare a variety of published proxy records to reconstruct the evolution of the AMOC since about AD 400. A fairly consistent picture of the AMOC emerges: after a long and relatively stable period, there was an initial weakening starting in the nineteenth century, followed by a second, more rapid, decline in the mid-twentieth century, leading to the weakest state of the AMOC occurring in recent decades.” |
| | |
| | |
| | |
| | |
| | |
| | |
| | |
| | |
| | |
| | |
| New Economic Information: Indicators and Surprises | Why Is This Information Valuable? |
| “Covid Relief Bill Gives $86 Billion Bailout to Failing Union Pension Plans”, by Greg Iacurci, CNBC | SURPRISE This sets a very dangerous precedent, and potentially opens the door to federal bailouts of underfunded state and local government defined benefit pension plans. At the end of 2018, the Federal Reserve estimated that the underfunded liabilities of these plans amounted to $4.6 trillion. Unfunded post-employment healthcare liabilities for state and local government employees added a further $1.2 trillion (see: “Survey Of State And Local Government Other Postemployment Benefit Liabilities” by Marc Joffe). The political fight over any proposal for a federal bailout of these state and local plans (as opposed to closing their funding gaps though a combination of benefit cuts, spending cuts, and/or higher taxes) is sure to be intensely divisive. For example, in “UK Universities Face Big Rise In Pension Contributions”, the Financial Times’ Josephine Cumbo observes that, “Universities are likely to face the threat of further industrial action, as a funding hole in the sector’s pension scheme increased to more than £14bn, leaving staff and employers facing ‘unaffordable’ rises in contributions… “The Universities Superannuation Scheme said on Wednesday that contributions paid by 200,000 active members and 350 university employers would need to rise from a combined 30.7 per cent of payroll to as much as 56.2 per cent to plug a shortfall in the pension fund estimated at between £14.9bn and £17.9bn.” On CNBC, Iacurci noted that, “the $1.9 trillion COVID relief package passed by the Senate on Saturday offers $86 billion in funding to failing pension plans. “The American Rescue Plan would let certain pensions apply for federal grant funding, which would be used to help pay retirement benefits to workers. “The provision applies to multi-employer pensions. These plans pay benefits to union workers in industries such as construction, manufacturing, mining, retail transportation and entertainment. “There are roughly 1,400 such plans in the U.S., covering 10 million people. However, 124 multi-employer pensions are in “critical and declining” status, according to the Pension Benefit Guaranty Corporation. They’re projected to have insufficient funds to pay full retirement benefits within the next 20 years. About 1 million workers are in such plans, according to the American Academy of Actuaries.” |
| “The U.S. Economy Is Leaving Midsize Companies Behind”, by Govindarajan et al | SURPRISE “When the Covid-19 pandemic hit, a record number of companies, many of which had survived for more than 50 or even 100 years, had no other option but to file for bankruptcy. Recent trends don’t bode well for midsize companies that are the bedrock of any nation’s economy… “Data suggests that a perfect storm has been brewing for midsize companies over the past 50 years. In every successive decade since 1970–79, the annual growth rates of assets, sales, and profits have been declining for midsize companies, which are increasingly struggling to earn profits”… “Despite its low interest rates and stable economic environment, the most recent decade witnessed the slowest growth among midsize companies and a continual deterioration of their financial performance. As shown by bankruptcy filings, pandemic shock made this trend even worse… The booming stock market is not an accurate reflection of the on-the-ground reality for most American corporations.” |
| “US Policymakers Lose Faith In Official Unemployment Rate”, by Politiand Rogers in the Financial Times | “The rapid decline in the US jobless rate has so far exceeded the forecasts of private sector economists and Fed officials alike… But the headline figure has obscured far less encouraging trends in America’s labour market, and is now considered an incomplete and unreliable guide to the trajectory of the US recovery… most importantly, it has been distorted by the plummeting number of Americans participating in the labour force… “Published unemployment rates during Covid have dramatically understated the deterioration in the labour market,” Jay Powell, the Federal Reserve chair, said during a speech last month.” |
| “The Inflation Risk From Joe Biden’s Stimulus Plan Is Exaggerated”, by Chen Zhao | Zhao presents a well-reasoned, evidence-based argument for why the current enthusiasm for “the reflation trade” is very likely overdone. “About $1tn will meanwhile be used for direct income subsidies to households in the forms of rebate cheques, child tax credits and higher unemployment benefits. There is also $150bn of financial aid for vulnerable businesses. Overall, household and business subsidies total $1.15 trillion… Such subsidies are quite different from public sector investment. The former is identical to income tax cuts; the latter feeds directly into GDP growth. They also have very different economic multipliers. Recent experience — for example, that of Australia after the 2008 financial crisis — is that the impact of income subsidies on growth is often negligible. This is because businesses and consumers behave rationally. If a tax cut is one off or transitory, the windfall is usually saved rather than spent. “A case in point is the roughly $3tn stimulus package, passed between March and May 2020. This had a limited effect in boosting growth as consumers not only saved their income subsidies, they saved more of any other income they received. US personal disposable income shot up by $2.4tn between March and May last year. But personal savings soared by more than $5tn. “Similarly, it is far from certain how much of the Biden package’s $1.15tn in consumer and business subsidies will be spent… “By comparison, Donald Trump’s 2017 tax cuts were worth about $1.5tn, similar in size to Biden’s proposed income subsidies. Although these tax cuts were “permanent” and aimed at boosting corporate investment and consumer spending, they did little to lift long-term GDP or inflation. “They did lift corporate earnings and stock buybacks and helped to create a stock market boom. But they did not boost corporate capital expenditure. “As for household disposable incomes, they did rise as personal tax rates came down. Consumer saving rates also rose by 2 percentage points to 9 per cent of disposal income. “But consumer spending growth stayed virtually flat. Trump’s tax cuts suggest it is unlikely that Biden’s income subsidies will boost demand by much, or be inflationary.” |
| | |
| | |
| | |
| | |
| | |
| | |
| | |
| | |
| | |
| | |
| | |
| | |
| | |
| | |
| | |
| New National Security Information: Indicators and Surprises | Why Is This Information Valuable? |
| The National Security Commission on Artificial Intelligence issued its final report | SURPRISE In this critical new report, the commission begins by noting that, ‘“No comfortable historical reference captures the impact of artificial intelligence (AI) on national security. AI is not a single technology breakthrough, like a bat-wing stealth bomber. The race for AI supremacy is not like the space race to the moon. AI is not even comparable to a general-purpose technology like electricity. “However, what Thomas Edison said of electricity encapsulates the AI future: “It is a field of fields … it holds the secrets which will reorganize the life of the world.” Edison’s astounding assessment came from humility. All that he discovered was “very little in comparison with the possibilities that appear.” “The National Security Commission on Artificial Intelligence (NSCAI) humbly acknowledges how much remains to be discovered about AI and its future applications. Nevertheless, we know enough about AI today to begin with two convictions. “First, the rapidly improving ability of computer systems to solve problems and to perform tasks that would otherwise require human intelligence—and in some instances exceed human performance—is world altering… AI is also the quintessential “dual-use” technology. The ability of a machine to perceive, evaluate, and act more quickly and accurately than a human represents a competitive advantage in any field—civilian or military. AI technologies will be a source of enormous power for the companies and countries that harness them… “Second, AI is expanding the window of vulnerability the United States has already entered. For the first time since World War II, America’s technological predominance—the backbone of its economic and military power—is under threat. “China possesses the might, talent, and ambition to surpass the United States as the world’s leader in AI in the next decade if current trends do not change. “Simultaneously, AI is deepening the threat posed by cyber attacks and disinformation campaigns that Russia, China, and others are using to infiltrate our society, steal our data, and interfere in our democracy. The limited uses of AI-enabled attacks to date represent the tip of the iceberg.” |
| “China Targets Rare Earth Export Curbs to Hobble US Defence Industry”, by Yu and Sevastopulo in the Financial Times | “China is exploring limiting the export of rare earth minerals that are crucial for the manufacture of American F-35 fighter jets and other sophisticated weaponry, according to people involved in a government consultation. “The Ministry of Industry and Information Technology last month proposed draft controls on the production and export of 17 rare earth minerals in China, which controls about 80 per cent of global supply. “Industry executives said government officials had asked them how badly companies in the US and Europe, including defence contractors, would be affected if China restricted rare earth exports during a bilateral dispute… “Beijing’s control of rare earths threatens to become a new source of friction with Washington but some warn any aggressive moves by China could backfire by prompting rivals to develop their own production capacity.” In fact, this has already been happening, following China’s temporary ban on rare earth exports to Japan during the 2010 East China Sea crisis. For example, in 2013 the United States created the Industrial Base Analysis and Sustainment program to ensure adequate supplies of rare earth materials for defense needs. So it is uncertain how effective a Chinese ban on rare earths exports to the US would be. See also: “Australia Has a Key Role to Play in Reducing China’s Rare Earth Dominance”, by Page and Coyne; |
| “America Will Only Win When China’s Regime Fails”, by Cooper and Brands | SURPRISE “Washington has accepted the reality of competition [with China] without identifying a theory of victory…There is no lack of suggestions, but U.S. leaders have yet to articulate how this competition will lead to something other than unending tension and danger… “Advocates of competitive coexistence believe the United States can eventually change the minds of Chinese leaders, convincing them not to seek regional preeminence and upset the U.S.-led international order in Asia and beyond. The hope is that if the United States demonstrates, over a period of years, that it can maintain a favorable balance of power in the Western Pacific, preserve its key economic and technological advantages, and rally overlapping state coalitions to uphold key rules and norms, then Beijing might adopt less bellicose (and self-defeating) policies… “The goal, whether codified by a diplomatic settlement or simply arrived at implicitly, would be a more stable relationship where the danger of conflict is reduced, the United States’ key strategic interests are preserved, and areas of potential cooperation gradually expand… “The biggest problem with this approach: It may not reflect the reality of the struggle in which the United States is engaged. “Competitive coexistence holds that the rivalry between the United States and China is severe but not immutable. In other words, a powerful Communist Party-led China can eventually be reconciled to a world order where the United States, its allies and partners, and its democratic values remain predominant. “Yet what if that belief is illusory because the rivalry is actually more fundamental? What if the Chinese Communist Party desires a more thoroughgoing revision of the international system, in part because it perceives a system led by a democratic superpower and premised on the superiority of democratic values as an existential threat to its own survival? … “The Chinese Communist Party is governed by a fundamentally zero-sum mindset. This bodes ill for the prospect of a long-term strategic accommodation… “In short, the United States needs to reckon with the possibility that acute Sino-American antagonism will persist so long as a powerful China is governed by the Chinese Communist Party. “If this is the case, then it may be naive to think that even a long period of vigorous competition by the United States would bring about a mellowing of the Chinese Communist Party. Instead, rivalry could persist in a fairly intense form until the party loses its ability to prosecute it. This could come about due to either a decline in Chinese power or a fundamental change in the nature of the ruling regime. In this scenario, the United States’ theory of victory begins to look similar to that offered by containment during the Cold War… “According to this regime-failure theory, what will ultimately end the Sino-American competition is the accumulated effect of the profound internal stresses China faces combined with consistent external resistance… “It is difficult to say with certainty which theory of victory is analytically superior, but the balance of evidence supports the more pessimistic theory discussed here—that competition should be seen as a bridge to long-term changes in Chinese power or in the way China is governed. That’s a relatively dark view of where Sino-American competition may be heading. Yet if the rivalry is as fundamental as Chinese Communist Party leaders seem to think and if Chinese ambitions are as extensive as a growing number of Sinologists have documented, then that view may also be the most realistic.” |
| | |
| | |
| | |
| | |
| | |
| | |
| | |
| | |
| | |
| | |
| | |
| New Health and Disease Information: Indicators and Surprises | Why Is This Information Valuable? |
| “Increased Hazard Of Death In Community-Tested Cases Of 4 SARS-Cov-2 Variant Of Concern 202012/01”, by Davies et al “Risk Of Mortality In Patients Infected With SARS-Cov-2 Variant Of Concern 202012/1: Matched Cohort Study”, by Challen et al | SURPRISE The first paper concludes that the B.1.1.7 variant of SARS-CoV-2 that has become dominant in the UK is not only more transmissible, but also increases the risk of dying from COVID (if you’re infected) by about 50%. To put that in perspective, “this corresponds to the absolute risk of death for a male aged 55–69 increasing from 0.6% to 0.9% over the 28 days following a positive [COVID] test.” In the second paper, Callen et al found a 64% higHer risk of death if a person is infected, or “an increase in deaths from 2.5 to 4.1 per 1000 detected cases.” |
| “Negligible Impact Of SARS-Cov-2 Variants On CD4+ And CD8+ T Cell Reactivity In COVID-19 Exposed Donors And Vaccinees” by Tarkle et al | The emergence of SARS-CoV-2 variants highlighted the need to better understand adaptive immune responses to this virus. It is important to address whether also CD4+ and CD8+ T cell responses are affected, because of the role they play in disease resolution and modulation of COVID-19 disease severity… “We performed a comprehensive analysis of SARS-CoV-2-specific CD4+ and CD8+ T cell responses from COVID-19 convalescent subjects recognizing the ancestral strain, compared to variant lineages B.1.1.7, B.1.351, P.1, and CAL.20C as well as recipients of the Moderna (mRNA-1273) or Pfizer/BioNTech (BNT162b2) COVID-19 vaccines. “We demonstrate that the sequences of the vast majority of SARS-CoV-2 T cell epitopes are not affected by the mutations found in the variants analyzed. Overall, the results demonstrate that CD4+ and CD8+ T cell responses in convalescent COVID-19 subjects or COVID-19 mRNA vaccinees are not substantially affected by mutations found in the SARS-CoV-2 variants.” |
| “Modeling And Prediction Of COVID-19 In The United States Considering Population Behavior And Vaccination”, by Usherwood et al | SURPRISE This innovative analysis models the impact of interacting vaccination rates and behavioral changes of future COVID infections. However, it does not appear that the authors have factored in the potential impact of the spread of more transmissible SARS-CoV-2 variants in the United States, which would likely extend their forecast for minimal COVID infections beyond August 2021. “COVID-19 has devastated the entire global community. Vaccines present an opportunity to mitigate the pandemic; however, the effect of vaccination coupled with the behavioral response of the population is not well understood. “We propose a model that incorporates two important dynamically varying population behaviors: level of caution and sense of safety. Level of caution increases with the number of infectious cases, while an increasing sense of safety with increased vaccination lowers precautionary behaviors. “To the best of our knowledge, this is the first modeling approach that can effectively reproduce the complete time history of COVID-19 infections for various regions of the United States and provides relatable measures of dynamic changes in the population behavior and disease transmission rates… “We predict future COVID-19 pandemic trends in the United States accounting for vaccine rollout and behavioral response. “Although a high rate of vaccination is critical to quickly end the pandemic, we find that a return towards pre-pandemic social behavior due to increased sense of safety during vaccine deployment, can cause an alarming surge in infections. “Our results indicate that at the current rate of vaccination, the new infection cases for COVID-19 in the United States will approach zero by the end of August 2021.” |
| “In 2018, Diplomats Warned of Risky Coronavirus Experiments in a Wuhan Lab. No One Listened”, by Josh Rogin in Politico | This is another in-depth analysis of the evidence surrounding the theory that the COVID pandemic was caused by a lab accident at the Wuhan Institute of Virology. |
| | |
| | |
| | |
| | |
| | |
| | |
| | |
| New Social Information: Indicators and Surprises | Why Is This Information Valuable? |
| “Experts Say the ‘New Normal’ in 2025 Will Be Far More Tech-Driven, Presenting More Big Challenges”, by Anderson et al from Pew Research | “Asked to consider what life will be like in 2025 in the wake of the outbreak of the global pandemic and other crises in 2020, some 915 innovators, developers, business and policy leaders, researchers and activists responded… “A plurality [47%] think sweeping societal change will make life worse for most people as greater inequality, rising authoritarianism and rampant misinformation take hold in the wake of the COVID-19 outbreak. Still, a portion [39%] believe life will be better in a ‘tele-everything’ world where workplaces health care and social activity improve.” |
| “The Family Income Supplemental Credit: Expanding the Social Compact for Working Families”, by Cass and King from The American Compass | We have long noted that in the US, the largest voter segment is the one least represented by existing parties: People who are relatively liberal on economic issues, and conservative on social issues. This is the segment that Boris Johnson seems to be targeting in the UK; in the US, it is one on which Oren Cass’s new think tank, The American Compass, is targeting (Cass was formerly Mitt Romney’s policy director). In this latest analysis, Cass and King propose “a per-child family benefit called the Family Income Supplemental Credit. We argue that such a policy should be understood not as a “child allowance,” but rather as a form of reciprocal social insurance paid only to working families. “Those struggling to make ends meet as the pressures of raising young children simultaneously curtail their income and raise their expenses deserve the nation’s unqualified support. If and when they attain economic comfort themselves, they should repay the investment, contributing to the support of those facing the squeeze. “An aggressive expansion of the nation’s social compact, backed by a major financial commitment, has the potential to shore up the economic and cultural foundations on which people build their lives.” See also, the American Compass’s “Home Building Survey” on the state of families in America for more of its policy proposals. |
| “The Future of Work After COVID-19”, by the McKinsey Global Institute | SUPRRISE “Our research suggests that the disruptions to work sparked by COVID‑19 will be larger than we had estimated in our prepandemic research, especially for the lowest-paid, least educated, and most vulnerable workers. “We estimate that more than 100 million workers in the eight countries we studied may need to switch occupations, a 12 percent increase compared to before the pandemic overall and a 20 percent rise in advanced economies. These workers will face even greater gaps in skill requirements. “Across countries, we find that job growth may concentrate more in high-wage jobs while middle and low wage jobs decline.” |
| | |
| | |
| | |
| | |
| | |
| | |
| | |
| | |
| | |
| | |
| New Political Information: Indicators and Surprises | Why Is This Information Valuable? |
| “How Much Longer Can This Era of Political Gridlock Last?” by Lee Drutman | Confidence in prediction increases when you combine forecasts of the same question that are based on different methodologies and/or information. Drutman reaches similar conclusions to the ones we reported last month in our analysis of the threat posed by declining political legitimacy. “Democrats may have a narrow majority in both the House and the Senate for the next two years, but it’s nothing near the margin they hoped for. And the likelihood that Democrats keep both the House and the Senate in 2022 is low, as the president’s party almost always loses seats in the midterm elections. “That means more divided government is probably imminent, and the electoral pattern we’ve become all too familiar with — a pendulum swinging back and forth between unified control of government and divided government — is doomed to repeat, with increasingly dangerous consequences for our democracy. “It’s part of our long era of partisan stalemate. The question, of course, is how much longer can this last? And is there any resolution in sight?” … “Certainly, one can cast about for issues that could conceivably split one or both of the two major parties and cause a massive political realignment. Economics is arguably once again such an issue, given that the Republican Party’s voters are internally split over economic issues, with many of the more populist voters in the party rejecting the party’s established pro-business, pro-free trade agenda in favor of something more redistributionist. “But the sticking point here seems to be that whatever latent class solidarity might exist among voters across parties, issues of race and racial identity have become so core to partisan affiliation that any potential cross-party coalition along lines of class seems unlikely… “It’s possible that voters today are fed up with the two parties, with rising support for a third party and a growing number identifying as independent. But the problem is that independents do not represent a coherent voting bloc capable of forming a third party… “Today, the factors locking in continued closely-balanced hyper-partisan politics are much stronger [than in the past]. And absent a major change to the rules of our elections, no realignment lies in sight. Instead, deepening partisan trench warfare will only worsen fights over the basic rules of voting, undermining the shared legitimacy of elections on which democracy depends.” |
| On February 13th Donald Trump was acquitted in his second impeachment trial, this time for inciting the January 6th attack on the US Capitol. | While some Republicans voted with Democrats, the final tally fell well short of the Senate 67 votes needed to convict. In the end, most Republican Senators chose to avoid offending their base, thus reinforcing Lee Drutman’s points in the note above. |
| “Why Did Republicans Outperform the Polls Again? Two Theories”, by Emily Ekins | SURPRISE “1) Republicans are losing confidence in institutions, and Trump accelerated this distrust. Long before Trump took office, Republicans were already losing trust in our society and its institutions. But there are now signs that lack of trust could be driving the nonresponse and distrust we see among Republicans in polls and pollsters more generally”… “2) Republicans may be more likely to opt out of election polls because they increasingly fear retribution for their views… “A Cato Institute/YouGov survey in July found, for instance, that 62 percent of Americans have political views they are afraid to share given the current political climate. Republicans were overwhelmingly likely to say they self-censored their political opinions (77 percent) compared with Democrats (52 percent). “Not only were many Republicans afraid to express their political opinions, but those with more education were also more likely than Democrats to say they feared getting fired or missing out on job opportunities if their opinions became known.” |
| “The Cost Of Populism: Evidence From History”, by Funke et al | “The rise of populism in the past two decades has motivated much work on its drivers, but less is known about its economic and political consequences. This column uses a comprehensive database on populism covering 60 countries, dating back to 1900 to offer a historical, long-run perspective” … “We define a leader as populist if he or she places the alleged struggle of the people (‘us’) against the elites (‘them’) at the centre of their political campaign and governing style” … The authors find that, “(1) populism has a long history and is serial in nature – if countries have been governed by a populist once, they are much more likely to see another populist coming to office in the future; (2) populist leadership is economically costly, with a notable long-run decline in consumption and output; and (3) populism is politically disruptive, fostering instability and institutional decay.” |
| “A Dangerous Normalisation Of Unprecedentedness”, by Peter Atwater in the Financial Times | With pith and wit, Atwater makes some critical points: “Over the past few years, we’ve grown so accustomed to being shocked that we’re no longer surprised when it happens. An event or a behaviour is described as unprecedented, and we don’t even blink any more… “In comparable times in American history, we’ve turned to our biggest institutions, church and state, for comfort and strength — to bring us and hold us together. “Today, our biggest institutions seem fragile and unwieldy. Like the power grid now under stress across the southeast, none seems strong enough to handle the mounting load… “What main street needs isn’t just money, but a greater sense of certainty in what is ahead. And today there is no one offering a compelling and unifying vision of the future offering hope.” |
| | |
| | |
| | |
| | |
| | |
| | |
| | |
| | |
| New Financial Markets and Investor Behavior: Indicators and Surprises | Why Is This Information Valuable? |
| “Does Private Equity Investment in Healthcare Benefit Patients? Evidence from Nursing Homes”, by Gupta et al | And we wonder why polls show declining support for capitalism, or perhaps our current highly financialized version of capitalism, among Millennials and Gen Z? “The past two decades have seen a rapid increase in Private Equity (PE) investment in healthcare, a sector in which intensive government subsidy and market frictions could lead high-powered for-profit incentives to be misaligned with the social goal of affordable, quality care. “This paper studies the effects of PE ownership on patient welfare at nursing homes…Our estimates show that PE ownership increases the short-term mortality of Medicare patients by 10%, implying 20,150 lives lost due to PE ownership over our twelve-year sample period. This is accompanied by declines in other measures of patient well-being, such as lower mobility, while taxpayer spending per patient episode increases by 11%. “We observe operational changes that help to explain these effects, including declines in nursing staff and compliance with standards. Finally, we document a systematic shift in operating costs post-acquisition toward non-patient care items such as monitoring fees, interest, and lease payments.” Unfortunately, this story is painfully familiar to many managers who have worked at companies that have been purchased by private equity firms. |
| | |
| | |
| | |
| | |
| | |
| | |
| | |
System Tipping Points/Critical Threshold Analysis
Like Professors Andrew Lo, Doyne Farmer and others, we regard financial markets as a complex adaptive system (CAS), that exist as part of a larger macro system comprised of other CAS between which there are multiple feedback loops. These other systems include those that produce technology innovations, and economic, environmental, national security (including cyber), social, demographic, and political outcomes.
We also find that these systems tend to operate and generate effects in a rough chronological sequence, albeit with many feedback loops between them. The following chart highlights that the changes we observe in different areas at any point in time are actually part of a much more complex evolutionary process.
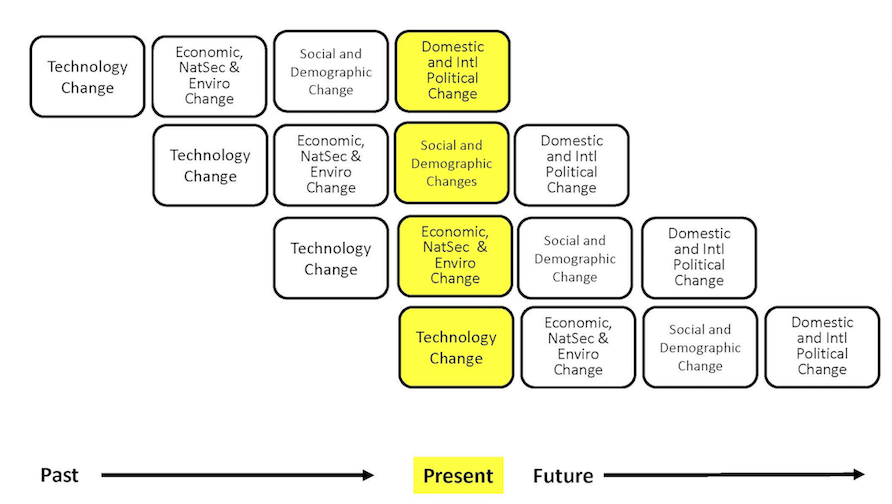
While most media coverage of these systems focused on flows (e.g., the size of the government deficit), rapid non-linear change in complex adaptive systems is often caused by a key stock (e.g., the amount of outstanding government debt) exceeding a critical threshold.
The next table highlights the key macro system stocks that we monitor.
In the next section, we will discuss information received over the past month that is related to these stocks, and which we believe is significant to our assessment of the probabilities that a critical threshold will be reached and a regime change will occur. We will conclude with our estimate, at the end of this month, of how close the macro system is to these critical thresholds, and the implications for financial market regime change probabilities.
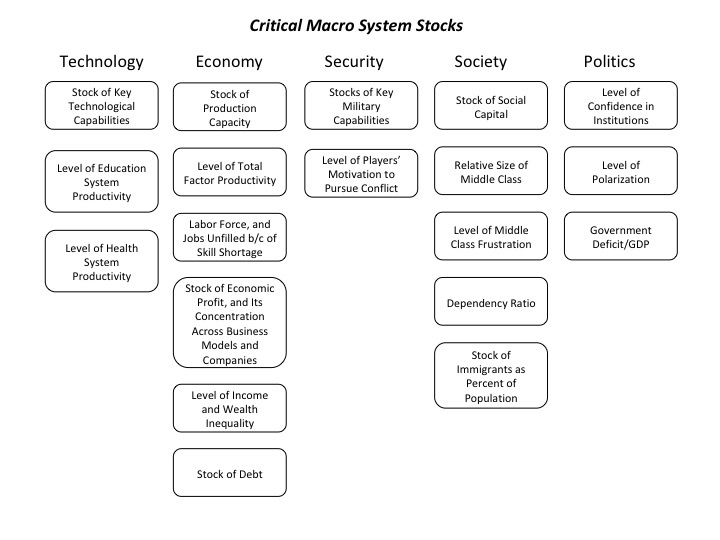
How Close is the Macro System to One or More Critical Thresholds?
As we have noted, the macro drivers of financial market regime changes typically follow a rough chronological sequence, from technology to economic, security, social, and political causes and effects. Yet there are many feedbacks loops between them, creating complex root causes for many of the critical thresholds we have identified.
Understanding the time dynamics in this complex system is critical to avoiding substantial downside investment risk.
We use the UK Met Office Warning Model to communicate our assessment of these time dynamics. We estimate the time remaining before a critical macro system threshold is reached that could trigger a regime change, which is usually accompanied by substantial changes in asset class valuations.
The model uses three increasingly serious levels of warning, from “Be Aware” (condition yellow), to “Be Prepared” (condition orange), to “Take Action” (condition red).
For our purposes, we denote as “Be Aware” (yellow) critical thresholds that we assess to be three or more years away. We estimate that “Be Prepared” (orange) thresholds could be reached within 1 to 3 years. “Take Action” thresholds are very likely to be reached within one year.
Given their nature, we also note that in our three “wildcard” areas (Environment and Energy related; Disease and Human Caused Bioevents; and Cyber and Electromagnetic Events), our forecasts have higher levels of uncertainty.
The following charts summarize our current estimate of the time remaining before different critical thresholds will be reached.
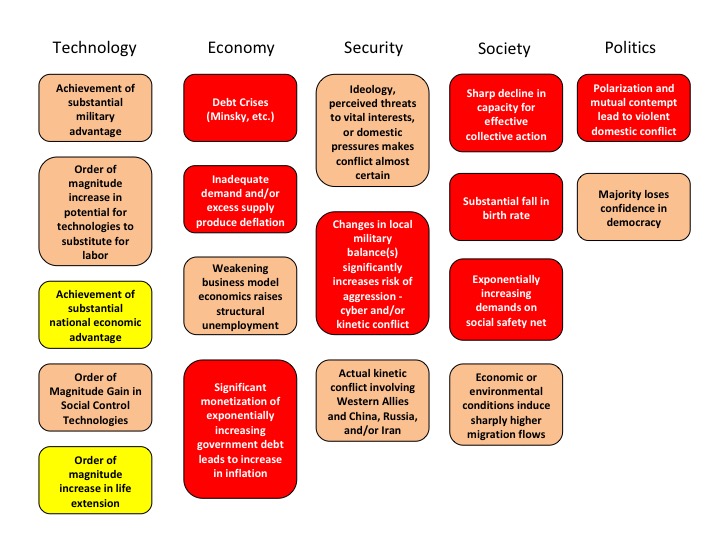
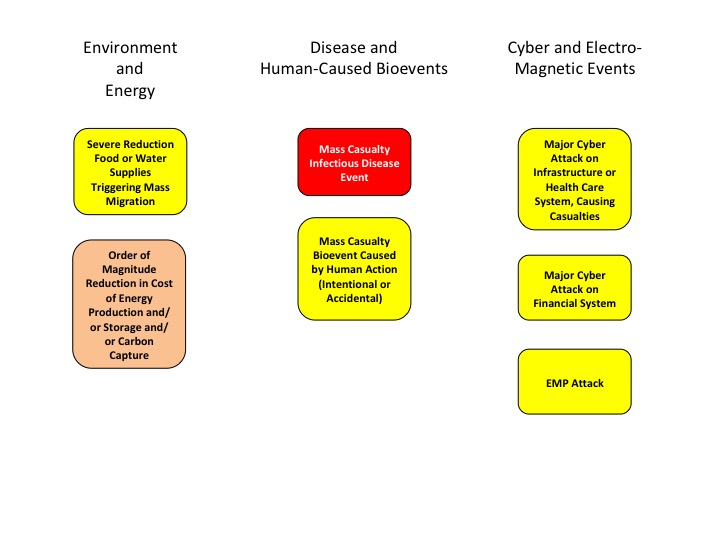
At the highest level, we believe the complex adaptive global macro system can be in one of four states, based on its degree of order versus disorder, and degree of social cooperation versus conflict. A very coarse-grained reading of history suggests that these states evolve in a predictable cycle, from ordered/cooperative, to disordered/cooperative, to disordered/conflicted, to ordered/conflicted.
We believe that the system is currently in its most uncertain state, characterized by high degrees of underlying disorder and social conflict, both domestically and internationally. Beyond some point, intensifying conflict eventually increases the degree of order in the system. That appears to be happening now, via the increasing conflict between China, Russia, and Iran and the United States and other Western nations.
If you have any questions about anything we have written in this issue, please don’t hesitate to get in touch, at contact@indexinvestor.com
Appendix: Anticipatory Thinking and Forecasting Methodologies
Our process is based on methods and tools developed over the past seven years at our affiliate, Britten Coyne Partners, which provides consulting services and education courses to executive teams and boards on strategic risk governance and management.
At The Index Investor, we engage in both anticipatory thinking to identify what could happen (e.g., different macro regimes and related events), and forecasting, to estimate the probability that events and regimes will happen, and the impact they will have if they do (e.g., on macro variables and broad asset class returns).
With respect to what could happen, we are acutely conscious of the conclusion reached by a 1983 CIA study of failed forecasts: "each involved historical discontinuity, and, in the early stages…unlikely outcomes. The basic problem was…situations in which trend continuity and precedent were of marginal, if not counterproductive value."
When it comes to forecasting, we know that in complex socio-technical systems that are constantly evolving, the accuracy of statistical or machine learning based forecasting methods declines exponentially as the time horizon lengthens, since the historical data set on which they were trained will (depending on the speed and effectiveness of any retraining cycle) bear less and less resemblance to the distribution of outcomes the system is likely to produce in the future.
Under these circumstances, forecast accuracy over longer time horizons depends on causal and counterfactual reasoning about the possible future effects of multiple interacting trends and uncertainties that are hard to quantify.
And we are acutely aware of the economist Rudi Dornbusch's famous warning: "Crises take a much longer time coming than you think, then happen much faster than you would have thought."
Our forecasting process also draws on lessons Tom Coyne learned from spending four years as a member of the Good Judgment Project team, which won the Intelligence Advanced Research Projects Activity’s forecasting tournament with forecast accuracy that was more than 50% better than the tournament's control groups (the team's experience is described in Professor Philip Tetlock's book, “Superforecasting").
Our analysis focuses on the probability of the global macro system being in four possible macro regimes 12 and 36 months from the date of our forecast: (1) Normal Times, where equity asset classes perform well; (2) a High Uncertainty regime that is usually short and transitory, where asset classes like short-term government bonds perform best and equities suffer significant declines; (3) High Inflation (which we deem 5% or more, year-on-year), where commercial property, real return bonds and other traditional hedges are favored; and (4) Persistent Deflation (a year-on-year decline in the US CPI), which up to now has only been seen in Japan, and in which the relative performance of different asset classes remains uncertain, but will likely favor high quality bonds and the consumer staples equity sector.
In response to subscriber requests, we have added a 36-month regime forecast to our existing 12 month forecast. The logic is that, in a complex evolving system like global macro, a longer forecast horizon gets beyond the “detection range” of algorithmic forecasting approaches, and therefore raises probability that a manager/investor can gain an edge in identifying emerging threats and opportunities.
That said, because evolving (i.e., “non-stationary”) complex systems populated by highly connected human agents are also capable of sudden non-linear changes (with which are hard for algorithmic approaches to predict), we are also keeping our 12 month forecast.
Our forecasting methodology starts with base rate/reference case data about the historical probability of large changes in equity and bond valuations. We then analyze the current situation from both a quantitative and qualitative perspective. In the latter, we focus on the key endogenous drivers of macro regime change, including technological, economic, national security, social, and political trends and uncertainties. We also focus on three potential sources of exogenous shocks that could also produce a macro regime change, caused by environmental, disease, and cyber related events.
While most of our attention typically focuses on various flows (e.g., economic growth, change in the price level, sales, earnings, job creation, etc.), endogenously caused regime changes result when those flows push key stocks beyond a critical threshold or tipping point, often setting off non-linear reactions across multiple areas. As noted by Hyman Minsky and others, a classic example is the steady accumulation of outstanding debt until it reaches the point where it can no longer be serviced and triggers a crisis.
Base Rate Data
Since the end of World War Two, there have been fifteen months where a downturn in the US equity market began that eventually reduced asset class value by 20% of more. That is a hazard rate of about 1.75% per month. Put differently, in any given month there is a 98.25% probability that a 20%+ downturn won’t occur, or, in a given year, an 81% probability.
However, as the time without a 20%+ downturn extends, the compound probability that one will not occur shrinks. At the end of August 2018, it is more than nine years since the last equity market decline of 20% or more. The probability of that happening is only 15%.
To estimate the base rate for a 20% fall in bond prices (which historically has been caused by a sharp increase in inflation, as we saw in the late 1970s and early 1980s), we analyzed monthly historical AAA bond yields since 1919. For consistency, we used them to calculate the price of a ten-year zero coupon bond. We then calculated the probability of a price decline of 20% or more over three different holding periods: 12, 18, and 24 months. In any month, the annualized probability of a decline of 20% or more over the subsequent 12 months is 12%; over 18 months, 20%, and over 24 months, 25%.
Market Stress Indicators Methodology
We view financial markets as a complex adaptive system. The size of changes generated by such a system follows a power law rather than a normal (Gaussian) distribution. The critical point is that large changes are much more common in complex adaptive systems than most people’s intuition leads them to believe.
While predicting the behavior of complex adaptive systems remains far more art than a science, various researchers have found that large changes in such systems are often preceded by subtle warning signs, as stress accumulates within them. While this research is not definitive, we believe that five warning signs are worth monitoring as potential indicators of growing stress within financial markets that could suddenly give rise to large changes in asset class valuations.
Our first indicator is the month-to-month autocorrelation of broad asset class returns (i.e., the relationship of this month’s returns to last month’s). A system under increasing stress loses resiliency, causing it to take longer to recover from perturbations; hence, autocorrelation increases as it approaches a critical transition (see, “Early Warning Signals for Critical Transitions” by Scheffer, et al).
The second market stress indicator we monitor is the Economic Policy Uncertainty Index published by the Federal Reserve Bank of St. Louis (via its FRED economic database), which is based on research by Baker, Bloom, and Davis (see their paper, “Measuring Economic Policy Uncertainty”). The index is based on automated text analysis of leading newspapers and magazine publications, to identify the frequency with which words and phrases are used that indicate uncertainty.
In humans’ evolutionary past, when uncertainty increased the probability of survival was enhanced by staying close to a group. All of us still have that instinct. Research has found that as uncertainty increases, we have an unconscious bias towards higher conformity of our own views with those of a larger group (i.e., reduction in cognitive diversity). Behaviorally, heightened uncertainty induces more “social copying” of others, likely due to both conformity bias and the rational belief that others may be acting on the basis of superior information. This increase in conformity and copying makes a social system more ordered as uncertainty increases, and also reduces its responsiveness to perturbations (i.e., increases autocorrelation) because of delays in the social copying process.
The key point is that increasing uncertainty induces more, not less order in social systems, and in so doing primes them for sudden non-linear change.
Our third market stress indicator is the spread between the yield on AAA rated bonds and the 10-year US Treasury. This is a proxy for the level of investor concern about financial system funding liquidity.
Our fourth market stress indicator is the yield spread between speculative BB rated bonds and the ten-year US Treasury. Throughout history, excessive credit growth has been a root cause of many financial crises. An indicator of such growth is falling credit spreads, particularly in the case of riskier borrowers. In contrast, rising BB spreads indicate growing investor concern about the consequences of such growth, and the financial distress lower rated companies could experience in an economic downturn.
Our fifth market stress indicator is what we term the “political risk premium” that is implicit in the price of gold. Our starting point for estimating this premium is the three different roles that gold plays. First, gold is a store of value in a world of fiat currencies. When the rate of money supply growth exceeds the growth of nominal GDP, gold’s price should increase to maintain its purchasing power. Between 2007 and 2017, the US money supply (M2) grew by about 86%, while nominal US GDP grew by 35%. The stock of gold grew by 18%, based on mine production over this period. We therefore infer that 33% of the increase in the price of gold represented the maximum potential gold price change that could be attributed to a desire to hedge inflation risk (86% less 35% less 18%).
Second, gold is a unit of account. We take this to mean that the annual change in GDP expressed in terms of physical gold (i.e., nominal GDP divided by the price of gold) should equal the change in real GDP calculated using the GDP price deflator to account for actual inflation over the period. A key challenge is the point at which to start this calculation.
We chose the price of gold in 1995/1996. In that period, the change in real global GDP measured using the IMF’s price deflator just about equaled the change in GDP measured in terms of physical gold. We interpret that coincidence as indicating that at that point in time, concerns about future inflation and political risk were minimal, and the change in the price of gold was mostly driven by its role as a unit of account. We calculated a subsequent series of gold prices that would produce the same change in “gold GDP” as the actual real GDP as calculated by the IMF. Between 2007 and 2017, “gold as a unit of account” warranted a 21% increase in its price.
Gold’s third role is as a hedge against inflation and what we term “political disaster” risk. We subtract the 21% estimated compensation for actual inflation from the 33% “gross” inflation risk hedge to derive an apparent 12% increase in the gold price that reflected the true risk premium to hedge against possible future inflation. However, between 2007 and 2017 the price of gold actually increased by 81%. This implies that 48% of this (81% less 21% less 12%) represented a premium for some other type of uncertainty at the end of 2017. The interesting question is the nature of the uncertainty for which gold is believed by some investors to be a superior hedge than traditional ports in a storm like short-term US government securities, or similar securities issued by other developed countries.
The logical inference is that the uncertainty in question must reflect a situation in which short term US Treasuries would be a less effective hedge than gold. This could be a world of widespread hyperinflation, capital controls, and/or radical changes in nations’ governments (of course, this would also imply a preference for investing in gold coins rather than bullion, as while the latter may be a store of value, it is far less convenient as a means of paying for transactions).
To put this in further perspective, this gold price “disaster risk” premium sharply increased from 2008 to 2012, then declined before sharply increasing again after 2016. Arguably, a significant part of the former increase reflects concerns about the potential inflationary consequences of dramatic quantitative easing by central banks. But this is not likely to be the case after 2016.