The Index Investor
March 2020
Tactical Asset Allocation Implications of Our Forecasts
Forecast Logic
Forecast Pre-Mortem Analysis
Combining and Extremizing Forecasts to Improve Predictive Accuracy
Feature Article: Why Did Markets Take So Long to React to COVID19?
High Value Information Observed Last Month
Critical System Thresholds/Tipping Points Analysis
Appendix: Anticipatory Thinking and Forecasting Methodologies
Current Macro Forecast
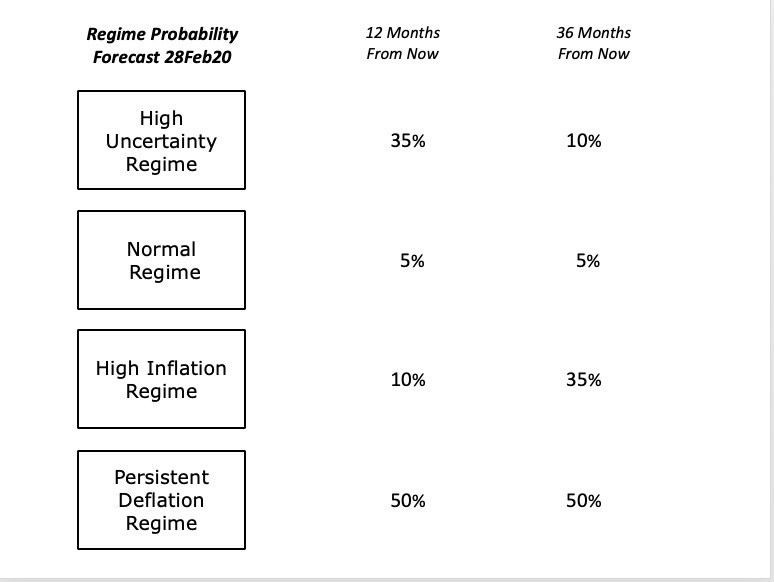
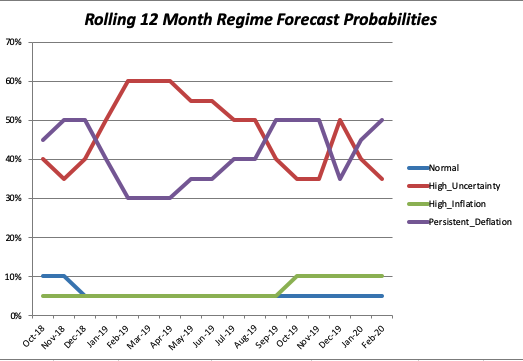
The key driver of the change to our forecast was further evidence that emerged over the past month regarding the Wuhan coronavirus, and its economic impact, as seen in China and Italy. Moreover, given high levels of debt in many parts of the global economy, a sharp downturn in economic activity could easily trigger a cascading debt deflation cycle.
The argument for the High Uncertainty Regime prevailing over the next 12 months rests on successful control of the potential coronavirus pandemic. If this happens, it would refocus attention on political and policy uncertainties, including the outcome of the US election and post-Brexit UK trade negotiations with the EU and other nations. Another critical uncertainty might be China’s future behavior, if Xi Jinping is removed from power as a consequence of his party faction’s poor management of the coronavirus outbreak.
We also changed our 36-month forecast probabilities. We decreased the probability of the Persistent Deflation Regime from 60% to 50%, and increased the probability of the High Inflation Regime from 25% to 35%.
We continue to believe that the Persistent Deflation regime is most likely over this time horizon because of multiple headwinds restraining aggregate demand growth beyond the impact of COVID-19. These include population aging, weak productivity growth, high levels of both inequality and debt, and the threat of job displacement as increasingly capable automation and artificial intelligence technologies are deployed.
At the 36-month time horizon we now view the High Inflation scenario as somewhat more probable. The impact of COVID-19 on the global economy will clearly require a substantial amount of fiscal stimulus, which will be financed via the issuance of more government debt. Most of this debt will be purchased by various central banks. A critical uncertainty is the extent to which fiscal stimulus will be accompanied by political support for structural policy changes that remove the obstacles to higher productivity growth and reduced inequality in the future. While COVID-19 creates more political room to undertaking such policy changes, it does not guarantee that their implementation will not be undermined by various powerful interest groups.
This leads to a scenario in which multiple parties see continuing growth of debt and expansion of the money supply, with continued stagnation of aggregate demand and, quite possibly, constraints on aggregate supply (assuming a very choppy shortening of global supply chains). Under these circumstances, it isn’t hard to envision a loss of faith in the US dollar in particular, and possibly all fiat currencies, as people consider the implications of Herbert Stein’s timeless wisdom: “If something cannot go on forever, it will stop.”
Depending on circumstances in the Eurozone and UK, this could lead to an appreciation of their currencies versus the USD. It would almost certainly lead to an increase in the price of gold and other hard assets (e.g., property and timber).
Portfolio Allocation Implications of Our Forecast
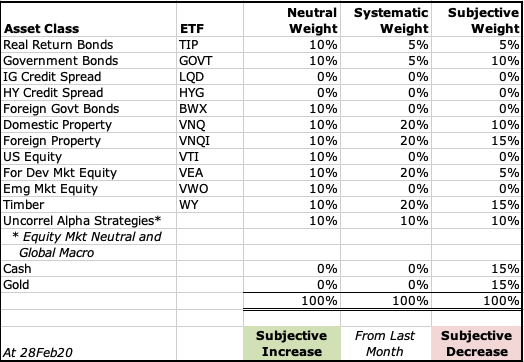
We take two approaches to deriving the tactical asset allocation implications from our analyses. The first takes a systematic approach, and is based on relative asset class valuations. Our starting point is our “neutral” model portfolio, which is equally weighted across nine broad asset classes, and also includes a 10% allocation to alpha strategies (equity market neutral and global macro) that are designed to have a low correlation to returns on broad asset classes. Based on asset class valuations, we systematically vary the asset class weights (but not the active strategy weight), increasing from 10% to 15% when an asset class is likely undervalued, and 15% when it is very likely undervalued. In the case of overvaluations, we go to 5% and then into cash, if there are no undervalued asset classes with room for an increase. In effect, this replicates the systematic rebalancing strategy we used for 15 years in our previous model portfolios.Based on subscriber requests, this month we are re-introducing a feature from the previous version of The Index Investor: Tactical Asset Allocation Implications from our analyses.
The second tactical approach is based on our subjective view not only of current asset class valuations, but also of the implications of the broader macro trends and uncertainties that we analyze each month. Importantly, this subjective view reflects our primary goal of avoiding large downside losses, rather than seeking large upside gains.
Two final notes: First, with respect to US fixed income, we include credit products (investment grade and high yield) in the same asset class as government debt, and will shift into the former when their valuations become attractive. Second, we regard gold not as a separate asset class to be held long-term, but rather as a complement to cash, into which we shift in periods of substantial overvaluation across multiple asset classes.
More information about our investment beliefs, including our core philosophy, approach to asset allocation (including our model portfolios and their long-term track record), and views on various approaches to active and passive management can all be found here.
Here is our latest asset allocation view:
Forecast Logic: Quantitative Indicators
Implications of the Most Recent Three Month Asset Class Returns
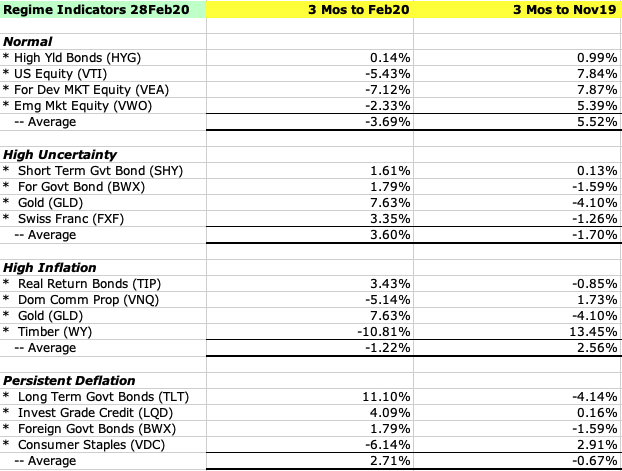
Our quantitative forecast methodology focuses on the level and change in three-month returns, over the most recent and previous three-month periods, for those asset classes, which should perform best under different regimes (in this sense, our regimes can be regarded as macro factors). We assume that relatively higher returns are associated with more widely held investor beliefs in the probability that a given macro regimes will develop in the future.
Over the last three months, there has been a relative strengthening of investors’ belief that the normal times regime lies ahead.
Asset Class Valuation and Momentum Indicators (@28Feb20)
| Asset Class (ETF) | Valuation | 1 Month Return | Conclusion |
| US Real Return Govt Bond (TIP) | Likely Overvalued* | 0.92% | Increasing Overvaluation |
| US Nom Return Govt Bond (GOVT) | Likely Overvalued* | 2.45% | Increasing Overvaluation |
| US Investment Grade Credit (LQD) | Very Likely Overvalued* | 1.09% | Increasing Overvaluation |
| US High Yield Credit (HYG) | Almost Certainly Overvalued* | (1.28)% | Decreasing Overvaluation |
| US Commercial Property (VNQ) | Very Likely Undervalued* | (7.03)% | Increasing Undervaluation |
| US Equity (VTI) | Likely Overvalued* | (8.00)% | Decreasing Overvaluation |
| Foreign Devel Mkt Equity (VEA) | Very Likely Undervalued* | (17.32)% | Increasing Undervaluation |
| Emerging Markets Equity (VWO) | Very Likely Overvalued* | (3.55)% | Decreasing Overvaluation |
| Timber (WY) | Almost Certainly Undervalued* | (10.26)% | Increasing Undervaluation |
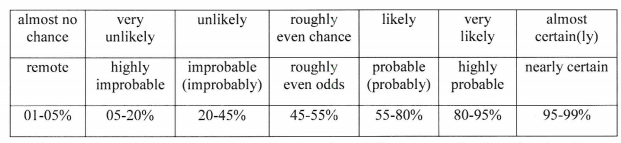
Note: The language we use to describe our estimated likelihood of asset class over or undervaluation is based on US Intelligence Community Directive 203 on Analytic Standards, which includes the following table:
Market Stress Indicators (@28Feb20)
| Market Stress Indicator | This Month vs Last Month |
| Asset Class Returns Autocorrelation (this month versus last month). Higher autocorrelation is an indicator of higher market stress. | .21 vs .66 last month. This indicates a significant decrease in the level of market stress. |
| Economic Policy Uncertainty Index (how many days over the last 30 was index in top quartile of values since 1985?). A higher number equals more market stress. | On 8 days last month the index was in the top quartile of daily values since 1985 (the 66th percentile of all rolling 30-day periods). This is a slight increase from last month, indicating more market stress. |
| AAA Rated Bonds Spread over 10 Year Treasury Yield (month end). Higher spreads indicate rising concern about market liquidity. | 1.52% (67th percentile since 1983), vs 1.31% last month. |
| BB Rated Bonds Spread over 10 Year Treasury Yield (month end). High spreads indicate increasing credit risk. | 3.32%, (50th percentile) down from 2.41% last month. Still extremely low after ten years without a recession. |
| Gold Price per Ounce in US Dollars (month end). Rising gold prices are an indicator of increasing market uncertainty and stress. | $1,626 vs $1,581, up 2.9% from last month. At the end of 2017, we estimated the “disaster premium” in the gold price was 47% (see our methodology in the Appendix). At the end of last month it was 72%. (see our methodology in the Appendix). |
New Qualitative Evidence
Based on our qualitative analysis of accumulated and new evidence, we are considerably more pessimistic about the future than those investors whose trades have driven the returns on different asset classes. We continue to believe that three years from now the most likely outcome is that the global macro system will be in the persistent deflation regime.
In our forecasting approach, technology and environmental developments tend to precede economic and national security changes, which in turn precede social and political trends and events, whose effects then become visible in financial markets. As covered in more detail in this month’s Evidence File (see below), here are the most important new indicators and surprises that influenced this month’s changes to our regime probability forecasts:
Technology:
- New evidence on how far AI development has to go – for example, the continuing lack of causal and counterfactual reasoning capabilities.
Environment:
- New evidence regarding the obstacles to faster deployment of renewables. Also, the economic slowdown caused by the COVID-19 pandemic should slow CO2 emissions and pressures for faster deployment of renewable electricity generation. On the other hand, a key uncertainty is the extent to which fiscal stimulus to offset the economic impact of COVID-19 may be aimed at faster implementation of the “Green New Deal”, both in the EU and the US. In the latter, this will depend on how COVID-19 will affect the outcome of the November 2020 presidential election. A Democratic win that results in the party’s control of both the White House and both houses of Congress is likely to lead to faster deployment of renewables and more pressure to reduce the use of fossil fuels.
Health and Infectious Disease:
- Evidence of COVID-19’s potentially negative impact on the macro economy (e.g., Italy).
- A hopeful hypothesis that COVID-19’s transmissibility is highest in a relatively narrow band of temperature and humidity parameters.
- Sobering evidence about COVID-19’s disease process, which makes it more transmissible than SARS or MERS (see Evidence File).
- Key Uncertainties: the length and strength of immunity obtained by recovered COVID-19 patients and the rate at which the virus is evolving. These will affect the extent of “herd immunity” and the efficacy of vaccines, and will determine whether the COVID-19 pandemic subsides or evolves into an endemic, possibly seasonal, and more dangerous virus than influenza.
Economy:
- COVID-19 will almost certainly an already weakening global macroeconomy that was already facing a range of increasing headwinds.
- The interaction of the sharp contraction in demand (and likely business and household cash flows) caused by the COVID-19 pandemic with very high levels of debt will likely be a flashpoint. For example, the use of “helicopter money” – checks sent by the government to taxpayers to support demand – is very likely to generate political conflict if creditors insist that it be used for debt service payments rather than consumption. Many voters are still bitter about how bankers were bailed out in 2008 while many households suffered. I doubt that they will meekly accept the same treatment again in 2020.
National Security:
- Before the explosion in COVID-19 cases, the EU was deadlocked in budget negotiations. Failure to support Italy (the EU member thus far hardest hit by COVID-19), and even worse, nations choosing to “go it alone” in the absence of a coordinated EU response, would very likely further weaken the EU, and perhaps put it on the path to further “Brexits”.
- Failure of the Iranian leadership to effectively respond to COVID-19 will almost certainly lead to further popular unrest – but also to further repression as the government fights to remain in control.
- China’s attempt to blame the United States for COVID-19 suggests that Xi Jinping’s faction has been significantly weakened by its poor management of the epidemic. This increases the potential for leadership change in China, and thus the level of uncertainty in the international system.
- The same is true for the Trump administration’s poor handling of COVID-19, and its potential impact on the November 2020 election.
Society:
- A number of new pieces of research provided more evidence of increasing social strains in the United States, even before the full-force arrival of COVID-19. This suggests that the electorate is highly volatile, which makes the outcome of the 2020 election more uncertain.
- A new poll found that the Trump impeachment experience further eroded the public’s trust in and “anger at and disillusionment with” government.
- Following the Super Tuesday primaries, the Democratic field was reduced to two: the relatively moderate Joe Biden, and progressive Bernie Sanders. Whether the Democratic Party can unify between either candidate remains to be seen, as does the impact of COVID-19 on their respective popularity.
Financial Markets:
- A new analysis found that private debt fund assets now exceed $800 billion. How these firms react to the sharp economic downturn triggered by COVID-19 is a critical uncertainty. If they play hardball with debtors, the political backlash could be fast and furious. new analysis found widespread investor underestimation of the embedded risks in many structured yield enhancement products.
Pre-Mortem Analysis
One of the most important forecasting disciplines is to ask yourself why your forecast could be wrong. Dr. Gary Klein’s research has shown that a very powerful and insightful way to do this is via a “pre-mortem analysis.” This method asks you to assume that it is a point in the future, and your forecast has been proven wrong (or your strategy or company has failed). You are then asked to look backward from this imagined point in the future, to explain why you failed, what you missed, and what you could have done differently to avoid your fate.
The pre-mortem method takes advantage of the fact that humans reason much more concretely and in more detail when explaining the past than they do when trying to forecast the future.
So let us assume that it is one year from now, and our current forecast has turned out to be wrong.
How did this happen? What developments did we fail to anticipate?
- The leaders of the world’s three major powers – Xi Jinping and Donald Trump, and to a lesser extent Vladimir Putin and Ali Khamenei are all facing sharply weakened economies and declining political popularity. History teaches us that this can lead to increased “foreign adventurism” to distract the public from worsening domestic conditions, as a nation rallies around its leader in a period of heightened external conflict. Should a “kinetic” conflict develop between China and the United States, or Iran and Israel, Saudi Arabia, and/ or the US, or between Russia and one or more European countries (e.g., due to a Russian incursion into the Baltics), it would generate a very sharp increase in uncertainty that would likely accelerate the already sharp COVID-19 economic slowdown. Given given high debt levels, this would very likely accelerate the arrival of the Persistent Deflation Regime.
- A supply side shock of some type – beyond the disruption of global supply chains caused by COVID-19 -- could produce a sudden increase in inflation – the most likely scenario being a reduction in oil supplies due to a prolonged kinetic conflict between Iran and the US. A less likely cause could be major crop failures.
- Another route to the high inflation regime (repeatedly noted by Bridgewater’s Ray Dalio) would be a sudden loss of confidence in the US dollar relative to other currencies (driving up import prices), perhaps because of deficit monetization and policy paralysis if a severe downturn continues without meaningful policy reform to increase productivity and growth and reduce inequality. However, this would also require that there was relatively more confidence in another currency, with the Euro being the most likely candidate. This currently seems unlikely, given both the Eurozone’s economic and political situation, and the prospect of an intensifying conflict between the West and China. However, if confidence collapsed in all major currencies, a sharp increase in inflation would lead to a dramatic rise in the price of gold.
Note: Combining Our Forecasts with Others From Other Sources and Extremizing the Result Should Increase Your Predictive Accuracy
Research has found that three steps can improve forecast accuracy. The first is seeking forecasts based on different forecasting methodologies, or prepared by forecasters with significantly different backgrounds (as a proxy for different mental models and information). The second is combining those forecasts (using a simple average if few are included, or the median if many are). The final step, which significantly improved the performance of the Good Judgment Project team in the IARPA forecasting tournament, is to “extremize” the average (mean) or median forecast by moving it closer to 0% or 100%.
Forecasts for binary events (e.g., the probability an event will or will not happen within a given time frame) are most useful to decision makers when they are closer to 0% or 100% than the uninformative “coin toss” 50%. As described by Baron et al in “Two Reasons to Make Aggregated Probability Forecasts More Extreme”, forecasters will often shrink their probability estimates towards 50% to take into account their subjective belief about the extent of potentially useful information that they are missing.
When you average multiple forecasters’ estimates, you are including more information, which should increase forecast confidence and push the mean estimate closer to 0% or 100%. However, this doesn’t happen when you use simple averaging. For this reason, forecast accuracy is increased when you employ a structured “extremizing” technique to move the mean estimate closer to 0% or 100%.
You can download an extremizing model from our website to use when combining the forecasts you use in your decision process.
The extremizing factors in our model are those that the Good Judgment Project found maximized the accuracy of combined forecasts. Note that the extremizing factor is lower when average forecaster expertise is higher. This is based on the assumption that a group of expert forecasters will incorporate more of the full amount of potentially useful information than will novice forecasters.
Feature Article: Why Did Markets Take So Long to React to COVID-19?
On 31 December, 2019, the S&P 500 closed at 3,230.78. That same day, the government in Wuhan, China, confirmed that health authorities were treating multiple cases of pneumonia.
On 6 January 2020, the Wall Street Journal reported that, in China, “medical authorities are racing to identify the cause of a mystery viral pneumonia that has infected 59 people in central China, seven of whom are in critical condition, and triggered health alerts in Hong Kong and Singapore.” The next day, the Financial Times reported that “health authorities are working to identify the outbreak of viral pneumonia that has infected at least 59 people in Wuhan [China]. Officials have ruled out Severe Acute Respiratory Syndrome, Middle East Respiratory Syndrome and certain types of flu.”
On 8 January, the FT reported that, “The world is already grappling with its first emerging disease of the decade. Dozens of people in Wuhan, a city in central China, have been hit by an unexplained pneumonia. There are no recorded deaths but, among 59 who have fallen sick, seven are reported to be in a critical condition with breathing difficulties. The authorities have ruled out seasonal flu, bird flu, severe acute respiratory syndrome (SARS) and Middle East respiratory syndrome (MERS). Singapore and Hong Kong are now screening air passengers for fever. The outbreak, which began in December, has been traced back to a market selling seafood and live animals such as bats and marmots. It has since been closed and disinfected. The possibility that yet another malign microorganism has hurdled the species barrier to infect humans is likely to boost calls for a global catalogue of animal pathogens.”
On 9 January, the FT reported that, “A pneumonia outbreak that has infected more than 50 people in the Chinese city of Wuhan was caused by a coronavirus, which is the same kind of pathogen involved in the deadly SARS outbreak in 2003, Chinese state media said on Thursday. The outbreak, which comes ahead of the lunar new year holidays in late January when millions of Chinese will be travelling to see their families, has caused alarm in the region. The virus has prompted widespread concern on Chinese social media and triggered memories of the 2003 outbreak of severe acute respiratory syndrome, or SARS, that infected more than 8,000 people worldwide and killed more than 700, including almost 300 in Hong Kong. The World Health Organization said, in a statement issued on Thursday, the Chinese authorities believed the disease ‘does not transmit readily between people’, but noted that it could cause severe illness in some patients.”
On 15 January, the FT ran a story headlined, “How Dangerous is China’s Latest Viral Outbreak?” This was its first paragraph: “An outbreak of a new kind of viral disease in China has led to widespread concern about the risks involved and fears of an official cover-up. A 2002-03 outbreak of severe acute respiratory syndrome (SARS) killed more than 800 people after Chinese officials covered up new cases for months, greatly worsening its spread. That has raised questions over Beijing’s handling of the latest outbreak that began in Wuhan, capital of Hubei province.”
On 14 January, there was a Democratic Candidate Debate.
On 16 January, Donald Trump’s impeachment trial began.
On 18 January, in a story headlined “Scientists Warn Over China Virus Outbreak”, the FT wrote that, “Concerns are rising over an outbreak of a virus that originated in China as leading scientists suggested that more than 1,700 people may already have been infected, far more than had been thought. Chinese health authorities said this weekend that they had discovered 21 more suspected cases in the central city of Wuhan, bringing the total number of suspected cases of the pneumonia illness in the city up to 62. But experts warn that there is significant uncertainty about the severity and spread of the illness, which has already killed two people and evoked memories of the SARS outbreak that killed hundreds of people more than 15 years ago. A study by the respected MRC Centre for Global Infectious Disease Analysis concluded that a total of 1,723 people in Wuhan City would have had onset of symptoms by January 12, the last reported onset date of any case. Neil Ferguson, a public health expert from Imperial College London, who founded the centre, told the BBC he was “substantially more concerned than I was a week ago”.
Later in the same story, it was noted that, “on Sunday, Li Gang, director of the Wuhan Center for Disease Control and Prevention, told state broadcaster CCTV that the information available ‘does not rule out the possibility of limited human-to-human transmission.’ ‘The infectivity of the new coronavirus is not strong,’ he added, referring to how rapidly the virus may spread between individuals. ‘The risk of continuous human-to-human transmission is low’. Most patients have presented relatively mild symptoms, Mr. Li said, and no cases had been found in more than 700 people who came into close contact with infected patients.”
On 20 January, the FT reported that “China Confirms Human-to-Human Transmission of SARS-like Virus”.
On 21 January, the World Health Organization issued its first Situation Report on the “Novel Coronavirus”. The same day, the FT reported that Asian stocks had fallen after Beijing confirmed human-to-human transmission.
On 22 January, the US confirmed its first case, a patent in Washington State who had returned from Wuhan. On the same day, the FT ran a story headlined, “How China’s Slow Response Aided Coronavirus Outbreak.”
On 23 January, Chinese authorities began their quarantine of Wuhan.
On 27 January, The Index Investor (@indexllc) posted its first multipart tweet about the new coronavirus, including initial estimates of its Case Fatality Rate, and key uncertainties for investors to monitor. Between then and today (16 March) we have posted 11 more (often multipart) tweets, covering new information that reduced uncertainties about the virus and its potential impact.
On 30 January, the WHO declared a global health emergency.
On 31 January, the US restricted travel to China. That evening, the UK officially left the European Union.
3 February: Iowa Democratic Caucuses.
On 5 February, Donald Trump was acquitted at the end of his impeachment trial. That same day, the Diamond Princess cruise ship was quarantined in Japan with 3,600 passengers on board.
On 7 February, there was another Democratic Candidate Debate. Earlier that day, in China, Li Wenliang, the Wuhan doctor who tried to raise the alarm about the new coronavirus (and was accused by the police of “rumormongering”) died after contracting it.
11 February: New Hampshire Democratic Primary.
On 12 February, Dr. Nancy Messonnier, Director of the US Center for Disease Control’s Respiratory Disease program, noted on a press conference call that, “the goal of the measures we have taken to date are to slow the introduction and impact of this disease in the United States but at some point, we are likely to see community spread in the U.S.”
On 18 February, in our new issue of The Index Investor, we wrote, “The Wuhan coronavirus will almost certainly depress global economic growth, by an amount that is highly uncertain at this point. Global aggregate demand has already been weakening. A worsening slowdown (or growth turning negative) will very likely be reinforced by mounting debt servicing problems in our highly leveraged global economy.”
On 19 February, the S&P 500 closed at 3,386.15, thus far the 2020 high. That night there was a Democratic Candidate Debate, the first one to include Michael Bloomberg.
On 20 February, the FT’s Gillian Tett titled her column, “Share Prices Look Sky High Amid Coronavirus Fears.”
On 23 February Italian authorities limited travel to 10 towns in the Lombardy region after a sudden increase in coronavirus cases.
On 25 February, Larry Kudlow, Director of the National Economic Council, said, “We have contained this. I won’t say [it’s] airtight, but it’s pretty close to airtight”. He added that, while the outbreak is a “human tragedy,” it will likely not be an “economic tragedy.” That night, there was another Democratic Candidate Debate.
At a 26 February press conference, president Trump said that, the current number of COVID-19 cases in the U.S. is “going very substantially down, not up.” He also claimed that “the U.S. is “rapidly developing a vaccine” for COVID-19 and “will essentially have a flu shot for this in a fairly quick manner.”
3 March: Super Tuesday Democratic Primaries.
On 15 March, there was another Democratic Candidate Debate, this time just between Joe Biden and Bernie Sanders.
On 16 March, after multiple trading stops, the S&P 500 closed at 2,386.13, down 29.5% from its February peak.
In the future, many people will ask the same question the Queen asked in the aftermath of the 2008 global financial crisis: “Why didn’t anyone see this coming?”
Our preliminary answer to that question is that it is very likely that multiple interacting factors were at work, including the following:
- We naturally resist the cognitive dissonance that is produced by evidence that severely contradicts our current system of interrelated and mutually supporting beliefs. One aspect of this is our tendency to avoid information that challenges our existing beliefs in a negative way, and to give more attention to evidence that supports our existing views (see “How People Decide What They Want to Know” by Sharot and Sunstein). Another is the way we subconsciously try to fit new discordant evidence into our existing world view by subtly adjusting our beliefs to incorporate it. As Daniel Kahneman noted in his book, “Thinking Fast and Slow”, it is only when this automatic adjustment fails that we note our feeling of surprise at a new piece of information and consciously reason about its potential significance.
- But as Tali Sharot’s research has repeatedly found, even our conscious reasoning is flawed because we often fail to fully incorporate negative information into our beliefs and our memories. Sharot finds that this is the root cause of our natural over-optimism bias.
- Another factor is that as uncertainty increases, so too does our natural human desire to conform to the views and behavior of our group, and to engage in more social learning (i.e., copying). In our evolutionary past this was undoubtedly adaptive; today it is not. When uncertainty increases, the number of diversity of narratives about the future by different members of a population tends to decline, making the system of beliefs more fragile, and susceptible to changes that are both sudden and large.
- As uncertainty increases, people are also more willing to discount conclusions based on their private information when those conclusions disagree with the dominant view in their group. This can allow an increasingly dangerous state to persist for long periods of time, until a strong public signal that is consistent with group members’ private information causes them to quickly and substantially update their beliefs all at once. However, if public signals are confusing or contradictory, the dominant narrative can remain in place, despite accumulating evidence that it is wrong.
- Another relevant shortcoming of human reasoning is our tendency to form beliefs by unconsciously matching the features of a current situation to similar ones that are stored in our memory (this is sometimes called “Retrieved Context Theory”). Our strongest memories are those formed by events that triggered high levels of emotional arousal and negative feelings (or “valence”). In this case, many people may have initially associated early reports about COVID-19 with vague memories of the relatively benign way the SARS epidemic played out in 2003. In the future, early reports of new respiratory viruses are almost certain to be associated with people’s much more negative COVID-19 memories.
- Another factor that may have contributed to assessment failure is that most people struggle to grasp the future implications of processes characterized by time delays and non-linearity, such as those that underlie infectious disease dynamics.
- It is also the case that when our mental energy has been depleted, we exhibit poor control over the allocation of our attention, and are therefore likely to miss important signals. In this regard, the early development of the Wuhan coronavirus crisis coincided with the Trump impeachment trial, multiple Democratic Candidate Debates, the Iowa Democratic primary caucuses, and the New Hampshire Democratic primary.
- Finally, in October 2019, the Economist estimated that 35% of public equities are now managed using quantitative processes. This presents a number of fundamental challenges when disruptive changes like the arrival of COVID-19 roil the financial markets. Most of these processes cannot detect, early on, changes that are not contained in the set of historical data on which they were trained, and/or which have not yet manifested in the signals they track (e.g., changes in sentiment or momentum). Because they are far better at causal and counterfactual reasoning (which quantitative techniques still can’t handle), human beings are still far more effective at making sense of the uncertainties that are inherent in highly complex, evolving systems like global macro.
Since 1997, the mission of The Index Investor has been to help investors, corporate, and government leaders to better anticipate, more accurately assess, and adapt in time to emerging macro threats. This mission provides a framework for answering the question, “Why didn’t anyone see this coming?”
It wasn’t due to a failure of anticipation. Over the years, multiple risk analyses have considered the potential impact of pandemics. For example, in its most recent analysis of alternative future scenarios (“Global Trends 2030: Alternative Worlds”), the US National Intelligence Council wrote this: “An easily transmissible novel respiratory pathogen that kills or incapacitates more than one percent of its victims is among the most disruptive events possible. Unlike other disruptive global events, such an outbreak would result in a global pandemic that directly causes suffering and death in every corner of the world, probably in less than six months.” We also included the possibility of a global pandemic in our January 2020 feature article, “Global Macro Risk Dynamics in the 2020s and Beyond.”
At The Index Investor, we have written about the risks posed by pandemic influenza many times since 1997, and have a substantial amount of information about this threat in the free research library on our website.
In sum, with respect to anticipation failure, COVID-19 was not a black swan.
Failure to accurately assess the threat posed by the Wuhan coronavirus after it appeared is a far better explanation for the human, economic, and financial pain and losses that many individuals and organizations have suffered.
Many of the factors that contributed to this failure are listed above. In the future, more will be discovered and discussed. As we noted, many of them are deeply rooted in human nature.
One of the most important lessons learned over the years at Britten Coyne Partners (The Index Investor’s strategic risk governance and management consulting affiliate) is that simply increasing awareness of them usually doesn’t reduce their impact. A far more effective approach is the consistent use of organizational processes that are designed to offset their potential negative impact. Such processes include, for example, the use of pre-mortem analyses, warning indicators, reference cases, and the systematic search for evidence that contradicts current beliefs.
Failure to adapt in time to a threat that was anticipated and accurately assessed has also have played a role, as it has so many times in history.
In some cases, this failure was probably rooted in system design (e.g., quantitative strategies and robo-advisors that were constrained to remain fully invested, and unable to shift into cash, or exceed certain allocation limits to less risky asset classes).
However, we suspect that the incentives faced by key decision makers played a far more important role, as it always does in cases of strategic failure. When managers are evaluated and compensated on the basis of beating the performance of a benchmark index, there is a very strong incentive to avoid selling too soon, even as they see downside risks increasing. This was famously summed up in former Citibank CEO Chuck Prince’s quote from July 2007: “As long as the music is playing, you've got to get up and dance. We're still dancing.”
Moreover, as organizations grow larger and become more concerned with efficiently scaling a successful business model, their culture usually evolves to one that penalizes errors of commission (“false alarms”) more heavily than errors of omission (“missed alarms”). In the face of disruptive changes in their external environment, this can be deadly.
A final cause of failure to adapt to emerging threats lies in the frameworks we usually use to think about and discuss them. Modern risk assessment has its roots in quantitative tools used by actuaries to estimate the probability and potential impact of discrete events (e.g., prices falling below a put option’s strike price, or the number and severity of hurricane related insurance losses in 2020).
What this framework leaves out is often critical. In a world of evolving uncertainty and novel threats, time dynamics are critical. The key concept is the changing relationship between how much time remains before an emerging risk reaches a critical threshold (e.g., when does it become a dangerous threat), and how much time is still needed before an adequate response to it can be developed and implemented. Boards, management teams, and individuals that closely monitor changes in gap (what Britten Coyne calls the “safety margin”) have a much better chance of adapting in time.
Strategic failure is a complex phenomenon that is always rooted in some combination of interacting individual and organizational failures to anticipate, assess, and act. COVID-19 is just the latest example of this process.
High Value Information Observed In February 2020
In our model of the complex global macro system, change drivers are arrayed across a roughly chronological process (albeit one with many feedback loops), in which technological and environmental changes precede changes in the economy and national security, which in turn lead to changes in society and politics, all of which produce the effects we observe in investor behavior and financial market valuations and returns.
In our methodology, we classify new information as significant and highly valuable if either it (1) is an “indicator”, which reduces our uncertainty about the value of a parameter in our mental model for making sense of the dynamic macro system, or (2) it is a “surprise” which increases our uncertainty about either the range of potential values for a parameter or the structure of our model. With respect to indicators, the higher our priori probability is for a regime, the more we look for indicators that it will not occur, and the lower our prior probability for a regime, the more we look for indicators that it will occur. Put differently, we tend to look for high value indicators that disconfirm our prior views.
| New Technology Information: Indicators and Surprises | Why Is This Information Valuable? |
| “The Next Decade in AI: Four Steps Towards Robust Artificial Intelligence” by Gary Marcus | SURPRISE This is an outstanding paper that provides a great overview of key uncertainties in future improvements in AI capabilities. “Recent research in artificial intelligence and machine learning has largely emphasized general-purpose learning and ever-larger training sets and more and more [computational resources]. In contrast, I propose a hybrid, knowledge-driven, reasoning-based approach, centered around cognitive models, that could provide the substrate for a richer, robust AI than is currently possible… “Let us call that new level robust artificial intelligence: intelligence that, while not necessarily superhuman or self-improving, can be counted on to apply what it knows to a wide range of problems in a systematic and reliable way, synthesizing knowledge from a variety of sources such that it can reason flexibly and dynamically about the world, transferring what it learns in one context to another, in the way that we would expect of an ordinary adult. “In a certain sense, this is a modest goal, neither as ambitious or as unbounded as "superhuman" or "artificial general intelligence" but perhaps nonetheless an important, hopefully achievable, step along the way—and a vital one, if we are to create artificial intelligence we can trust, in our homes, on our roads, in our doctor's offices and hospitals, in our businesses, and in our communities. “Quite simply, if we cannot count on our AI to behave reliably, we should not trust it… “One might contrast robust AI with, for example, narrow intelligence, systems that perform a single narrow goal extremely well (e.g., chess playing or identifying dog breeds) but often in ways that are extremely centered around a single task and not robust and transferable to even modestly different circumstances (e.g., to a board of different size, or from one video game to another with the same logic but different characters and settings) without extensive retraining. “Such systems often work impressively well when applied to the exact environments on which they are trained, but we often can't count on them if the environment differs, sometimes even in small ways, from the environment on which they are trained. Such systems have been shown to be powerful in the context of games, but have not yet proven adequate in the dynamic, open-ended flux of the real world.” |
| “How to Know if Artificial Intelligence is About to Destroy Civilization” by Oren Etzioni, CEO of the Allen Institute for AI | SURPRISE Etzioni proposes three “canaries in the coal mind” that would indicate accelerating AI capabilities. “First, In contrast to machine learning, human learning maps a personal motivation (“I want to drive to be independent of my parents”) to a strategic learning plan (“Take driver’s ed and practice on weekends”). A human formulates specific learning targets (“Get better at parallel parking”), collects and labels data (“The angle was wrong this time”), and incorporates external feedback and background knowledge (“The instructor explained how to use the side mirrors”). Humans identify, frame, and shape learning problems. “None of these human abilities is even remotely replicated by machines. Machines can perform superhuman statistical calculations, but that is merely the last mile of learning. The automatic formulation of learning problems, then, is our first canary. It does not appear to be anywhere close to dying… “Self-driving cars are a second canary. They are further in the future than anticipated by boosters like Elon Musk. AI can fail catastrophically in a typical situations, like when a person in a wheelchair is crossing the street. Driving is far more challenging than previous AI tasks because it requires making life-critical, real-time decisions based on both the unpredictable physical world and interaction with human drivers, pedestrians, and others… “AI doctors are a third canary. AI can already analyze medical images with superhuman accuracy, but that is only a narrow slice of a human doctor’s job. An AI doctor would have to interview patients, consider complications, consult other doctors, and more. These are challenging tasks that require understanding people, language, and medicine…it would have to approximate the abilities of human doctors across a wide range of tasks and unanticipated circumstances…Current AIs are idiots savants: successful on narrow tasks, such as playing Go or categorizing MRI images, but lacking the generality and versatility of humans.” |
| “The New Business of AI (and How It’s Different from Traditional Software)”. Buy Casado and Bornstein, from Andreessen Horowitz | SURPRISE “At a technical level, artificial intelligence seems to be the future of software. AI is showing remarkable progress on a range of difficult computer science problems, and the job of software developers – who now work with data as much as source code – is changing fundamentally in the process. Many AI companies (and investors) are betting that this relationship will extend beyond just technology – that AI businesses will resemble traditional software companies as well. Based on our experience working with AI companies, we’re not so sure… “We have noticed in many cases that AI companies simply don’t have the same economic construction as software businesses. At times, they can even look more like traditional services companies. In particular, many AI companies have: 1. Lower gross margins due to heavy cloud infrastructure usage and ongoing human support; 2. Scaling challenges due to the thorny problem of edge cases; 3. Weaker defensive moats due to the commoditization of AI models and challenges with data network effects… The beauty of software (including Software as a Service, SaaS) is that it can be produced once and sold many times. This property creates a number of compelling business benefits, including recurring revenue streams, high (60-80%+) gross margins, and – in relatively rare cases when network effects or scale effects take hold – superlinear scaling. “Software companies also have the potential to build strong defensive moats because they own the intellectual property (typically the code) generated by their work. “Service businesses occupy the other end of the spectrum. Each new project requires dedicated headcount and can be sold exactly once. As a result, revenue tends to be non-recurring, gross margins are lower (30- 50%), and scaling is linear at best. Defensibility is more challenging – often based on brand or incumbent account control – because any IP not owned by the customer is unlikely to have broad applicability. “AI companies appear, increasingly, to combine elements of both software and services… Maintaining trained data models can feel, at times, more like a services business – requiring significant, customer-specific work and input costs beyond typical support and success functions.” |
| “Technological interdependencies predict innovation dynamics”, by Pichler, Lafond, and Farmer | SURPRISE “Technological evolution is often described as a recursive process whereby the recombination of existing components leads to new or improved technological components…A simple hypothesis, therefore, is that technological domains that tend to recombine elements from fast-growing technological domains should themselves grow faster. In other words, a technology will tend to progress faster if the technologies it relies on are themselves making fast progress. While these ideas are well established, very little has been done to establish empirically that technological interdependencies help predict future innovation dynamics. “Being able to demonstrate this relationship would be very helpful, as it would allow us to support key technologies and overall technological progress by designing and supporting technological ecosystems… “We propose a simple model where the innovation rate of a technological domain depends on the innovation rate of the technological domains it relies on. Using data on US patents from 1836 to 2017, we make out-of-sample predictions and find that the predictability of innovation rates can be boosted substantially when network effects are taken into account. “In the case where a technology’s neighborhood future innovation rates are known, the average predictability gain is 28% compared to simpler time series model which do not incorporate network effects. Even when nothing is known about the future, we find positive average predictability gains of 20%. The results have important policy implications, suggesting that the effective support of a given technology must take into account the technological ecosystem surrounding the targeted technology.” |
| “The US Intelligence Community is Caught in a Collector’s Trap”, by Zachery Brown, DefenseOne, 25Feb20 | This article is very much in line with what we've been saying at The Index Investor since 1997… “The information haystack in which we search for useful needles is growing faster than we could ever catch up. Gathering more hay isn't the answer… while the datasphere grows geometrically, the mechanisms intelligence services use to make sense of it—spies, listening posts, and satellites—can only be added arithmetically. The gap between information to collect and information that is actually collected keeps growing larger, and can never be closed…. But not for lack of trying. For decades, the U.S. intelligence community has added to its expansive data-collection enterprise. Today, it costs the taxpayer around $80 billion a year. National Intelligence University researcher Josh Kerbel calls this the community’s “classified collection business model.” It is premised upon the idea that information and intelligence are essentially synonymous, and posits that the time and treasure spent gathering and sorting it all is justified because it leads to better policy choices—what the community calls “decision advantage.” “The record of American foreign policy failures in my lifetime alone, however, suggests that this model is flawed…. “Even if it were possible to gather every bit of information relevant to national security (it isn’t), it wouldn’t serve policymakers as well as you might think. We tend to find the things we look for and are surprised when the things we are not looking for find us instead… "What makes the collector’s trap so insidious is not only its elusive goal but also the fact that the more information we do gather, the more confused we become. Human susceptibility to cognitive errors such as availability bias and the observer-expectancy effect means that with a virtually limitless amount of information already at our fingertips, certainty about practically anything has only decreased… "The intelligence community has over-invested in technical collection platforms at the expense of the people who give the information those systems collect context. Today’s consumers of intelligence are drowning in data, but thirsting for insight… "The intelligence community must chart a bold new model suited to the information-rich reality of our digital era, and finally, break free from the collector’s trap… "But because we can’t possibly collect everything, or even everything we think may be relevant, we must put far more emphasis on cultivating anticipation and foresight. We must become comfortable with uncertainty rather than trying to eliminate it. We must expect surprise, and grow more resilient, adaptive organizational structures and policies better suited to endure and incorporate the lessons learned from them. "At base, intelligence leaders must remind themselves that they are not in the business of collecting and protecting information, but of delivering insight and facilitating understanding so that better decisions can be made to advance national interests." |
| | |
| | |
| | |
| | |
| | |
| | |
| | |
| | |
| New Energy and Environment Information: Indicators and Surprises | Why Is This Information Valuable? |
| “Global LNG demand to double by 2040, Shell predicts”, FT 20Feb20 | “Global demand for liquefied natural gas is expected to double to 700m tonnes by 2040 as energy consumption, particularly in Asia, rises and as the world shifts away from dirtier burning fuels, Royal Dutch Shell said on Thursday." “In its annual outlook for the supercooled fuel, the energy major said that gas will play a significant role in shaping a lower-carbon future. Around 80 per cent of global energy demand growth is forecast to be met by renewables and gas.” |
| “Salt of the Earth: Quantifying the Impact of Water Salinity on Global Agricultural Productivity”, by Russ et al from the World Bank | SURPRISE “Salinity in surface waters is on the rise throughout much of the world. Many factors contribute to this change, including increased water extraction, poor irrigation management, and sea-level rise. To date no study has attempted to quantify the impacts on global food production. This paper develops a plausibly causal model to test the sensitivity of global and regional agricultural productivity to changes in water salinity... “Average global food losses over 2000–13 are found to be high, in the range of the equivalent of 124 trillion kilocalories, or enough to feed more than 170 million people every day, each year. Global maps building on these results show that pockets of high losses occur on all continents.” |
| “Decreasing market value of variable renewables is a result of policy, not variability”, by Brown and Reichenberg | SURPRISE “Although recent studies have shown that electricity systems with shares of wind and solar above 80% can be affordable, economists have raised concerns about market integration. Correlated generation from variable renewable sources depresses market prices, which can cause wind and solar to cannibalize their own revenues and prevent them from covering their costs from the market. This cannibalization appears to set limits on the integration of wind and solar, and thus contradict studies that show that high shares are cost effective… “We show from theory and with numerical examples how policies interact with prices, revenue and costs for renewable electricity systems. The decline in average revenue seen in some recent literature is due to an implicit policy assumption that technologies are forced into the system, whether it be with subsidies or quotas. “If instead the driving policy is a carbon dioxide cap or tax, wind and solar shares can rise without cannibalising their own market revenue, even at penetrations of wind and solar above 80%. “Policy is thus the primary factor driving lower market values; the variability of wind and solar is only a secondary factor that accelerates the decline if they are subsidised. The strong dependence of market value on the policy regime means that market value needs to be used with caution as a measure of market integration.” |
| “Heavy flows into ESG funds raise questions over ratings”, FT 3Mar20 | “ESG ratings are becoming embedded in financial markets. A growing number of investment indices now hinge on companies’ rankings for environmental, social and governance criteria, and some banks are even offering better borrowing terms to companies with strong ESG scores. “But these are not like credit ratings, which are regulated, and tend to be governed by specific triggers such as a company breaching a certain threshold of leverage. And with so many different methodologies on the market, from a growing number of providers, there can be a wide spread of views on the same company”. |
| “ESG investments: Filtering versus Machine Learning Approaches”, by de Franco et al | SURPRISE The authors “designed a machine learning algorithm that identifies patterns between ESG profiles and financial performances for companies in a large investment universe. The algorithm consists of regularly updated sets of rules that map regions into the high-dimensional space of ESG features to excess return predictions." “The final aggregated predictions allow us to design simple strategies that screen the investment universe for stocks with positive scores. By linking the ESG features with financial performances in a non-linear way, a strategy based upon our machine learning algorithm turns out to be an efficient stock picking tool, which outperforms classic strategies that screen stocks according to their ESG ratings… “We show indeed that there is clearly some form of alpha in the ESG profile of a company, but that this alpha can be accessed only with powerful, non-linear techniques such as machine learning”. |
| “Energy’s stranded assets are a cause of financial stability concern”, FT 1Mar20 | SURPRISE “Goose herds, rendered redundant by the 19th century switch from quills to metal nibbed pens, were an early example. So were the whaling ships no longer needed when electric light replaced oil lamps. So-called stranded assets have long existed. Today, their incarnation as coal mines, oilfields and gas reserves in an unsustainably warming world, is a growing cause of financial stability concern…As the world moves towards a target of net zero carbon emissions companies will find themselves with a range of fossil fuel assets that will never be tapped. They could face large losses as a result. But so could the banks that lend to them, the insurers that underwrite them and the asset managers that invest in them.” True enough, but the actual recognition of losses on stranded assets depends on resolution of many uncertainties regarding the economic viability of renewable energy (e.g., utility scale battery storage, grid control technologies, pricing regulations, etc.) that still seem very unlikely to happen within the next five years. |
| “A 2040 vision for the US power industry: Evaluating two decarbonization scenarios”, by Clune et al from McKinsey | SURPRISE “This article focuses specifically on PJM, the United States’ largest single power system4 in generation. By comparing its current emission trajectory with a hypothetical deep-decarbonization scenario, we show just how important PJM is to the effort to cut CO2 emissions in the United States… “The difference between the two scenarios is stark. Under the first, or status quo, scenario, renewable power grows relatively slowly, and the overall capacity of fossil-fuel-fired power doesn’t change much, though the composition does, as lower-cost natural gas displaces coal… “Under the hypothetical deep-decarbonization scenario—one that could occur if state and national governments decide to take much more aggressive action on greenhouse-gas emissions—the grid shifts much more quickly toward renewable power, particularly the use of onshore wind… “There is also significant investment in flexibility—the capabilities required to manage the intermittent output of renewable power. Coal all but disappears, given the limitations on emissions placed on the system. As a result, by 2040, emissions from the power sector decline 95 percent. “The transition is costly, however, requiring an estimated additional $193 billion in investment over 20 years… “In both scenarios, power companies build new gas-fired power plants. But in deep decarbonization, much less new capacity is installed (38 gigawatts compared with 68 gigawatts), and average utilization—the percentage of time the power plant is actually in use—falls from roughly 50 percent to 25 percent. “At such low utilization, revenues would fall, impairing the economic sustainability of much of the natural-gas industry. “It bears remembering, though, that gas plants can do more than provide power. Specifically, they can ramp production up and down quickly to balance the intermittent generation from renewable power. “As renewable generation grows—something that happens in both scenarios—this capability will be critical to ensure reliability. If gas plants are to be economically viable in a deep decarbonization scenario, new market structures may be needed to pay the industry for this flexibility in load balancing, even as natural gas’s contribution to power generation declines.” |
| | |
| | |
| | |
| | |
| | |
| | |
| New Economic Information: Indicators and Surprises | Why Is This Information Valuable? |
| In February, the potential severity of the COVID-19 outbreak gradually became clear. | See this month’s macro forecast and feature article for more commentary on this development. |
| “The rise of zombie firms: causes and consequences”, by Bamerjee and Hoffman from the Bank for International Settlements | In the wake of the COVID-19 crisis, the issue of zombie firms is poised to increase in importance. “The rising number of so-called zombie firms, defined as firms that are unable to cover debt servicing costs from current profits over an extended period, has attracted increasing attention in both academic and policy circles. Using firm-level data on listed firms in 14 advanced economies, we document a ratcheting-up in the prevalence of zombies since the late 1980s. “Our analysis suggests that this increase is linked to reduced financial pressure, which in turn seems to reflect in part the effects of lower interest rates. We further find that zombies weigh on economic performance because they are less productive and because their presence lowers investment in and employment at more productive firms.” |
| “How Much Money Does the World Owe China?” by Horn et al | SURPRISE “Over the past two decades, China has become a major global lender, with outstanding claims now exceeding more than 5% of global GDP. Almost all of this lending is official, coming from the government and state-controlled entities. “Our research, based on a comprehensive new data set, shows that China has extended many more loans to developing countries than previously known. This systematic underreporting of Chinese loans has created a “hidden debt” problem – meaning that debtor countries and international institutions alike have an incomplete picture on how much countries around the world owe to China and under which conditions. "In total, the Chinese state and its subsidiaries have lent about $1.5 trillion in direct loans and trade credits to more than 150 countries around the globe. This has turned China into the world’s largest official creditor — surpassing traditional, official lenders such as the World Bank, the IMF, or all OECD creditor governments combined… “Despite the large size of China’s overseas lending boom, no official data exists on the resulting debt flows and stocks. China does not report on its international lending, and Chinese loans literally fall through the cracks of traditional data-gathering institutions." |
| “Foreign exchange swaps: Hidden debt, lurking Vulnerability”, by Claudio Borio et al, from the Bank for International Settlements | SURPRISE “Foreign exchange swaps and forwards are a key instrument in the global financial system for hedging, position-taking and short-term funding. They involve the exchange of notional amounts at a future date and, as funding vehicles, they are akin to other forms of collateralised borrowing (e.g. repo). The amounts involved are huge, but the instruments remain mysterious in some ways: because of an accounting peculiarity, they are treated very differently from other forms of collateralised debt”… The authors “find that non-US residents’ US dollar forward payment obligations arising from foreign exchange swaps and forwards are likely to be even larger than the corresponding on-balance sheet US dollar debt. It also highlights the favourable regulatory treatment that these instruments receive, and argues that they represent a critical pressure point in international financial markets.” |
| “Europe is out of economic ammunition”, by Desmond Lachman from AEI | “Even before the coronavirus outbreak, troubles have been coming to the European economy not as single spies but in battalions. Worse yet, these troubles have come at a time when the European Central Bank (ECB) is running out of monetary policy ammunition and the German government remains wedded to a balanced budget policy. None of this bodes well for the European economy in the year ahead – or, for that matter, the global economy. “At the beginning of 2020, all four of the European economy’s largest economies—Germany, France, the United Kingdom, and Italy—were beset by striking economic or political difficulties… “Unfortunately, with the fallout from the coronavirus epidemic about to hit the global economy, there is little reason to believe that the economic or political difficulties besetting Europe’s main economies will clear up any time soon…With Europe’s economy being approximately the same size as that of the United States, another European economic slowdown would have a major effect on the global economy.” |
| “Evaluating the mineral commodity supply risk of the U.S. manufacturing sector”, by Nassar et al | “Trade tensions, resource nationalism, and various other factors are increasing concerns regarding the supply reliability of nonfuel mineral commodities. This is especially the case for commodities required for new and emerging technologies ranging from electric vehicles to wind turbines.” “In this analysis, supply risk is defined as the confluence of three factors: the likelihood of a foreign supply disruption, the dependency of U.S. manufacturers on foreign supplies, and the ability of U.S. manufacturers to withstand a supply disruption. The methodology is applied to 52 commodities for the decade spanning 2007–2016. The results indicate that a subset of 23 commodities, including cobalt, niobium, rare earth elements, and tungsten, pose the greatest supply risk. This supply risk is dynamic, shifting with changes in global market conditions.” |
| “Unequal gains: American growth and inequality since 1700”, by Lindert and Williamson | “Americans have long debated when the country became the world’s economic leader, when it became so unequal, and how inequality and growth might be linked. Yet those debates have lacked the quantitative evidence needed to choose between competing views. “This column introduces evidence on American incomes per capita and inequality for two centuries before World War I. American history suggests that inequality is not driven by some fundamental law of capitalist development, but rather by episodic shifts in five basic forces: demography, education policy, trade competition, financial regulation policy, and labour-saving technological change.” |
| “The Global Financial Resource Curse”, by Benigno et al from the Federal Reserve Bank of New York | SURPRISE “Since the late 1990s, the global economy has experienced two spectacular trends. First, there has been a surge of capital flows from developing countries - mainly China and other Asian countries - toward the United States. Second, productivity growth in the United States has declined dramatically. Both facts have been the center of academic and policy debates, but have so far been considered independently. In this paper, instead, we argue that these two phenomena might be intimately connected” ... “The key feature [of our model] is that the tradable sector is the engine of growth of the economy. Capital flows from developing countries to the United States boost demand for U.S. non-tradable goods. This induces a reallocation of U.S. economic activity from the tradable sector to the non-tradable one. In turn, lower profits in the tradable sector lead firms to cut back investment in innovation. “Since innovation in the United States determines the evolution of the world technological frontier, the result is a drop in global productivity growth. We dub this effect the global financial resource curse. “The model thus offers a new perspective on the consequences of financial globalization, and on the appropriate policy interventions to manage it.” |
| “Debt and Financial Crises”, by Koh et al, Centre for Applied Macroeconomics, Australian National University | “Emerging market and developing economies have experienced recurrent episodes of rapid debt accumulation over the past fifty years… This paper reports four main results:" "First, episodes of debt accumulation are common, with more than 500 episodes occurring since 1970. "Second, around half of these episodes were associated with financial crises which typically had worse economic outcomes than those without crises— after 8 years output per capita was typically 6-10 percent lower and investment 15-22 percent weaker in crisis episodes. “Third, a rapid buildup of debt, whether public or private, increased the likelihood of a financial crisis, as did a larger share of short-term external debt, higher debt service, and lower reserves cover. "Fourth, countries that experienced financial crises frequently employed combinations of unsustainable fiscal, monetary and financial sector policies, and often suffered from structural and institutional weaknesses.” |
| | |
| | |
| | |
| New National Security Information: Indicators and Surprises | Why Is This Information Valuable? |
| “Simplicity Before Complexity: Conceptualizing Long-Term Military Competitions”, by Sam Canter on Real Clear Defense (17Feb20) | SURPRISE This paper does an excellent job of providing a conceptual model of military competition based on different mixed of the ends pursued and the means used to achieve them. Given the rising tension between the different nations and alliance blocs in the world today, it can serve a very useful basis for organizing your thinking about their underlying dynamics, and projecting how they could evolve. This paper is hard to summarize; it really needs to be read in full. |
| “Protracted Great Power War: A Preliminary Assessment”, by Andrew Krepinevich, from the Center for a New American Security (CNAS) | SURPRISE Krepinevich “finds the U.S. Department of Defense is giving insufficient attention to preparing for such wars. While the probability of an extended great-power war may be low, the costs involved in waging one would likely be extraordinarily high, making it an issue of strategic significance for senior Defense Department leaders… “Following the Cold War, planning for protracted great power war contingencies was essentially abandoned. Now, however, with the rise of revisionist China and Russia, the United States is confronted with a strategic choice: conducting contingency planning for a protracted great-power conflict and how to wage it successfully (or, better still, prevent it from occurring), or ignoring the possibility and hoping for the best. “Should they choose the former course of action, U.S. defense leaders and planners must understand the characteristics of contemporary protracted great-power war, which are likely to be far different from those of both recent conflicts and World War II—the last protracted great-power conflict… “The time elapsed between today and the start of World War II, 80 years, is roughly the same as the time between America’s entry into World War II and the start of the American Civil War. Just as the combatants in the Civil War would have felt greatly out of place at Pearl Harbor, those who fought in World War II might feel disoriented in a contemporary great-power war. “Given the continued rapid advance of technology, a future protracted great-power war would likely produce surprises, some of strategic significance… “Given modern conventional, biological, and cyber weaponry, the level and scope of destruction in a great-power war would be far greater than anything the American people have experienced. "Under these circumstances, the social dimension of strategy—the ability to sustain popular support for the war effort, along with a willingness to sacrifice—would be a crucial factor in the United States’ ability to prevail.” |
| “Deterring Attacks Against the Power Grid”, by Narayanan et al from RAND | SURPRISE “The rapid pace of technological change has touched nearly every facet of life in the United States, and armed conflict is no exception. Increased reliance on intelligence processing, exploitation, and dissemination; networked real-time communications for command and control; and a proliferation of electronic controls and sensors in military vehicles (such as remotely piloted aircraft), equipment, and facilities have greatly increased the U.S. Department of Defense (DoD)’s dependence on energy, particularly electric power, at installations. “Although the power grid has long been susceptible to natural disasters, deliberate attacks, and the problems of aging infrastructure, its vulnerability to attacks is increasing. Paralleling technological advancement in vital mission support systems, the ability of adversaries to exploit vulnerabilities through cyber means has expanded, creating considerable risk to the stable supply of electric power. “Strictly preventive measures have been unable to completely eliminate threats to the electric power grid. Recent armed conflicts have seen both physical attacks and cyberattacks on electric power grids… "Although threats to the power grid are by no means confined to state actors, many of these incidents have been attributed to nation-states. " |
| Iran appears to have accelerated its uranium enrichment activities, at the same time as it is failing to control an exponentially growing COVID-19 crisis. | Public trust in the regime was already low after the shootdown of the Ukranian airliner in January. It’s failure to effectively manage the coronavirus outbreak will further erode it. If this leads to the regime fearing for its survival, it could tempt it into increasing external conflict (with Saudi Arabia, Israel, and/or the United States) as a means of shoring up its domestic support. |
| “Managing China: Competitive Engagement with Indian Characteristics” by Tanvi Madan | The author argues that, “the persisting boundary dispute [between India and China], China’s support for Pakistan, concerns about China’s increasing activities and influence in South Asia and the Indian Ocean region through the Belt and Road Initiative and beyond, and an unbalanced economic relationship have ensured that the Sino-Indian relationship remains a fundamentally competitive one. “In response, at home India is trying to enhance its military, nuclear, space, and technological capabilities, as well as its infrastructure. Abroad, it is establishing or enhancing partnerships in India’s extended neighborhood, as well as with like-minded major powers — including Australia, France, Japan, Russia, and the United States — that can help balance China, and build India’s and the region’s capabilities. “In this context, India has largely approved of the Trump administration’s more competitive view of China, even as it does not have similar concerns about China as an ideological challenge and despite Delhi’s discomfort with certain elements of Washington’s approach toward Beijing. “Their broad strategic convergence on China has laid the basis for U.S.-India cooperation across a range of sectors, particularly in the diplomatic, defense, and security spheres, as well as incentivized the two sides to manage or downplay their differences." This convergence could unravel if there is a major Indian reorientation on China, but the paper argues that is unlikely. |
| | |
| “India is facing twin economic and political crises”, by Martin Wolf, FT 25Feb20 | SURPRISE “The current government does at the least have the mandate it needs to revitalise the economy and so opportunities for better lives for all. That mandate is also due to Prime Minister Narendra Modi’s indubitable political talents. But knowing how to use such a mandate is no less vital than being able to win it. “One alternative to the hard road of making good economic policy is making dramatic gestures, such as demonetisation, or botched reforms, such as the introduction of a far-too-complex goods and services tax. “An even easier alternative is reliance on identity politics. That seems to be the current choice…India has now come to a watershed. Its powerful government can either focus its efforts on reinvigorating the economy or it can proceed with a transformation of an imperfect liberal democracy into something very different.” |
| Before the dramatic increase in coronavirus cases, EU nations had deadlocked over next year’s budget for the bloc. | Underlying the deadlock is the problem of how to fill the 75 billion Euro funding gap left by the loss of the UK. Nations that are net payers (Germany, Sweden, Netherlands, Denmark, and Austria) are being asked to give more, while net recipients are being asked to take less. Neither side is happy with this proposal. For background, about 40% of the EU budget goes to agricultural subsidies, and a further 33% goes to “Structural and Cohesion Funds”, which are intended to stimulate and support economic development in the EU’s poorest nations. Both programs have been accused (e.g., by a New York Times investigation) of having high levels of corruption in the use of their funds. EU Commission President Ursula von der Leyen wants a quarter of the budget to kick start a trillion euros of green spending. Plus she wants more money for migration and border management, security and defence and a “digital Europe” program (“The EU is in Trouble, and Ursual Von der Leyen is the Wrong Person to Rescue It” in the Spectator, by Ashoka Mody). Mody concludes that, “one consequence of the economic and political decline is the increasing social anxieties and political alienation within member states, leading to domestic political fragmentation… "Political fragmentation creates a trap. Nation-states struggle to articulate their priorities. At the European level, compromises to achieve forward-looking policies become harder. Unilateral actions and gridlock become the norm on sensitive issues impinging on core national sovereignty. Economic decline persists. European evolution stops. The obsession with process and ceremony becomes the norm.” |
| China is now moving to blame the United States for COVID-19, in an attempt to deflect popular anger at the way it was handled by Xi Jinping’s regime. | SURPRISE In “How Xi Jinping’s “Controlocracy” Lost Control”, Xiao Quiang notes that, “the first coronavirus case appeared in Wuhan, the capital of Hubei province, on December 1, 2019, and, as early as the middle of the month, the Chinese authorities had evidence that the virus could be transmitted between humans. Nonetheless, the government did not officially acknowledge the epidemic on national television until January 20. During those seven weeks, Wuhan police punished eight health workers for attempting to sound the alarm on social media. They were accused of “spreading rumors” and disrupting “social order.” “Meanwhile, the Hubei regional government continued to conceal the real number of coronavirus cases until after local officials had met with the central government in mid-January. In the event, overbearing censorship and bureaucratic obfuscation had squandered any opportunity to get the virus under control before it had spread across Wuhan, a city of 14 million people. “By January 23, when the government finally announced a quarantine on Wuhan residents, around five million people had already left the city, triggering the epidemic that is now spreading across China and the rest of the world. “When the true scale of the epidemic finally became clear, Chinese public opinion reflected a predictable mix of anger, anxiety, and despair. People took to the Internet to vent their rage and frustration. But it did not take long for the state to crack down, severely limiting the ability of journalists and concerned citizens to share information about the crisis.” (See also, “Losing the Mandate of Heaven”, by Aaron Sarin in Quillette on 22Feb20). Regarding domestic frustration with the way Xi Jinping has dealt with the coronavirus outbreak it was interesting to see an account, in the official Communist Party magazine Qiushi, that Xi had been aware of the outbreak in Wuhan well before its existence was made public. This could indicate that competing factions in the Chinese Communist Party may at some point attempt to use Xi’s poor handling of the crisis as the pretext for removing him from power (see, “China’s Xi Jinping knew of coronavirus earlier than first thought Communist party magazine contradicts timeline that blames local officials for virus spread”, FT 22Feb20. Also, “How Damaging Will the Coronavirus be to Xi Jinping’s Authority?” by Brian Eaton in Quillette, 13Feb20). Inevitably, Xi Jinping’s regime has tried to deflect blame away from itself and onto foreign parties. A recent attempt at this (which will further intensify the China-US conflict), came in mid-march. As described by the New York Times, “China is pushing a new theory about the origins of the coronavirus: It is an American disease that might have been introduced by members of the United States Army who visited Wuhan in October” (“China Spins Tale That the U.S. Army Started the Coronavirus Epidemic”, NYT 13Mar20) |
| | |
| | |
| | |
| | |
| | |
| New Health and Disease Information: Indicators and Surprises | Why Is This Information Valuable? |
| New information has emerged about why this coronavirus (COVID-19) is more transmissible than other coronaviruses like SARS and MERS. | SURPRISE At the general level, viruses that originate in bats have some unique characteristics. In “Corona Virus Raises Question: Why Are Bat Viruses So Deadly?” Robert Sanders from the University of California – Berkeley observes that, “It's no coincidence that some of the worst viral disease outbreaks in recent years—SARS, MERS, Ebola, Marburg and likely the newly arrived 2019-nCoV virus—originated in bats… “Bats' fierce immune response to viruses could drive viruses to replicate faster, so that when they jump to mammals with average immune systems, such as humans, the viruses wreak deadly havoc.” A recent article in the Daily Mail (“Coronavirus Could be 1,000 times more infectious than SARS”, 28Feb20) explained how this specifically relates to COVID-19. “Experts initially presumed the spread of COVID-19 would follow the same trajectory as the SARS outbreak in 2002/3, because the viruses are almost identical genetically. But they have discovered the way it binds to cells in the human body is akin to far more aggressive diseases like HIV and Ebola. “This makes it '100 to 1,000 times' more efficient at infecting people than SARS, according to researchers from Nankai University in Tianjin, northern China… "SARS binds to a receptor protein called ACE2 after invading the human body through the mouth, nose or eyes. ACE2 does not exist in large quantities in healthy people, which helped limit the spread of the 2002 outbreak… “Researchers looked at the genome sequence of COVID-19 and found a section of mutated genes that did not exist in SARS. “Instead the coronavirus has 'cleavage sites' similar to those in HIV and Ebola, which carry viral proteins that are dormant and have to be 'cut' to be activated. HIV and Ebola target an enzyme called furin, which is responsible for cutting and activating these proteins when they enter the body. The viruses trick furin so it activates them and causes a 'direct fusion' between the virus and the human cells. COVID-19. binds to cells in a similar way, the scientists found. “This finding suggests [the new coronavirus] may be significantly different from the SARS coronavirus in the infection pathway,' the scientists said in the paper. 'Compared to the SARS' way of entry, this binding method is '100 to 1,000 times' as efficient,' they wrote.” |
| “Temperature and Latitude Analysis to Predict Potential Spread and Seasonality for COVID-19”, by Sajadi et al | SURPRISE Based on correlational data, rather than a causal understanding of the processes involved, the authors of this paper advance the hypothesis that high rates of COVID-19 transmissibility may be restricted to regions with relatively narrow temperature and humidity parameters, similar to other seasonal respiratory viruses like influenza. |
| Key COVID-19 Uncertainties at This Point | Last month we noted that given the available estimates for COVID-19’s Basic Reproduction Number (i.e., relative transmissibility) and Case Fatality Rate, the eventual severity of its impact would depend on the willingness and ability of western nations to implement steps like travel bans, quarantines, and other initiatives to limit social interactions in order to depress viral transmission rates. Judging from what we have seen in Italy, imposition of these measures there and in other countries may have been too little and too late to avoid exponential growth in the number of infected people and in the short-run the overwhelming of health systems’ critical care capacity. Going forward, there are still critical uncertainties to resolve in order to develop a more accurate estimate of COVID-19’s longer term impact. These include: (1) the length and effectiveness of immunity to future infection conferred on those who have been infected and survived. If the immunity is strong and long-lasting, then the “herd immunity” hypothesis claims that the long-term impact will be minimal. However, as we’ve seen in the case of influenza, herd immunity can be relatively weak when a virus evolves at a significant rate (actually, in the case of influenza the rate of evolution is variable). Put differently, the current pandemic will eventually damp down, but, like influenza, COVID-19 could become endemic, with seasonal peaks when temperature and humidity conditions are most favorable for its transmission (e.g., as was the case with polio before the development of the Salk vaccine in the late 1950s). Hence (2), the second key uncertainty is the rate at which COVID-19 will evolve in the future. In turn, this will have a substantial impact on the speed with which a COVID-19 vaccine will be developed, and its long-term effectiveness (e.g., witness the varying accuracy of annual forecasts of the composition of future influenza viruses, which drive targets for producing seasonal vaccines). |
| | |
| | |
| | |
| New Social Information: Indicators and Surprises | Why Is This Information Valuable? |
| “Feel the Fear” by John Hagel | SURPRISE Hagel captures something important that was at work in many countries, even before the arrival of COVID19. “I perceive that fear is becoming pervasive and increasingly intense around the world…So, if I’m right that more and more of us are experiencing growing fear, why is that happening? There are certainly many reasons, but my research suggests that we are in the early stages of a Big Shift that is generating mounting performance pressure on all of us. No matter what our credentials and track record in the past, the pressure is mounting to get even better faster in the future. It’s totally natural that we would feel fear in that kind of world, especially if we were taught that getting the right degrees and pursuing the right jobs would ensure our success. “This mounting performance pressure isn’t just about economic pressure and the ability to earn a living. It takes many different forms, including an accelerating pace of change where things we could rely on in our lives – values, norms, practices, etc. - suddenly are no longer there. “But, it’s not just mounting performance pressure that’s driving the fear. There’s also a growing realization that our institutions are not equipped to help us respond to the mounting performance pressure. In fact, there’s a sense that our institutions are making us even more vulnerable to that growing pressure. That’s one of the key reasons that trust in all our institutions is rapidly eroding globally… “If mounting performance pressure isn’t bad enough, we have a growing set of forces that are feeding that fear. More and more political rhetoric is using threat-based narratives to mobilize action: the enemy is coming to get us and we’re under attack, we need to mobilize now and resist. These threat-based narratives amplify and reinforce people’s feelings of fear. “And there’s more. Our mass media (and social media) are increasingly focused on the terrible things that are happening in the world. Wherever there’s an earthquake, a terrorist attack, a wave of crime, an epidemic or some other disaster, we can count on it dominating the media. We have to look long and hard to find any good news. That can also feed our fear… “If we allow fear to dominate our emotions, we’re at risk of unleashing a vicious cycle that can lead to an increasingly dysfunctional world. Fear cultivates a set of cognitive biases. First, we tend to become more risk averse – we emphasize the risk of action and discount the rewards that can come from action. As we become more risk averse, we tend to shrink our time horizons. “We only focus on what we can do in the short-term because there’s more risk out in the future. As we shrink our time horizons, we fall into what economists call a “zero-sum” view of the world. If we’re only focused on today, there’s a given set of resources and the only question is who’s going to get them – you or me? It’s a win-lose view of the world. And in that kind of world, trust erodes quickly – you may seem like a really nice person, but I know at the end of the day only one of us is going to get those resources, and I want to be sure it’s me. “And these cognitive biases can unleash a vicious cycle. The less trust we have, the more risk averse we become and the more we shrink our time horizons which further erodes trust, and on and on.” |
| “The Cost of Thriving”, by Oren Cass | SURPRISE Cass was the domestic issues director on Mitt Romney’s presidential campaign. He has just launched a new think tank, American Compass. Its goal is to move Republican social and economic policy away from the libertarian right, and towards something that sounds similar to where Boris Johnson is taking the UK Conservative Party. In Cass’ words, “The mission of American Compass is to restore an economic consensus that emphasizes the importance of family, community, and industry to the nation’s liberty and prosperity.” In this column, (which complements Hagel's) Cass notes that, “alongside both the formal concept of “inflation” that measures the economy-wide price level, and a technical “cost of living” that aims to price a fixed level of material consumption, an accurate depiction and understanding of economic trends requires a measure that tracks the evolving basket of things a family needs to achieve the financial security and social engagement typical of a flourishing middle class. Call it the “cost of thriving”… “As a starting point and proof of concept, I propose the following Cost-of-Thriving Index (COTI): the number of weeks of the median male wage required to pay for rent on a three-bedroom house at the 40th percentile of a local market’s prices, a family health insurance premium, a semester of public college, and the operation of a vehicle. A rising COTI indicates that economic trends are compounding the challenge of making ends meet, while a declining COTI would leave households with greater financial security and flexibility”… “The COTI shows a declining capacity of a worker to meet the major costs of a typical middle-class household. As the COTI basket has become unaffordable, families have found workarounds, like having more household members work more hours, making do without, borrowing, and relying on government support. Each of these comes with its own costs, undermines the stability of families and the rationale for their formation, and creates high levels of stress and uncertainty.” |
| “From Pick-Up Artists to Incels: A Data-Driven Sketch of the Manosphere”, by Ribeiro et al | SURPRISE We have previously noted articles that describe various aspects of a crisis enveloping men, from claims of a "war on boys" in elementary and secondary education, to sharp increases in the female/male ratio at many universities, to the shrinking number of men in the workforce and falling marriage rates. This article captures other aspects of these disturbing trends. “Over the past few years, a number of “fringe” online communities have been orchestrating harassment campaigns and spreading extremist ideologies on the Web. In this paper, we present a large-scale characterization of the Manosphere, a conglomerate of predominantly Web-based misogynist movements roughly focused on men’s issues. “We do so by gathering and analyzing 38 million posts obtained from 7 forums and 57 subreddits. We find that milder and older communities, such as Pick Up Artists and Men’s Rights Activists, are giving way to more extremist communities like Incels and Men Going Their Own Way, with a substantial migration of active users. “We also show that the Manosphere is characterized by a volume of hateful speech appreciably higher than other Web communities.” |
| “The Epidemic of Despair: Will America’s Mortality Crisis Spread to the Rest of the World?” By Anne Case and Angus Deaton | SURPRISE “Since the mid-1990s, the United States has been suffering from an epidemic of “deaths of despair”—a term we coined in 2015 to describe fatalities caused by drug overdose, alcoholic liver disease, or suicide. The inexorable increase in these deaths, together with a slowdown and reversal in the long-standing reduction in deaths from heart disease, led to an astonishing development: life expectancy at birth for Americans declined for three consecutive years, from 2015 through 2017, something that had not happened since the influenza pandemic at the end of World War I… “Might American deaths of despair spread to other developed countries? On the one hand, perhaps not. Parsing the data shows just how uniquely bleak the situation is in the United States. When it comes to deaths of despair, the United States is hopefully less a bellwether than a warning, an example for the rest of the world of what to avoid. “On the other hand, there are genuine reasons for concern. Already, deaths from drug overdose, alcohol, and suicide are on the rise in Australia, Canada, Ireland, and the United Kingdom. Although those countries have better health-care systems, stronger safety nets, and better control of opioids than the United States, their less educated citizens also face the relentless threats of globalization, outsourcing, and automation that erode working-class ways of life throughout the West and have helped fuel the crisis of deaths of despair in the United States.” |
| “Only Migration Can Save the Welfare State Rich Countries Need 380 Million More Workers By 2050”, by Lant Pritchett | “In the coming decades, the developed world will face a daunting demographic challenge. As life expectancy goes up and fertility rates go down in North America, Europe, and the Pacific nations of Australia, Japan, and New Zealand, older, retirement-age populations will grow while labor forces shrink. Rich countries, in other words, are running out of young people… “The solution is at once simple and politically challenging: in the coming decades, rich countries should open their borders to more workers from poorer countries. At a time of rising nativism and xenophobia, calling for increased immigration may be unpopular. To allay legitimate concerns about rapid cultural change, developed nations can borrow from existing models of migration—in particular, those of Canada, Singapore, and Persian Gulf countries— that meet the demands of labor markets without upsetting social cohesion. “It will be difficult to convince publics to accept more migrants, but wealthy countries don’t have much of a choice. If they can’t attract more workers from elsewhere, they will face demographic disaster.” Clearly there is an implicit assumption in this argument that labor productivity will continue to grow much more slowly than in the past. And if that is the case, then more immigrants will be needed to sustain at least a constant, if not an increasing level of real per capita income. But even this conclusion rests on the assumption that the productivity of new immigrants will be at least equal to the current average – and that is not guaranteed to be the case. |
| “The Age of Decadence” by Ross Douthat | SURPRISE “Everyone knows that we live in a time of constant acceleration, of vertiginous change, of transformation or looming disaster everywhere you look. Partisans are girding for civil war, robots are coming for our jobs, and the news feels like a multicar pileup every time you fire up Twitter. Our pessimists see crises everywhere; our optimists insist that we’re just anxious because the world is changing faster than our primitive ape-brains can process. “But what if the feeling of acceleration is an illusion, conjured by our expectations of perpetual progress and exaggerated by the distorting filter of the internet? What if we — or at least we in the developed world, in America and Europe and the Pacific Rim — really inhabit an era in which repetition is more the norm than invention; in which stalemate rather than revolution stamps our politics; in which sclerosis afflicts public institutions and private life alike; in which new developments in science, new exploratory projects, consistently underdeliver? What if the meltdown at the Iowa caucuses, an antique system undone by pseudo-innovation and incompetence, was much more emblematic of our age than any great catastrophe or breakthrough? “The truth of the first decades of the 21st century, a truth that helped give us the Trump presidency but will still be an important truth when he is gone, is that we probably aren’t entering a 1930-style crisis for Western liberalism or hurtling forward toward transhumanism or extinction. Instead, we are aging, comfortable and stuck, cut off from the past and no longer optimistic about the future, spurning both memory and ambition while we await some saving innovation or revelation, growing old unhappily together in the light of tiny screens. “The farther you get from that iPhone glow, the clearer it becomes: Our civilization has entered into decadence… "Following in the footsteps of the great cultural critic Jacques Barzun, we can say that decadence refers to economic stagnation, institutional decay and cultural and intellectual exhaustion at a high level of material prosperity and technological development. Under decadence, Barzun wrote, “The forms of art as of life seem exhausted, the stages of development have been run through. Institutions function painfully. Repetition and frustration are the intolerable result…When people accept futility and the absurd as normal, the culture is decadent.” “Crucially, the stagnation is often a consequence of previous development: The decadent society is, by definition, a victim of its own success…slowly compounding growth is not the same as dynamism. American entrepreneurship has been declining since the 1970s: Early in the Jimmy Carter presidency, 17 percent of all United States businesses had been founded in the previous year; by the start of Barack Obama’s second term, that rate was about 10 percent.” |
| “The Social Contract in the 21st Century”, by McKinsey and Company | SURPRISE This is yet another report that builds on those noted above by Hagel, Cass, and Douthat — all of which described worsening strains and stresses in society even before the arrival of COVID19. “This research finds that opportunities for work have expanded, employment rates have risen to record levels in many countries, and many benefits have improved, although not everywhere. At the same time, work polarization and income stagnation, while varying in magnitude across countries, have grown. "While the availability and cost of many discretionary goods and services have fallen sharply, the cost of basic necessities such as housing, healthcare, and education has grown and is absorbing an ever‐larger proportion of incomes. Coupled with wage stagnation effects, this is eroding the welfare of the bottom three quintiles of the population by income level (roughly 500 million people in 22 countries)… “While the average wealth for individuals has recovered to pre‐crisis levels, the wealth of the median individual is still almost one‐fourth below pre‐crisis levels. This contributes to rising economic insecurity and wealth inequality. “In addition to changes in the outcomes for individuals, we also find quantifiable evidence that individuals have had to assume greater responsibility for their economic outcomes in the past two decades. While this research focuses on actual shifts this century, many of these outcomes and shifts and underlying trends began decades earlier… “These changes in outcomes for individuals and the roles of institutions point to an evolution in the “social contract”: the arrangements and expectations, often implicit, that govern exchanges between individuals and institutions. While many have benefited from the evolution in the social contract, for a significant number of individuals the changes are spurring uncertainty, pessimism, and a general loss of trust in institutions… “We highlight ten key problems that will need addressing in order to achieve better and more inclusive outcomes for individuals. We focus on those affecting large numbers of individuals and those likely to persist unless addressed, given current trends. 1. Persistent income polarization and wage stagnation. The uneven distribution of economic gains and prolonged wage stagnation are taking place at a time of positive aggregate growth. Wage stagnation has affected roughly 200 million people in the 22 countries in our sample. This could worsen given the impact of technology and automation. What can be done to enable a higher share of income going to labor? 2. Work fragility and transition supports in an evolving present and future of work. Employment‐related risks are rising and employment protection is on the wane, partly because of the increase in alternative work arrangements and growing challenges posed by automation and digitization. This issue is critical in a world in which, for example, percent of workers are in independent work and that proportion is growing. With automation, between 40 million and 150 million workers in advanced economies may need to switch job categories.65 Therefore, how can flexible, dynamic labor markets be supported, while also reducing fragility for workers? 3. Challenge of affordable housing. Rising housing costs have grown considerably faster than inflation in many markets and are absorbing much of the income gains of low‐ and middle‐income households; roughly 165 million people in the 22 countries are overburdened by housing costs.66 The housing challenge also has cascading effects on individuals as workers. What can be done to unlock supply and other constraints? 4. Rising expense of and growing demand for healthcare and education. Healthcare and education costs have risen above general consumer prices. This significantly affects more than 125 million individuals who spend more than ten percent of their budgets on healthcare and education, as well as nearly 245 million people who are primarily supported by public funding. The need for more healthcare and education is likely to rise as people live longer, and as the nature of work changes and reskilling and lifelong learning become more important. How can technology and the competitive dynamics that benefited discretionary goods and services be harnessed to make healthcare and education more affordable as well as adapt to changing needs? 5. The growing savings and retirement problem. In a century of longer life expectancy and aging, how can the capacity and incentives for individuals to save more, and more effectively, be expanded? Although aggregate wealth is growing, approximately 440 million people reported that they did not save for old age. 6. The multiple pressures on low-income individuals. Roughly 335 million low‐income individuals in the 22 countries face difficulties as workers, consumers (especially with respect to basics such as housing), and savers, and their position has grown more precarious than it was in 2000. How can social safety nets and other supports be revamped for the current era and challenges? What market‐based mechanisms can be established to assist them? 7. A new era of challenging outcomes for the under-30 generation. Young people between 15 and 30 years old, who currently number 180 million, have less access than previous generations to well‐paid, stable employment, affordable housing, and decent savings. What can be done to support younger generations in an era of more precarious work and rapidly changing labor‐market skill dynamics? 8. The persistent gender and race gaps. Although more than 205 million working women have made strides in the labor market, they continue to lag behind men in employment, wages, and savings , and overall wealth. Similarly, the racial wealth and income gap in some countries, such as the United States, is both persistent and growing. How can opportunities presented by the future of work be harnessed to narrow the gap? 9. The growing challenges of place. Certain regions and local economies, mostly in Southern Europe and in declining industrial areas in the United States, where more than 215 million people live, have not recovered fully from the global financial crisis, which continues to weigh on individual outcomes. Some have not kept pace with or benefited from the changes driven by technology, globalization, and shifting focus of market and economic activity, as well as investment, many of which could persist. What can be done to better integrate regional labor markets into the growing economy? 10. The risk of unsustainable government funding. Tax collection and government revenue generation are not keeping pace with government spending, which has risen to support individuals coping with global trends. Healthcare and pension systems in particular are coming under stress because of aging populations. What can be done to ensure the sustainability of these public budgets?" |
| | |
| | |
| | |
| | |
| | |
| | |
| New Political Information: Indicators and Surprises | Why Is This Information Valuable? |
| After the Super Tuesday primaries in the United States, the race for the Democratic nomination to run for president has boiled down to a contest between Joe Biden and Bernie Sanders. | Whether whoever eventually wins the nomination will be able to unify the Democratic party’s progressive and (relatively) moderate party factions (which increasingly resemble two separate parties) and defeat Donald Trump in November remains highly uncertain, even after the latter’s poor handling of the COVID-19 outbreak. |
| “Too Many US Moderates Make a Muddle for Democrats”, by Janan Ganesh, FT 5Feb20 | “Those with moderate views often complain that there is no one to vote for any more. In America, the problem is the opposite: a surplus of candidates. Of all the problems that dog the centre — a winning right, a confident left — the most underrated is its own fragmentation. This owes less to the egoism of politicians, each unwilling to stand aside, than to a free-for-all as to what constitutes moderation. “Because it was so imperious for so long, centrism did not have to define itself. It was whatever the government of the day was doing, whether led by Bill Clinton or Barack Obama in the US, Tony Blair or David Cameron in Britain, Romano Prodi or Matteo Renzi in Italy. Once it found itself in opposition, the centre had to set out what it believed from first principles… “This process has been unexpectedly fractious. The basic faultline is between those who see little gravely wrong with the pre-2016 economy, and those who think it too unequal…[There] is genuine confusion over the meaning of moderation today. Is it closer to liberalism or to social democracy?” |
| In the 6Feb20 Wall Street Journal, Peggy Noonan made a poignant observation (at least for people of a certain age). | “Democrats, when they’re feeling alarmed or mischievous, will often say that Ronald Reagan would not recognize the current Republican Party. I usually respond that John F. Kennedy would not recognize the current Democratic Party, and would never succeed in it. “Both men represented different political eras but it’s forgotten that they were contemporaries, of the same generation, Reagan born in 1911 and JFK in 1917. They grew up in the same America in different circumstances, one rich, one poor, but with a shared national culture. By the 1950s, when JFK was established in the political system and Reagan readying to enter it, bodacious America had settled into its own dignity. It had a role in the world and needed to act the part. “Both men valued certain public behaviors and the maintenance of a public face. It involved composure, coolness, a certain elegance and self-mastery. They felt they had to show competence and professionalism. They knew they were passing through history at an elevated level, and part of their job was to hold high its ways and traditions. Their way is gone, maybe forever.” |
| “The Revenge of the Middle Class Anti-Elitist” by Simon Kuper, FT 13Feb20 | “Here’s a character rarely mentioned in the contemporary political debate. He (he’s usually a man) lives in a suburb or small town. He wasn’t born with a silver spoon, and he worked his way up, which wasn’t always fun. Now he owns his home and earns above-average income. He is scathing of big-city elites with posh accents who got easy lives handed to them. In short, he’s a middle-class anti-elitist. “You find him across the western world: in New Jersey and Long Island, around the English south-east, the Milan agglomeration and in the quiet suburbs of Rotterdam. The comfortably off populist voter is the main force behind Trump, Brexit and Italy’s Lega. Yet he’s largely ignored, while the conversation about populism revolves around an entirely different figure: the impoverished former factory worker…In most countries, populism is less a working class revolt than a middle-class civil war.” |
| “Moderation’s Limits”, by Joel Kotkin | SURPRISE “Moderate Democrats are celebrating Joe Biden’s big Super Tuesday, but their joy may reflect a short-term triumph of the party’s past over its longer-term future. The sudden consolidation of the moderate vote around Biden, paced by the relative inability of Michael Bloomberg to spend his way into relevance, has elevated the creaking former vice president to the top of the pack, mainly as the most likely alternative to socialist senator Bernie Sanders. “Moderation may have triumphed for now, with help from African-American and older voters, but the Sanders–Elizabeth Warren wing of the Democratic Party remains the choice of rising demographic groups of the future, namely Latinos and voters under 30.” In another recent article (“The West Turns Red”), Kotkin observes that, “Paired with fellow progressive, Massachusetts Senator Elizabeth Warren, the party’s “red” bloc represents upward to 50 per cent of the party’s electorate, according to an average of polls by Real Clear Politics. To put this in perspective, these numbers are far higher than those enjoyed by President Donald Trump on his romp to the Republican nomination in 2016... “The new socialism represents, like Trumpian populism, a response to such phenomena as globalization, the rising power of finance and technological change. Around the high-income world, including in the US, these forces have helped nurture an economy where the share of the wealth owned by the top one per cent of earners since 1980 doubled to nearly 40 per cent”… “The precarious nature of the new American economy is felt most deeply by young voters, a strong plurality of whom now favor Sanders… “But the most important driver for socialism comes from the burgeoning green movement. Long dominated by the elite classes, environmentalists are openly showing themselves as watermelons — green on the outside, red on the inside. For example, the so called “Green New Deal” — embraced by Sanders, Warren and numerous oligarchs — represents, its author Saikat Chakrabarti suggests, not so much a climate as “a how-do-you-change-the entire-economy thing”. Increasingly greens look at powerful government not to grow the economy, but to slow it down, eliminating highly paid blue-collar jobs in fields like manufacturing and energy. The call to provide subsidies and make work jobs appeals to greens worried about blowback from displaced workers and communities. “Combined with the confused and vacillating nature of our business elites, and the economic stagnation felt by many Americans, socialism in the West is on the rise.” |
| “The Democrats are Missing the Biggest Issue of the 2020 Election”, by Robert Merry in The National Interest, 14Feb20 | SURPRISE Note that this was written before COVID19 exploded onto the world's stage… “The conventional view of this year’s Democratic nomination battle is that it represents essentially a conflict between the party establishment, described generally as “center-left” in political orientation (Joe Biden, Pete Buttigieg, Amy Klobuchar, Michael Bloomberg), vs. the more radical leftists (Bernie Sanders, Elizabeth Warren). But that isn’t what this campaign season is really about. It’s about how the nation’s leaders will address the most pressing political reality of our time--namely, the crumbling of the American status quo and, more ominously, the global status quo. America is struggling through a Crisis of the Old Order…. “In terms of U.S. domestic politics, the gap between reality and establishment thinking is even more profound. Consider some of the powerful changes impinging on the old status quo. “In the Old Order days, the country’s dominant party was the Democrats, and their bedrock constituency was the American working class, which inevitably meant a large contingent of whites. America’s industrial might was unchallenged in the world, and the economy was dominated by doers and builders. There was a remarkable degree of amity and mutual respect between the nation’s elites and the population at large. Sustained economic growth boosted standards of living generally across the board. The definitional elements of America were largely established and widely embraced. Immigration seemed to most Americans as being generally under control and hence didn’t represent any kind of major political fault line. Class divisions were minor and muted. All that is now under severe challenge… “Thus is it clear that in domestic politics, as in the global arena, America faces a crumbling status quo that poses big new political challenges. And yet those challenges don’t seem to get much attention from the politicians. Certainly, they chip away here and there at problems related to the status quo disintegration, but there’s little effort to meet the situation head-on or to craft a narrative that explains coherently and meaningfully what’s really happening. “Politicians, after all, are usually the last to perceive such things because they are so invested in the status quo and the old arguments that worked so well in the past. Ordinary folks are always ahead of their political leaders in seeing the realities of the day”… Thus far in the 2020 campaign, no candidate for president “has demonstrated much capacity for providing a narrative of the fading status quo or a vision of what could replace it.” |
| “Impeachment Didn’t Change Minds: It Eroded Trust”, by Thomson-DeVeaux and Bronner on fivethirtyeight.com on 18Feb20 | SURPRISE “For a little over three months, we tracked over 1,100 Americans on how they felt about the impeachment process…The share of Americans who thought Trump committed an impeachable offense hovered between 55 and 58 percent in six separate surveys… “Respondent after respondent told us that their belief of Trump’s innocence or guilt was just reinforced by the process…The impeachment process might not have shifted anyone’s view about Trump, but it did drive Americans further into their partisan camps — and in the process, unraveled their already frayed sense of trust in the political system. “When we spoke to them after the Senate trial had concluded, our respondents had few kind words for either party. Instead, they saw impeachment as a stark and painful example of the country’s partisan stalemate… “There was one thing in our surveys that united ordinary Republicans and Democrats: a sense of anger that for four months, their elected leaders had relentlessly jabbed at the country’s gaping partisan wound… “The price of this anger and disillusionment appears to have been a loss of trust in public institutions — Congress, the news media, the presidency, you name it. A majority (65 percent) of Americans said their level of trust in the American political system had decreased because of the impeachment process.” |
| | |
| | |
| | |
| New Financial Markets and Investor Behavior: Indicators and Surprises | Why Is This Information Valuable? |
| Global Private Equity Report, 2020, by Bain and Company | SURPRISE “Most PE firms are not achieving their projected margin expansion. Average margins are 3.3% below deal model forecasts, with 71% of investments falling short, including 14 or 18 that identified margin improvement as critical to value creation (based on 65 fully realized buyout deals completed between 2009 and 2015).” |
| “Can Investors Time Their Exposure to Private Equity?”, by Brown et al | “Private equity performance, both for buyouts and venture capital, has been highly cyclical: periods of high fundraising have been followed by periods of low performance. Despite this seemingly predictable variation, we find modest gains, at best, to pursuing realistic, investable strategies that time capital commitments to private equity. This occurs, in part, because investors can only time their commitments to funds; they cannot time when commitments are called or when investments are exited.” |
| “Diverse Risk Preferences and Heterogeneous Expectations in an Asset Pricing Model”, by Gomez and Piccillo | SURPRISE While this is a technical paper, it shows yet again how, even in the absence of any external shocks, internal (endogenous) factors can cause markets to operate and asset prices to exist far from equilibrium. “We propose a heuristic switching model of an asset market where the agents’ choice of heuristic [decision rule] is consistent with their individual risk aversion. They choose between a fundamentalist and a trend-following [i.e., momentum] rule to form expectations about the price of a risky asset. Given their risk aversion, agents make a deterministic trade-off between mean and variance both in choosing a forecasting heuristic and determining the number of risky assets to buy. “Heterogeneous risk preferences can lead to diverse choices of heuristic. Using empirical estimates for the distribution of risk aversion, simulations show that the resulting time-varying heterogeneity of expectations can give rise to chaotic dynamics: irregular booms and busts in the asset price without exogenous shocks. Small, stochastic price shocks lead to larger asset price bubbles, and can make stable solutions explosive.” |
| “Frenzy in Private Debt Pushes Assets Beyond $800 billion”, by Robin Wigglesworth, FT 1Mar20 | “Private debt has become one of the hot topics for fund managers desperate to build a fee-rich asset class at a time when their traditional businesses are struggling. But even industry insiders are warning that the boom in private debt is turning into a frenzy. “Once a niche area of the global asset management industry, assets invested in private debt — largely made up of non-bank loans to unlisted companies — reached a record $812bn in 2019, putting the market on track to break through the $1tn barrier within the next year… “Private debt is moving into the mainstream as investors hunt for higher yield. Its growth has been spurred by banks quitting the market when they rationalised their loan books to meet tougher capital rules… “Prequin data show that over the past four years 327 direct lending funds, the most common type of private credit strategy, have been raised, with about $207bn flowing into the strategies… Dry powder for all private credit, including strategies such as distressed and mezzanine debt in addition to direct lending, stands at $261 billion… “Industry executives warn that the cracks now on show will become much worse when the market cycle turns.” |
| “Crowded Trades, Market Clustering, and Price Instability”, by van Kranlingen et al | “Crowded trades by similarly trading peers influence the dynamics of asset prices, possibly creating systemic risk… “Market clustering, however, cannot be observed by individual investors and its effect on price dynamics can thus unfold unexpectedly… “Market clustering is expected to cause price shocks, because it amplifies the effect of existing sources of price fluctuations.” |
| | |
| | |
| | |
System Tipping Points/Critical Threshold Analysis
Like Professors Andrew Lo, Doyne Farmer and others, we regard financial markets as a complex adaptive system (CAS), that exist as part of a larger macro system comprised of other CAS between which there are multiple feedback loops. These other systems include those that produce technology innovations, and economic, environmental, national security (including cyber), social, demographic, and political outcomes.
We also find that these systems tend to operate and generate effects in a rough chronological sequence, albeit with many feedback loops between them. The following chart highlights that the changes we observe in different areas at any point in time are actually part of a much more complex evolutionary process.
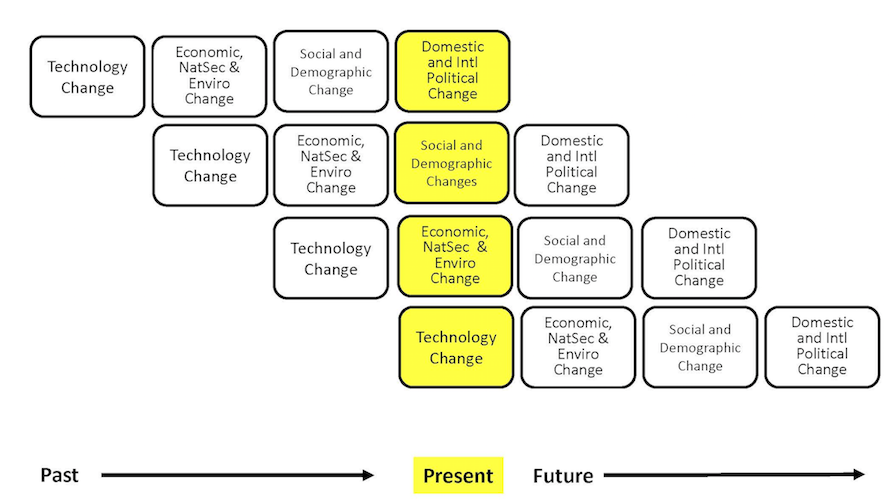
While most media coverage of these systems focused on flows (e.g., the size of the government deficit), rapid non-linear change in complex adaptive systems is often caused by a key stock (e.g., the amount of outstanding government debt) exceeding a critical threshold.
The next table highlights the key macro system stocks that we monitor.
In the next section, we will discuss information received over the past month that is related to these stocks, and which we believe is significant to our assessment of the probabilities that a critical threshold will be reached and a regime change will occur. We will conclude with our estimate, at the end of this month, of how close the macro system is to these critical thresholds, and the implications for financial market regime change probabilities.
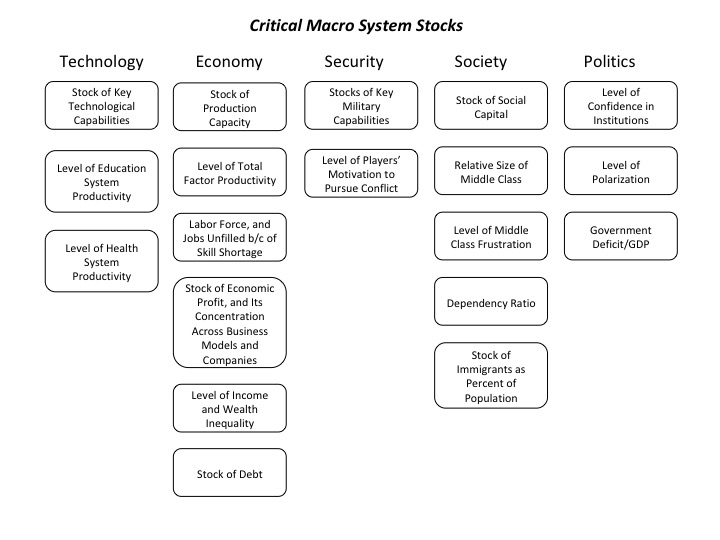
How Close is the Macro System to One or More Critical Thresholds?
As we have noted, the macro drivers of financial market regime changes typically follow a rough chronological sequence, from technology to economic, security, social, and political causes and effects. Yet there are many feedbacks loops between them, creating complex root causes for many of the critical thresholds we have identified.
Understanding the time dynamics in this complex system is critical to avoiding substantial downside investment risk.
We use the UK Met Office Warning Model to communicate our assessment of these time dynamics. We estimate the time remaining before a critical macro system threshold is reached that could trigger a regime change, which is usually accompanied by substantial changes in asset class valuations.
The model uses three increasingly serious levels of warning, from “Be Aware” (condition yellow), to “Be Prepared” (condition orange), to “Take Action” (condition red).
For our purposes, we denote as “Be Aware” (yellow) critical thresholds that we assess to be three or more years away. We estimate that “Be Prepared” (orange) thresholds could be reached within 1 to 3 years. “Take Action” thresholds are very likely to be reached within one year.
Given their nature, we also note that in our three “wildcard” areas (Environment and Energy related; Disease and Human Caused Bioevents; and Cyber and Electromagnetic Events), our forecasts have higher levels of uncertainty.
The following charts summarize our current estimate of the time remaining before different critical thresholds will be reached.
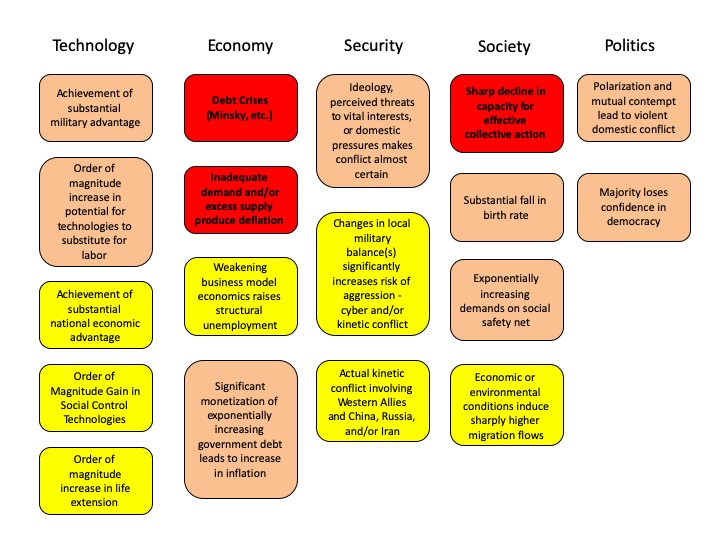
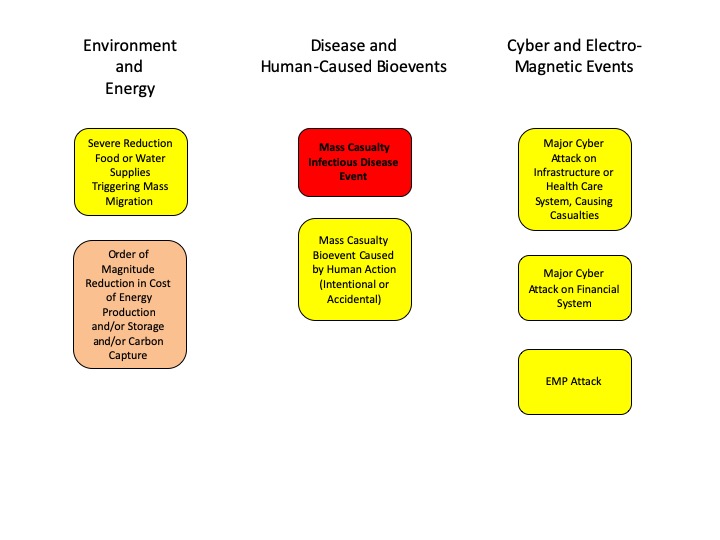
At the highest level, we believe the complex adaptive global macro system can be in one of four states, based on its degree of order versus disorder, and degree of social cooperation versus conflict. A very coarse-grained reading of history suggests that these states evolve in a predictable cycle, from ordered/cooperative, to disordered/cooperative, to disordered/conflicted, to ordered/conflicted.
We believe that the system is currently in its most uncertain state, characterized by high degrees of underlying disorder and social conflict, both domestically and internationally. Beyond some point, intensifying conflict eventually increases the degree of order in the system. That appears to be happening now, via the increasing conflict between China, Russia, and Iran and the United States and other Western nations.
If you have any questions about anything we have written in this issue, please don’t hesitate to get in touch, at contact@indexinvestor.com
Appendix: Anticipatory Thinking and Forecasting Methodologies
Our process is based on methods and tools developed over the past seven years at our affiliate, Britten Coyne Partners, which provides consulting services and education courses to executive teams and boards on strategic risk governance and management.
At The Index Investor, we engage in both anticipatory thinking to identify what could happen (e.g., different macro regimes and related events), and forecasting, to estimate the probability that events and regimes will happen, and the impact they will have if they do (e.g., on macro variables and broad asset class returns).
With respect to what could happen, we are acutely conscious of the conclusion reached by a 1983 CIA study of failed forecasts: "each involved historical discontinuity, and, in the early stages…unlikely outcomes. The basic problem was…situations in which trend continuity and precedent were of marginal, if not counterproductive value."
When it comes to forecasting, we know that in complex socio-technical systems that are constantly evolving, the accuracy of statistical or machine learning based forecasting methods declines exponentially as the time horizon lengthens, since the historical data set on which they were trained will (depending on the speed and effectiveness of any retraining cycle) bear less and less resemblance to the distribution of outcomes the system is likely to produce in the future.
Under these circumstances, forecast accuracy over longer time horizons depends on causal and counterfactual reasoning about the possible future effects of multiple interacting trends and uncertainties that are hard to quantify.
And we are acutely aware of the economist Rudi Dornbusch's famous warning: "Crises take a much longer time coming than you think, then happen much faster than you would have thought."
Our forecasting process also draws on lessons Tom Coyne learned from spending four years as a member of the Good Judgment Project team, which won the Intelligence Advanced Research Projects Activity’s forecasting tournament with forecast accuracy that was more than 50% better than the tournament's control groups (the team's experience is described in Professor Philip Tetlock's book, “Superforecasting").
Our analysis focuses on the probability of the global macro system being in four possible macro regimes 12 and 36 months from the date of our forecast: (1) Normal Times, where equity asset classes perform well; (2) a High Uncertainty regime that is usually short and transitory, where asset classes like short-term government bonds perform best and equities suffer significant declines; (3) High Inflation (which we deem 5% or more, year-on-year), where commercial property, real return bonds and other traditional hedges are favored; and (4) Persistent Deflation (a year-on-year decline in the US CPI), which up to now has only been seen in Japan, and in which the relative performance of different asset classes remains uncertain, but will likely favor high quality bonds and the consumer staples equity sector.
In response to subscriber requests, we have added a 36-month regime forecast to our existing 12 month forecast. The logic is that, in a complex evolving system like global macro, a longer forecast horizon gets beyond the “detection range” of algorithmic forecasting approaches, and therefore raises probability that a manager/investor can gain an edge in identifying emerging threats and opportunities.
That said, because evolving (i.e., “non-stationary”) complex systems populated by highly connected human agents are also capable of sudden non-linear changes (with which are hard for algorithmic approaches to predict), we are also keeping our 12 month forecast.
Our forecasting methodology starts with base rate/reference case data about the historical probability of large changes in equity and bond valuations. We then analyze the current situation from both a quantitative and qualitative perspective. In the latter, we focus on the key endogenous drivers of macro regime change, including technological, economic, national security, social, and political trends and uncertainties. We also focus on three potential sources of exogenous shocks that could also produce a macro regime change, caused by environmental, disease, and cyber related events.
While most of our attention typically focuses on various flows (e.g., economic growth, change in the price level, sales, earnings, job creation, etc.), endogenously caused regime changes result when those flows push key stocks beyond a critical threshold or tipping point, often setting off non-linear reactions across multiple areas. As noted by Hyman Minsky and others, a classic example is the steady accumulation of outstanding debt until it reaches the point where it can no longer be serviced and triggers a crisis.
Base Rate Data
Since the end of World War Two, there have been fifteen months where a downturn in the US equity market began that eventually reduced asset class value by 20% of more. That is a hazard rate of about 1.75% per month. Put differently, in any given month there is a 98.25% probability that a 20%+ downturn won’t occur, or, in a given year, an 81% probability.
However, as the time without a 20%+ downturn extends, the compound probability that one will not occur shrinks. At the end of August 2018, it is more than nine years since the last equity market decline of 20% or more. The probability of that happening is only 15%.
To estimate the base rate for a 20% fall in bond prices (which historically has been caused by a sharp increase in inflation, as we saw in the late 1970s and early 1980s), we analyzed monthly historical AAA bond yields since 1919. For consistency, we used them to calculate the price of a ten-year zero coupon bond. We then calculated the probability of a price decline of 20% or more over three different holding periods: 12, 18, and 24 months. In any month, the annualized probability of a decline of 20% or more over the subsequent 12 months is 12%; over 18 months, 20%, and over 24 months, 25%.
Market Stress Indicators Methodology
We view financial markets as a complex adaptive system. The size of changes generated by such a system follows a power law rather than a normal (Gaussian) distribution. The critical point is that large changes are much more common in complex adaptive systems than most people’s intuition leads them to believe.
While predicting the behavior of complex adaptive systems remains far more art than a science, various researchers have found that large changes in such systems are often preceded by subtle warning signs, as stress accumulates within them. While this research is not definitive, we believe that five warning signs are worth monitoring as potential indicators of growing stress within financial markets that could suddenly give rise to large changes in asset class valuations.
Our first indicator is the month-to-month autocorrelation of broad asset class returns (i.e., the relationship of this month’s returns to last month’s). A system under increasing stress loses resiliency, causing it to take longer to recover from perturbations; hence, autocorrelation increases as it approaches a critical transition (see, “Early Warning Signals for Critical Transitions” by Scheffer, et al).
The second market stress indicator we monitor is the Economic Policy Uncertainty Index published by the Federal Reserve Bank of St. Louis (via its FRED economic database), which is based on research by Baker, Bloom, and Davis (see their paper, “Measuring Economic Policy Uncertainty”). The index is based on automated text analysis of leading newspapers and magazine publications, to identify the frequency with which words and phrases are used that indicate uncertainty.
In humans’ evolutionary past, when uncertainty increased the probability of survival was enhanced by staying close to a group. All of us still have that instinct. Research has found that as uncertainty increases, we have an unconscious bias towards higher conformity of our own views with those of a larger group (i.e., reduction in cognitive diversity). Behaviorally, heightened uncertainty induces more “social copying” of others, likely due to both conformity bias and the rational belief that others may be acting on the basis of superior information. This increase in conformity and copying makes a social system more ordered as uncertainty increases, and also reduces its responsiveness to perturbations (i.e., increases autocorrelation) because of delays in the social copying process.
The key point is that increasing uncertainty induces more, not less order in social systems, and in so doing primes them for sudden non-linear change.
Our third market stress indicator is the spread between the yield on AAA rated bonds and the 10-year US Treasury. This is a proxy for the level of investor concern about financial system funding liquidity.
Our fourth market stress indicator is the yield spread between speculative BB rated bonds and the ten-year US Treasury. Throughout history, excessive credit growth has been a root cause of many financial crises. An indicator of such growth is falling credit spreads, particularly in the case of riskier borrowers. In contrast, rising BB spreads indicate growing investor concern about the consequences of such growth, and the financial distress lower rated companies could experience in an economic downturn.
Our fifth market stress indicator is what we term the “political risk premium” that is implicit in the price of gold. Our starting point for estimating this premium is the three different roles that gold plays. First, gold is a store of value in a world of fiat currencies. When the rate of money supply growth exceeds the growth of nominal GDP, gold’s price should increase to maintain its purchasing power. Between 2007 and 2017, the US money supply (M2) grew by about 86%, while nominal US GDP grew by 35%. The stock of gold grew by 18%, based on mine production over this period. We therefore infer that 33% of the increase in the price of gold represented the maximum potential gold price change that could be attributed to a desire to hedge inflation risk (86% less 35% less 18%).
Second, gold is a unit of account. We take this to mean that the annual change in GDP expressed in terms of physical gold (i.e., nominal GDP divided by the price of gold) should equal the change in real GDP calculated using the GDP price deflator to account for actual inflation over the period. A key challenge is the point at which to start this calculation.
We chose the price of gold in 1995/1996. In that period, the change in real global GDP measured using the IMF’s price deflator just about equaled the change in GDP measured in terms of physical gold. We interpret that coincidence as indicating that at that point in time, concerns about future inflation and political risk were minimal, and the change in the price of gold was mostly driven by its role as a unit of account. We calculated a subsequent series of gold prices that would produce the same change in “gold GDP” as the actual real GDP as calculated by the IMF. Between 2007 and 2017, “gold as a unit of account” warranted a 21% increase in its price.
Gold’s third role is as a hedge against inflation and what we term “political disaster” risk. We subtract the 21% estimated compensation for actual inflation from the 33% “gross” inflation risk hedge to derive an apparent 12% increase in the gold price that reflected the true risk premium to hedge against possible future inflation. However, between 2007 and 2017 the price of gold actually increased by 81%. This implies that 48% of this (81% less 21% less 12%) represented a premium for some other type of uncertainty at the end of 2017. The interesting question is the nature of the uncertainty for which gold is believed by some investors to be a superior hedge than traditional ports in a storm like short-term US government securities, or similar securities issued by other developed countries.
The logical inference is that the uncertainty in question must reflect a situation in which short term US Treasuries would be a less effective hedge than gold. This could be a world of widespread hyperinflation, capital controls, and/or radical changes in nations’ governments (of course, this would also imply a preference for investing in gold coins rather than bullion, as while the latter may be a store of value, it is far less convenient as a means of paying for transactions).
To put this in further perspective, this gold price “disaster risk” premium sharply increased from 2008 to 2012, then declined before sharply increasing again after 2016. Arguably, a significant part of the former increase reflects concerns about the potential inflationary consequences of dramatic quantitative easing by central banks. But this is not likely to be the case after 2016.