The Index Investor
June 2021
Recent Quantitative Indicators
Tactical Asset Allocation Implications of Our Forecasts
Forecast Pre-Mortem Analysis
Combining and Extremizing Forecasts to Improve Predictive Accuracy
Feature Article: Faster Productivity Growth Is Critical. But Will It Happen?
High Value Information Observed Last Month:
- Technology
- Energy and Environment
- Health and Disease
- Economy
- National Security
- Society
- Politics
- Financial Markets and Investor Behavior
Critical System Thresholds/Tipping Points Analysis
Appendix: Anticipatory Thinking and Forecasting Methodologies
Current Macro Forecast
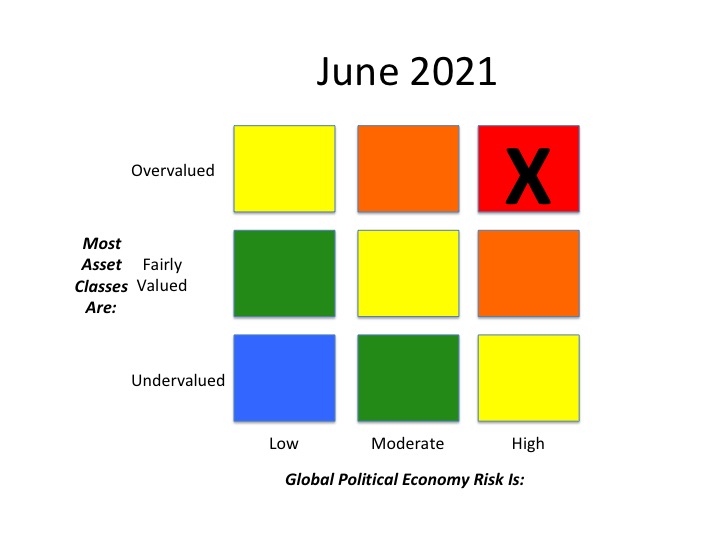
Growing fears of higher inflation have been on most investors’ minds this past month. The balance of opinion seems to be that recent increases in the US Consumer Price Index (CPI) have been driven by a combination of fiscal stimulus (and spending of savings built up over the past year) and supply shortages that are mostly transitory (e.g., the run-up in lumber prices that has already reversed).
Let’s do a Pre-Mortem to pressure test this conventional wisdom. We’ll start by assuming it is three years from now and high inflation has continued, and ask what caused this outcome. We’ll then check to see how much evidence there is today to support these hypothesized causes.
One of the advantages of age is that you were around when important historical events happened. I sat in gas lines in 1973 after the first oil price shock, and was working as a banker in New York when the trailing 12-month inflation rate peaked at 14.6% in March and April 1980. I also lived in Argentina where surviving high inflation is one of the national pastimes.
In my experience, you need three factors (or a wildcard) to sustain and accelerate an increase in inflation:
- First, there is almost always a significant supply shock that persists.
- Second, the initial price increase triggered by the supply shock isn’t offset by a fall in demand.
- Third, for a wage-price spiral, labor has to have significant bargaining power.
- The wildcard factor is usually a collapse in the exchange rate, triggered by a rush for the exits due to a fear of some impending or worsening government action (e.g., increasing deficit spending financed by an increase in the money supply, a threat to seize domestic pension fund assets, or to convert foreign currency denominated domestic government debt into local currency, etc.).
So, let’s look back from the high inflation world of 2024 and explain how we got here.
Significant Supply Shocks
- New SARS-CoV-2 variants caused widespread COVID infections in Taiwan, which prolonged the semiconductor supply shock, which, because of the lead time needed to construct new fabs (and find the talent needed to run them) was already projected to last longer than many had expected. This caused sustained prices rises in significant areas of the economy, including consumer electronics and automobiles.
- When governments set a goal of reaching net zero emissions by 2050, fossil fuel producers cut back investment. When various net-zero policy initiatives and implementation plans fell behind schedule, economic demand drove oil prices above $100/barrel and kept them there.
- Due to delays in expanding the supply of strategic minerals needed to achieve net zero goals (e.g., due to environmental litigation), their prices also experienced a sustained rise.
- The rapid regulatory-driven shift to increased use of renewable sources of power generation led to a sustained increase in electricity prices.
Sustained Demand
- Senate Democrats ended the filibuster rule, and President Biden’s unprecedented fiscal stimulus package was enacted.
- Increasing tensions between the US and China, along with new legislation and regulation, led to an increase in private sector investment to speed up the reshoring of supply chains.
- The Biden Administration secured passage of a carbon tax, the proceeds from which were initially rebated to the public in the form of a “carbon dividend”.
Strengthened Labor Bargaining Power
- Resistance to vaccination and the continuing emergence of new SARS-CoV-2 variants that reduced the effectiveness of current vaccines led to continuing COVID outbreaks that kept many people from returning to the workforce. Employers were forced to offer higher pay and expanded benefits to induce critical employees (e.g., mothers with school aged children) to return to work.
- The poor performance of the US education and reskilling systems led to continuing shortages of workers with critical skills, causing increases in their wages equal to or greater than the rate of inflation. To maintain employee morale and productivity, many employers were forced to increase other workers wages as well.
Wildcards
- When the US and China went to war over Taiwan, global trade collapsed. Widespread and extended supply shortages led to a sharp and sustained increase in many prices.
- As solar activity neared the maximum point in its eleven year cycle, a major coronal mass ejection caused unprecedented geomagnetic storm on Earth which knocked out power grids and many pieces of electronic equipment, leading to sustained supply shortages and price rises in many industries.
This Pre-Mortem analysis makes it clear that a sustained increase in inflation – a return to the High Inflation Regime – could happen. But how likely is it?
Where are the weaknesses in the Pre-Mortem?
- Historically, a sustained increase in energy prices tends to weaken demand, which in turn causes energy prices to decline.
- Experts like former Treasury Secretary Larry Summers have warned that the Biden Administration’s proposed fiscal stimulus package is too aggressive. The recent rise in inflation lends support to his argument. For this and other reasons, the actual amount of fiscal stimulus that is enacted by Congress will likely be significantly smaller than Biden’s original request.
- Kearney’s latest Reshoring Index shows that few manufacturing jobs have been reshored to the US in recent years. However, in a separate survey, manufacturing executives “found that many intend to reshore at least some manufacturing operations over the next three years.”
- Inequality and high existing debt levels remains very strong dampers on demand growth driven by increases in personal consumption spending.
- The financialization of the US economy has led many investors to press companies for higher debt buybacks, which reduces their investment spending.
- Proposals for a carbon tax are opposed by Progressives, who claim it is unfair to poor people (in France, the gilet jaunes protests were sparked by higher taxes on fuels).
- As technologies to automate physical and cognitive processes improve, they will undermine workers’ bargaining power.
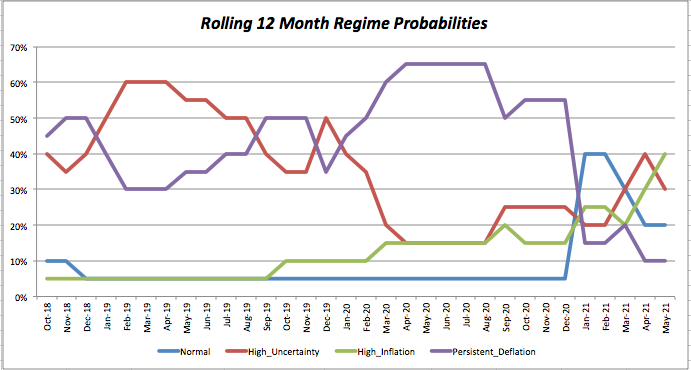
Based on our assessment of the inflation-related evidence, our updated 12-month forecast is Normal Regime, 20% probability; High Uncertainty 30% (down 10%); High Inflation 40% (up 10%), and Deflation 10%.
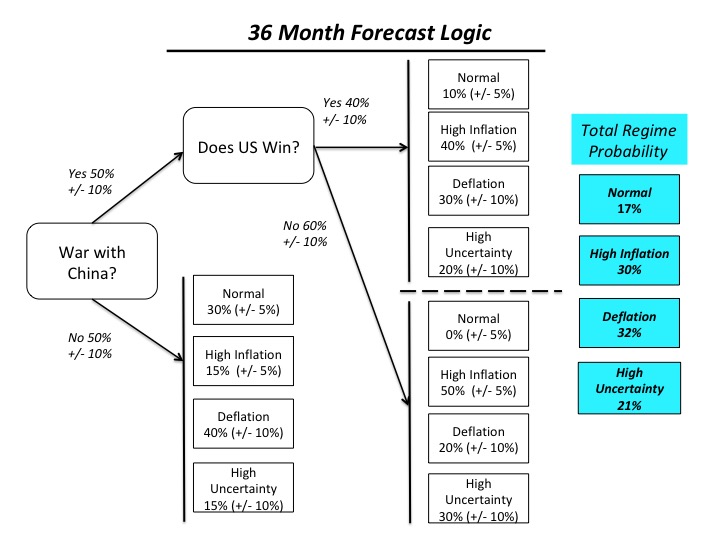
36-Month Forecast
.
This not only slows the diffusion of new information throughout social systems like economies and financial markets, but also causes these systems to coalesce around a small number of narratives. However, as tension increases on various fault lines in the global macro system, the dominant narrative or narrative grows increasingly fragile.
Under these conditions, rapid, non-linear changes are very likely to occur, that are out of proportion to the apparent trigger that sets them off.
Forecast Logic: Quantitative Indicators
Implications of the Most Recent Three Month Asset Class Returns
Our forecasting methodology also includes quantitative analyses of asset class valuations, market stress indicators, and the level and change in three-month returns, over the most recent and previous three-month periods, for those asset classes, which should perform best under different regimes (in this sense, our regimes can be regarded as macro factors).
We assume that that the rolling three month returns reflect investors’ views regarding the relative probability that a given macro regime will develop in the future.
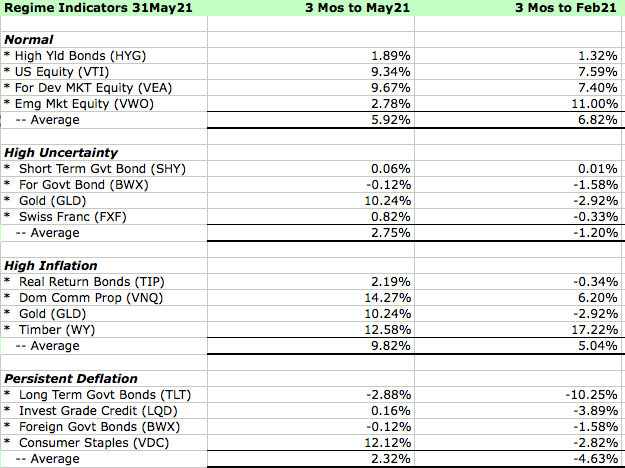
While we agree with the relative probability of the higher Inflation Regime over the next 12 months, we disagree that the probability for the Normal Regime is higher than the High Uncertainty Regime.
On a 36-month horizon, our views diverge even more with recent market returns.
Asset Class Valuation and Momentum Indicators (@31May21)
| Asset Class (ETF) | Valuation | 1 Month Return | Conclusion |
| US Real Return Govt Bond (TIP) | Likely Overpriced* | 1.02% | Increasing Overvaluation |
| US Nom Return Govt Bond (GOVT) | Fairly Priced* | 0.19% | Fairly Valued |
| US Investment Grade Credit (LQD) | Top of Fairly Priced Range* | 0.62% | Fairly Valued |
| US High Yield Credit (HYG) | Almost Certainly Overpriced* | 0.64% | Increasing Overvaluation |
| US Commercial Property (VNQ) | Likely Overpriced* | 7.86% | Increasing Overvaluation |
| US Equity (VTI) | Almost Certainly Overpriced* | 5.04% | Increasing Overvaluation |
| Foreign Devel Mkt Equity (VEA) | Likely Overpriced* | 3.58% | Increasing Overvaluation |
| Emerging Markets Equity (VWO) | Almost Certainly Overpriced* | 1.70% | Increasing Overvaluation |
| Timber (WY) | Fairly Priced* | (2.09%) | Fairly Valued |
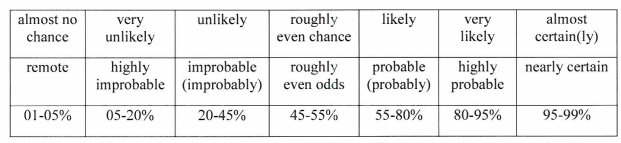
Note: The language we use to describe our estimated likelihood of asset class over or undervaluation is based on US Intelligence Community Directive 203 on Analytic Standards, which includes the following table:
Market Stress Indicators (@31May21)
| Market Stress Indicator | This Month vs Last Month |
| Asset Class Returns Autocorrelation (this month versus last month). Higher autocorrelation is an indicator of more tightly coupled and fragile markets. | .02 versus .39 the previous month. This indicates a decreasing level of market stress. |
| Economic Policy Uncertainty Index (how many days over the last 30 was index in top quartile of values since 1985?). A higher number equals more market stress. | On 14 days last month the index was in the top quartile of daily values since 1985 (the 81st) percentile of all rolling 30-day periods), a substantial increase from 9 days the month before, indicating rising market stress. |
| AAA Rated Bonds Spread over 10 Year Treasury Yield (month end). Higher spreads indicate rising concern about market liquidity. | 1.32% (51st percentile since 1983), essentially unchanged from 1.29% last month. |
| BB Rated Bonds Spread over 10 Year Treasury Yield (month end). High spreads indicate increasing credit risk. | 2.42% (22nd percentile), up slightly from 2.37%, last month, indicating a low level of stress. Given our Regime forecast, this is almost certainly inadequate compensation for the current risk of BB rated bonds. |
| Gold Price per Ounce in US Dollars (month end). Rising gold prices are an indicator of increasing market uncertainty and stress. | $1,892 versus $1,768, up 7.0% from the previous month. At the end of 2017, we estimated the “disaster premium” in the gold price was 47% (see our methodology in the Appendix). At the end of last month it was 93%, up from 83% the previous month. Given our forecast, this is likely too low. |
Portfolio Allocation Implications of Our Forecast
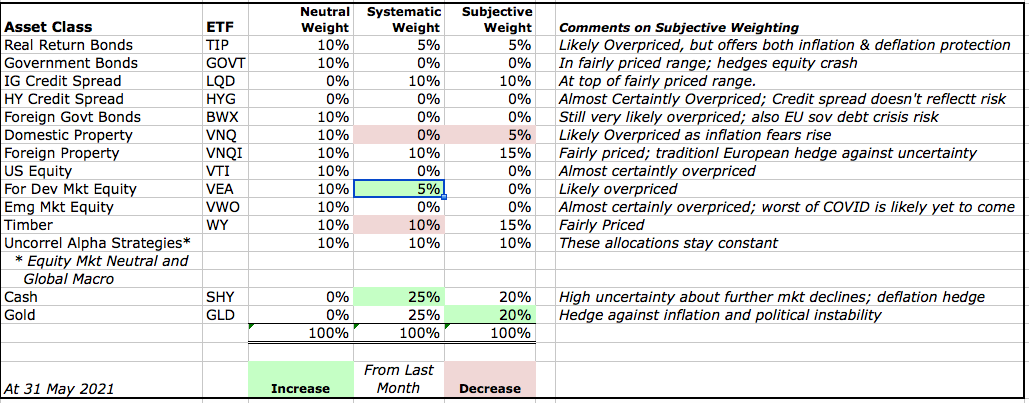
We take two approaches to deriving the tactical asset allocation implications from our analyses (i.e., deviations from our "neutral" or base case model portfolio).
The first takes a systematic approach, and is based on relative asset class valuations. Our starting point is our neutral model portfolio, which is equally weighted across nine broad asset classes, and also includes 5% allocations to alpha strategies (equity market neutral and global macro) that are designed to have a low correlation to returns on broad asset classes.
Based on asset class valuations, we systematically vary the asset class weights (but not the active strategy weight), increasing from 10% to 15% when an asset class is likely undervalued, and 15% when it is very likely undervalued. In the case of overvaluations, we go to 5% and then into cash, if there are no undervalued asset classes with room for an increase. In effect, this replicates the systematic rebalancing strategy we used for 15 years in our previous model portfolios.Based on subscriber requests, this month we are re-introducing a feature from the previous version of The Index Investor: Tactical Asset Allocation Implications from our analyses.
The second tactical approach is based on our subjective view not only of current asset class valuations, but also of the implications of the broader macro trends and uncertainties that we analyze each month. Importantly, this subjective view reflects our primary goal of avoiding large downside losses, rather than seeking large upside gains.
Three final notes: First, with respect to US fixed income, we include credit products (investment grade and high yield) in the same asset class as government debt, and will shift into the former when their valuations become attractive.
Second, we regard gold not as a separate asset class to be held long-term, but rather as a complement to cash, into which we shift in periods of substantial overvaluation across multiple asset classes.
Third, we continue to be deeply concerned by the distortion in asset class valuations that have been created by negative real interest rates on sovereign bonds, which are the foundation of most asset pricing models. In August, we decided to address this distortion by using in our asset class valuation models our estimate of the economically logical real yield on inflation protected US government bonds (TIPs). This brings our quantitative valuation conclusions much closer to those based on our qualitative analysis.
More information about our investment beliefs, including our core philosophy, approach to asset allocation (including our model portfolios and their long-term track record), and views on various approaches to active and passive management can all be found here.
Here is our latest asset allocation view:
Pre-Mortem Analysis
One of the most important forecasting disciplines is to ask yourself why your forecast could be wrong. Dr. Gary Klein’s research has shown that a very powerful and insightful way to do this is via a “pre-mortem analysis.” This method asks you to assume that it is a point in the future, and your forecast has been proven wrong (or your strategy or company has failed). You are then asked to look backward from this imagined point in the future, to explain why you failed, what you missed, and what you could have done differently to avoid your fate.
The pre-mortem method takes advantage of the fact that humans reason much more concretely and in more detail when explaining the past than they do when trying to forecast the future.
So let us assume that it is one year from now, and our current forecast has turned out to be wrong.
How did this happen? What developments did we fail to anticipate?
- Following the election of Joe Biden, the removal from office Xi Jinping could lead to a reduction in the dangerously growing conflict between the US and China. The impact of this surprise seems uncertain. To the extent that reduced external threat reduces the perceived urgency of implementing structural reforms in the US, it would increase the probability of the High Inflation Regime. Yet at the same time, it could accelerate economic and political reforms in China, which would increase economic growth there, creating a more dangerous medium term situation for the United States.
- A supply side shock of some type – beyond the disruption of global supply chains caused by COVID-19 -- could produce a sudden increase in inflation. The most likely scenario is a reduction in oil supplies due to a prolonged kinetic conflict between Iran and the US. An unlikely scenario could be major crop failures associated with the next solar cycle, which NASA forecasts will be the weakest in 200 years. McKinsey recently concluded that the probability of such a failure has increased due to changes in the environment, and now stands at about 10% over the next five years ("Will the World’s Breadbaskets Become Less Reliable?”).
Note: Combining Our Forecasts with Others From Other Sources and Extremizing the Result Should Increase Your Predictive Accuracy
Research has found that three steps can improve forecast accuracy. The first is seeking forecasts based on different forecasting methodologies, or prepared by forecasters with significantly different backgrounds (as a proxy for different mental models and information). The second is combining those forecasts (using a simple average if few are included, or the median if many are). The final step, which significantly improved the performance of the Good Judgment Project team in the IARPA forecasting tournament, is to “extremize” the average (mean) or median forecast by moving it closer to 0% or 100%.
Forecasts for binary events (e.g., the probability an event will or will not happen within a given time frame) are most useful to decision makers when they are closer to 0% or 100% than the uninformative “coin toss” 50%. As described by Baron et al in “Two Reasons to Make Aggregated Probability Forecasts More Extreme”, forecasters will often shrink their probability estimates towards 50% to take into account their subjective belief about the extent of potentially useful information that they are missing.
When you average multiple forecasters’ estimates, you are including more information, which should increase forecast confidence and push the mean estimate closer to 0% or 100%. However, this doesn’t happen when you use simple averaging. For this reason, forecast accuracy is increased when you employ a structured “extremizing” technique to move the mean estimate closer to 0% or 100%.
You can download an extremizing model from our website to use when combining the forecasts you use in your decision process.
The extremizing factors in our model are those that the Good Judgment Project found maximized the accuracy of combined forecasts. Note that the extremizing factor is lower when average forecaster expertise is higher. This is based on the assumption that a group of expert forecasters will incorporate more of the full amount of potentially useful information than will novice forecasters.
Feature Article: Thoughts for New Graduates: The Impact of System Factors, Skill, and Luck on Your Future
Like history, your future will emerge from the interaction of three causes: The nature of the system, the skill of human agents, and luck. In the years ahead, it will serve you well to keep some important points about each of these in mind.
The Nature of Many Real World Systems
If you’re like most students, during your years in school you probably heard a lot about systems dominated by linear cause/effect processes and negative (dampening) feedback loops that kept them in or close to equilibrium. You also probably used the familiar normal/Bell Curve/Gaussian distribution to statistically describe the results these systems produced.
Unfortunately, that is not how many large and very important real world systems work.
Instead, in complex systems many effects have multiple causes. A significant number of these cause/effect relationships are non-linear, and/or time delayed. In addition to negative feedback loops, complex systems also have strong positive (accelerating) feedback loops. Consequently these systems often operate far from equilibrium.
The results complex systems produce are often best described by power laws. Statistically, the variance of the distribution of these results is therefore not well defined. This means that it is very hard to use statistics to understand the range of possible outcomes complex systems can produce. The emergence of so-called “Black Swan” events is one of their common features.
Many complex systems are also “adaptive”, as they contain reasoning agents who adapt their strategies over time to achieve goals, which themselves may also evolve.
In Complex Systems, What Does It Mean to Be Skilled?
My favorite quote about the relative importance of systems and skills comes from Warren Buffett: “When a management [team] with a reputation for brilliance tackles a business [system] with a reputation for bad economics, it is the reputation of the business that remains intact." That often comes as a surprise to people who have been marinating in meritocracy throughout their years of schooling.
The truth is, when people are immersed in complex adaptive systems, most struggle to achieve their goals. In a recent paper, Anne Marie Grisogono (a complex adaptive systems expert who recently retired from Australia’s Defence Science and Technology Organization) summed up the research on why this happens:
“Low ambiguity tolerance was found to be a significant factor in precipitating the behavior of prematurely jumping to conclusions about the problem and what was to be done about it, when faced with situational uncertainty, ambiguity and pressure to achieve high-level goals. The chosen (usually ineffective) course of action was then defended and persevered with through a combination of confirmation bias, commitment bias, and loss aversion, in spite of available contradictory evidence.
"The unfolding disaster was compounded by a number of other reasoning shortcomings such as difficulties in steering processes with long latencies and in projecting cumulative and non-linear processes. Overall they had poor situation understanding, were likely to focus on symptoms rather than causal factors, were prone to a number of dysfunctional behavior patterns, and attributed their failures to external causes rather than learning from them and taking responsibility for the outcomes they produced.”
Grisogono also summed up what is different about those who manage to achieve their goals:
“They developed a [necessarily incomplete] conceptual model of the situation, and took actions based on causal factors, seeking to learn from unexpected outcomes. They constantly challenged their own thinking and views. Most importantly, they displayed a higher degree of ambiguity tolerance than the unsuccessful majority” (from Grisogono’s paper, “How Could Future AI Help Tackle Global Complex Problems?”).
Elsewhere, research conducted by Britten Coyne Partners, an affiliate of The Index Investor, has found that not considering time dynamics is another important source of failure in complex environments.
Here’s a simple example. In an investment context, consider an investor with $100,000 who wants to accumulate $133,000 after three years. Seeking high returns, they invest all their funds in the equity market, overlooking the fact that the variability of equity returns is higher than in other asset classes. In the first year their equity investment loses 20%, and is worth $80,000. To return to breakeven by the end of year two, it must earn a return of not 20%, but 25%. And 33% will be required in year three to achieve the investor’s goal.
When taking actions that have uncertain outcomes to achieve multi-period goals, significant setbacks reduce the probability of success by more than most people realize. That’s why smart risk management is critical in complex adaptive systems. By all means take risks – achieving ambitious goals is impossible if you don’t. But when taking those risks, try to find ways to limit your downside, such as creating robust plans (that will achieve your goals under a range of scenarios), building resilient processes (to cushion the blow when robustness fails), and cultivating an adaptive mindset.
Another reason that risk management is critical is that because of their complex causal relationships, time delays, non-linearities, and continuous evolution, forecasting future outcomes produced by complex adaptive systems is extremely difficult, even over relatively short periods. The challenge grows exponentially harder as the time horizon lengthens.
To be sure, there are some promising quantitative methods on the horizon for forecasting outcomes produced by complex adaptive systems (e.g., combinations of agent based modeling and artificial intelligence methods like reservoir computing). But we’re still probably quite a few years away from those methods being perfected, much less widely diffused and deployed.
That means we’re left with qualitative approaches to forecasting and decision making in complex adaptive systems, such as those used by the Good Judgment Project (described in the book “Superforecasting” by Tetlock and Gardner) or Marvin Cohen’s Recognition/Metacognition model (as described in his paper, “Metarecognition in Time-Stressed Decision Making: Recognizing, Critiquing, and Correcting”).
The former can be summed up as follows (I was on the GJP team for all four years):
- Start by looking for a base rate for the outcome you’re trying to forecast (e.g., for many business outcomes, Mike Mauboussin’s “The Base Rate Book” is an excellent source). It usually won’t be a perfect match, but it is a critical starting point.
- Then consider factors specific to the forecasting question at hand. What are the key elements in the situation? How are they related (look for non-linear relationships)? How could the interaction of these elements cause the situation to evolve, either on their own or in response to actions you or others might take? The more similar the forecasting question is to the one behind the base rate you used, the more cautious you should be about moving your situation specific forecast away from the base rate.
- Keep adjusting your forecast as you receive two types of new information. High value evidence is more likely to be observed (or not observed) if just one of your hypotheses is true. Information that triggers a feeling of surprise is a warning that your mental/forecasting model is incomplete and needs to be updated.
- After you make a forecast, always do a Pre-Mortem. Assume that it is some point in the future and it has turned out to be wrong (or your plan has failed). Write down (a) why this happened; (b) what signals you missed; and (c) what you could have done differently to avoid failure. This method works because we are much more detailed in our thinking when we seek to explain the past than when we try to anticipate the future. Use the result of your Pre-Mortem (which works even better when done in a group) to rethink your forecasting model, collect new information, and/or modify your plan.
- Last but not least, improve your predictive accuracy by combining your forecast with others, ideally ones that are based on different information and/or a different methodology.
Another aspect of what it means to be skilled in the context of complex adaptive systems is being aware of some critical aspects of human nature that make it easier to forecast the behavior of people, groups, and organizations and sometimes even larger aggregations (e.g., investor behavior).
In our experience, some of the most important include:
- To explain, predict, and remember, human beings have used stories and narratives from the earliest times. The emotions they trigger make them powerful – but also resistant to change. Hence the conventional wisdom is often lags behind the real state of affairs.
- We are naturally overoptimistic, and motivated reasoning (i.e., supporting our existing beliefs or preferred outcomes) drives our attention and often leads to overconfidence.
- When uncertainty increases, we rely more on social learning/copying and the most popular narrative, and less on the public and private information we possess. That is why as uncertainty increases (e.g., as asset class valuations approach or surpass historic highs), a limited number of narratives often grow stronger, even as they are becoming more fragile.
- Rising uncertainty also leads human beings to become more conformist, either to the views of a group or those of a strong leader. That was very adaptive deep in our evolutionary past, but is much less so today.
- In today’s world of hyperconnectivity and ubiquitous social media, and the increased complexity and uncertainty it creates, these evolutionary instincts have become supercharged.
- When an individual knows the result of a decision will be private, they tend to be risk averse. But when they know it will be public, the reverse happens (as both the decision outcome and social status will be at stake).
- When organizations are small, errors of omission (missed alarms) are often seen as more important than errors of commission (false alarms). But as organization grows, the demand for increased consistency and predictability lead to just the opposite. Hence the larger the organization, the more prone it is to being surprised.
Some Thoughts on Luck
In a society dominated by a belief in meritocracy, we tend to focus on skill as the key determinant of outcomes, and devalue the roles of system factors and luck. Except when things don’t go our way. Then it’s due to bad luck.
This is a shame, because a deeper examination of system factors and luck provides a much more complete – and healthier – understanding of the complex root causes of many of life’s outcomes.
Here’s one example. Consider a thousand people who at 21 are given $10,000 in initial capital. For each of the following twenty 29 years, each person’s capital is increased by a random draw from the same distribution of annual returns. When they turn fifty, a few people will be very rich. The majority will not. In fact, most will be below the average level of wealth. And some will have no capital left.
That is the nature of luck. To be sure, in life we draw from multiple distributions, whose draws are imperfectly correlated to varying degrees. That helps to balance out outcomes (e.g., I know some very rich people who are far below average in some other important areas of life). But it is still important to recognize the nature of what we call luck (or randomness) when it comes to accumulated advantages that are created by multiplicative processes (i.e., the “Matthew Effect”).
This is even more so the case when social influence or network effects drive those advantages (e.g., see Salganik, Dodds, and Watts’ famous paper, “Experimental Study of Inequality and Unpredictability in an Artificial Cultural Market”).
This has let researchers to conclude that there are clear limits to our ability to predict the outcomes of complex adaptive systems with high degrees of social interaction (e.g., “Exploring Limits to Prediction in Complex Social Systems”, by Martin et al). Another research project also concluded that, despite the availability today of massive amounts of data on individuals, we still cannot predict their life outcomes (“Measuring The Predictability Of Life Outcomes With A Scientific Mass Collaboration”, by Salganik et al).
To be sure, there are other kinds of luck, both good and bad, over which we have little or no control that can have both small and large consequences. A famous example occurred on December 13, 1931 when Winston Churchill looked the wrong way when crossing Fifth Avenue in New York City and was hit by a car. While injured, he survived. If he had not, the course of world history would very likely have been different. The same is undoubtedly true in the case of people who died too young.
A paradoxical thing about this kind of luck is that in some cases its impact on outcomes becomes more important as intense competition makes the level of skill among competitors more equal over time. This happens in some professional sports (e.g., hockey), and arguably active investment management. See Mike Mauboussin’s book, “The Success Equation”.
Is there anything you can do to increase your chances that both forms of luck – accumulated advantage and randomness – will work to your advantage and not your detriment?
Seven Questions to Ask Yourself
To put what follows in perspective, I graduated from college in the 1970s. In the years since, I’ve asked my friends from around the world (whose lives have taken a wide variety of paths, both intended and unintended), what questions they wish they had asked themselves when they were younger.
I make no claim that group sample is in any way representative of any population. Rather, they are a very diverse group who have experienced a wide range of ups and downs across their careers, and who have spent a lot of time reflecting upon their (often colorful) experiences. Here is my distillation of their collected wisdom:
- What activities do I most enjoy/am I relatively best at? They are usually but not always the same.
- What issues/problems/challenges most interest me? In which of these do I often find myself so immersed in that I lose track of time?
- What are the characteristics of the organizational culture in which I thrive (especially the type of boss I report to and the teammates with whom I work)?
- What kind of relationship/family do I want to have?
- Where do I want to live, and why?
- How much money do I/we need to make to have the kind of lifestyle I/we want to have over the next five years?
- What are the most important regrets I don’t want to have at the end of my life?
Inevitably there will be tradeoffs between these questions. Most people can’t have it all, or at least have it all at once. But by asking them when you’re young, you substantially increase the chances that you’ll have a sense of purpose and meaning in your life – and as a result will be a much better partner, parent, teammate, and leader.
You’ll also raise the odds building cumulative advantage, and being better able to exploit good luck and bounce back from bad luck.
Too many people don’t spend enough time thinking about these tradeoffs, and end up making them unconsciously. Trust me, you don’t want to wait to consciously confront them until a painful life event forces you to do so.
So, to sum up: You are going to live your adult life in a world of complex adaptive systems for which your education probably didn’t prepare you too well. It is easy to feel overwhelmed, and tempting to turn to popular narratives to make sense of it.
Resist that temptation. There are knowledge and skills you can learn that will enable you to thrive despite, and in some cases because of that complexity.
Above all, it helps immensely to know who you are and what you’re looking for in life. That is the path to finding purpose, meaning, and peace in our complex, hyperconnected, uncertain, and anxious world.
Good luck.
High Value Information Observed Last Month
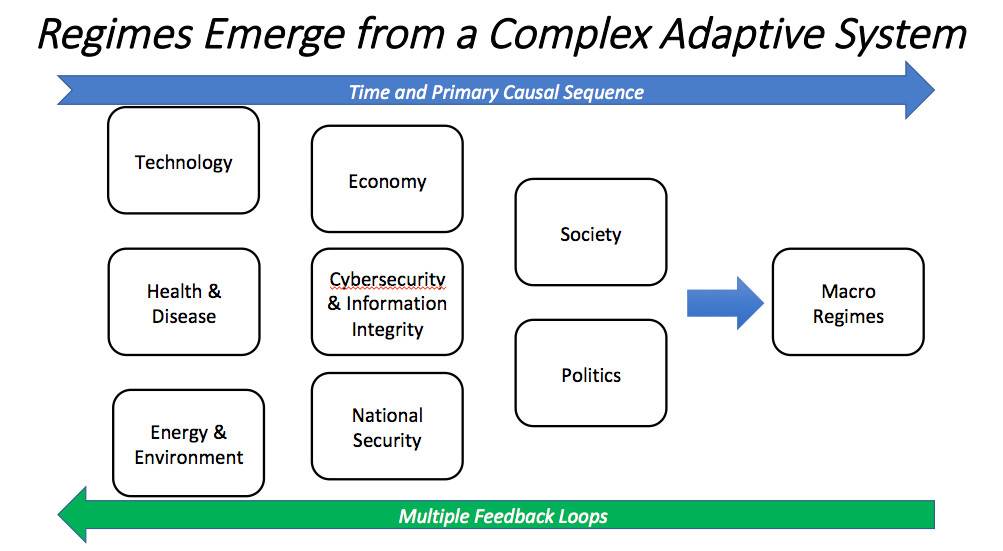
In our model of the complex global macro system, change drivers are arrayed across a roughly chronological process (albeit one with many feedback loops), in which technological, health, and environmental changes precede changes in the economy and national security, which in turn lead to changes in society and politics, all of which produce (albeit with multiple feedback loops) the effects we observe in investor behavior and financial market valuations and returns.
To generate alternative future scenarios and critical forecasting questions, we use this framework to identify multiple paths across these issue areas, including alternative outcomes for critical uncertainties.
In our methodology, we take a Bayesian approach, and classify new information as significant and highly valuable if either it (1) is an “indicator”, which reduces our uncertainty about the value of a parameter in our mental model for making sense of the dynamic macro system, or (2) it is a “surprise” which increases our uncertainty about either the range of potential values for a parameter or the structure of our model.
With respect to indicators, the higher our priori probability is for a regime, the more we look for indicators that it will not occur, and the lower our prior probability for a regime, the more we look for indicators that it will occur. Put differently, try to systematically search for high value indicators that disconfirm our prior views.
| New Technology Information: Indicators and Surprises | Why Is This Information Valuable? |
| The BBC and other media broke a story about China’s large scale testing of emotion detecting facial recognition/AI systems in Xinjiang, where it has been accused of genocide against the Muslim Uighur population | According to the BBC story (“AI Emotion-Detection Software Tested On Uyghurs”, by Jane Wakefield), an engineer familiar with the system claimed “the AI system is trained to detect and analyse even minute changes in facial expressions and skin pores…the software creates a pie chart, with the red segment representing a negative or anxious state of mind. The engineer claimed the software was intended for pre-judgment without any credible evidence". Apparently, in their pursuit of ever more effective surveillance and social control technologies, Chinese authorities are not concerned with findings reported in a recent Financial Times editorial, “Computers Are Not The Best Judge Of Our Emotions”. The FT notes that, “emotional AI is being used in sectors ranging from advertising to gaming to insurance, as well as law enforcement and security. It holds out the prospect of using facial clues to figure out what to sell people and how they respond to adverts; to check whether drivers or schoolchildren — or those working from home — are paying attention; or to spot people who are acting suspiciously… “Trials have suggested AI systems are far from perfect at discerning whether humans are telling the truth… Critics charge that the underlying assumptions of emotion recognition — that humans experience a universal set of emotions and manifest them in similar ways — are deeply flawed, and ignore differences between cultures and even individuals… “If it can be made to function in a reliable and trusted manner, emotion recognition offers at its best a way to humanize technology and to help businesses to understand customers far more deeply. At worst, it could be an invasive tool of surveillance capitalism. The right balance must be found.” |
| “Deep Tech: The Great Wave of Innovation”, by BCG | Get ready for the great wave—the next big surge of innovation powered by emerging technologies and the approach of deep tech entrepreneurs. Its economic, business, and social impact will be felt everywhere because deep tech ventures aim to solve many of our most complex problems… “Deep tech describes an approach enabled by problem orientation and the convergence of approaches and technologies, powered by the design-build-test-learn (DBTL) cycle that de-risks and accelerates both product development and time to commercialization… The great wave encompasses artificial intelligence (AI), synthetic biology, nanotechnologies, and quantum computing, among other advanced technologies. But even more significant are the convergences of technologies and of approaches that will accelerate and redefine innovation for decades to come.” |
| | |
| | |
| | |
| | |
| | |
| | |
| | |
| | |
| | |
| | |
| | |
| New Energy and Environment Information: Indicators and Surprises | Why Is This Information Valuable? |
| According the US National Oceanic and Atmospheric Administration (NOAA), in May the amount of CO2 in the atmosphere reached 419 parts per million, which some analysts claim is the highest level in human (but not planetary) history. | Due to rising CO2 levels, the World Meteorological Organization’s “Global Annual to Decadal Climate Update” estimated that: “Annual mean global (land and sea) mean near-surface temperature is likely to be at least 1°C warmer than pre-industrial levels (defined as the average over the years 1850-1900) in each of the coming 5 years and is very likely to be within the range 0.9 – 1.8°C” “It is about as likely as not (40% chance) that at least one of the next 5 years will be 1.5°C warmer than pre-industrial levels and the chance is increasing with time.” A recently published research paper (“Complex Systems Approaches for Earth System Data Analysis” by Boers et al) emphasizes the uncertainty we face regarding the potential for non-linear weather effects once critical thresholds/tipping points are passed (and, for example, their impacts on coastal flooding and food production). While such tipping points are hard to specify, complex systems theory suggests that warning signs will appear as we grow closer to them. In another recent paper, Boers and his co-authors note that one such warning sign (known as the “critical slowing down” of a complex system) may be occurring in the case of the Greenland Ice Sheet. They note that, “The Greenland Ice Sheet (GrIS) is a potentially unstable component of the Earth system and may exhibit a critical transition under ongoing global warming. Mass reductions of the GrIS have substantial impacts on global sea level and the speed of the Atlantic Meridional Overturning Circulation, due to the additional freshwater caused by increased meltwater runoff into the northern Atlantic… “Melting rates across Greenland have accelerated nonlinearly in recent decades, and models predict a critical temperature threshold beyond which the current ice sheet state is not maintainable.” They conclude that, “significant early-warning signals indicate that the central western GrIS is close to a critical transition…suggesting substantial GrIS mass loss in the near future.” |
| In a new report, the International Energy Agency (IEA) set surprisingly aggressive targets for reduction in fossil fuel use (“Net Zero by 2050: A Roadmap for the Global Energy Sector”). | SURPRISE The IEA claims that cutting carbon emissions to zero by 2050 would limit the increase in global temperature to 1.5 degrees centigrade. However, there is a catch. As the FT noted, this “would require a total transformation of the global economy over the next three decades.” Looking just at the electric power generation sector, it would require nearly the total elimination of global coal and gas fired power without attached carbon capture and storage (CCUS) technologies, whose use today would substantially increase electric prices, and which still significant regulatory skepticism (e.g., about the long term safety of storing large amounts of CO2 underground). The IEA also assumes that electric vehicles will account for 60% of total sales, up from about 5% today. A global carbon tax would also need to be imposed, rising to USD 250/metric ton by 2050. Perhaps the best that can be said about this report is that, by making clear the real constraints on reducing emissions, perhaps a better use of the scarce resources available for environmental investment would be to spend a greater portion of them projects to mitigate the very likely consequences of further increases in average global temperature. |
| Another new IEA report, “The Role of Critical Minerals in Clean Energy Transitions” makes it clear why Net Zero by 2030 is almost certainly an unrealistic goal. | “Today’s supply and investment plans for many critical minerals fall well short of what is needed to support an accelerated deployment of solar panels, wind turbines and electric vehicles. Many minerals come from a small number of producers. “ For example, in the cases of lithium, cobalt and rare earth elements, the world’s top three producers control well over three-quarters of global output. This high geographical concentration, the long lead times to bring new mineral production on stream, the declining resource quality in some areas, and various environmental and social impacts all raise concerns around reliable and sustainable supplies of minerals to support the energy transition.” Writing in the defense publication “War on the Rocks” (“Trading One Dependency For Another”), Nadia Schadlow is even more blunt: “Several of the Biden administration’s key climate goals — particularly steps to reduce U.S. greenhouse gas emissions in the power and transportation sectors — are likely to be held hostage by China. A shift away from fossil fuels to renewables to produce electricity, and the deployment of more electrical vehicles on America’s roadways, depends upon batteries. Since China currently controls the entire lifecycle of battery development, the Biden administration needs a strategy to mitigate China’s dominant position… “The battery supply chain is complex, but it can be reduced to four key elements: mining the critical minerals, processing them, assembling the battery parts, and recycling… “China has spent the last two decades solidifying control over the main critical minerals for battery cells — lithium, cobalt, and graphite. Beijing now controls some 70percent of the world’s lithium supplies, much of which is located in South America. More than two-thirds of the world’s cobalt reserves are found in the Democratic Republic of the Congo, and China has secured control over 10 of the country’s 18 major mining operations, or more than half its production. “Beijing is also the world’s largest consumer of cobalt, with more than 80 percent of its consumption being used by the rechargeable battery industry. “Graphite is the largest component by volume in advanced batteries, but spherical graphite, the kind that makes up the anode in electrical vehicle batteries, must be refined from naturally occurring flake graphite. And China produces 100 percent of the world’s spherical graphite." |
| Environmental advocates scored impressive victories in their fight to force public companies to cut emissions. | SURPRISE In the United States, an activist investment fund won a proxy contest to seat two directors on Exxon’s board, who promised to push for a more aggressive strategy to reduce emissions. Across the Atlantic, a Dutch court ordered Shell to accelerate the reduction of its net carbon emissions, so that by 2030 they are 45 percent lower than they were in 2019. Shell had previously announced a goal of reducing them by 20% by 2030. Shell immediately said it would appeal the judge’s decision. Of the two, the Shell decision was almost certainly the most consequential, as it established a potential precedent for a court to intervene in a private company’s operations, on the theory that it has a duty of care to pursue emissions reductions goals that are in line with the Paris Climate Agreement and its goal of limiting the rise in global temperature to 1.5c. |
| “How the Insurance Industry Could Bring Down Fossil Fuels” by Tom Johansmeyer in Harvard Business Review | Having done turnarounds (where directors of a company operating in financial distress give great deference to their counsel and terms of their Directors and Officers Insurance policy before making any decisions), and also worked as an energy industry executive, I have always observed that the power of insurance carriers to affect decisions is vastly underappreciated by many people. Clearly, Tom Johansmeyer is not one of them. At developments like the above mentioned Shell decision raise prospect of a rising tide of liability litigation and potentially rising payouts (nobody has forgotten to the tobacco industry), I suspect that the impact of the increasing cost for insurance coverage in fossil fuels industries will have a much larger impact – at least in the short term – than any regulatory changes or changes in the preferences of institutional investors. |
| | |
| | |
| | |
| | |
| | |
| | |
| | |
| | |
| New Economic Information: Indicators and Surprises | Why Is This Information Valuable? |
| “Companies Prepare Share Buyback Bonanza as Profits Surge”, in the Financial Times. “US companies announced $484bn in share buybacks in the first four months of this year, the highest such total in at least two decades, according to Goldman Sachs. “The figure foreshadows a big acceleration in the pace of buybacks, which have already begun to rebound from their nadir last year, when the pandemic encouraged companies to hoard cash in case of a long downturn.” | As you recall from last month’s feature article (“Faster Productivity Growth is Critical. But Will It Happen?”) it is not enough to develop more productive technologies. You also have to scale them up across the economy to achieve sustained gains in productivity and growth. That requires two critical components: Investment and a growing supply of employees with the skills needed to make full use of the new technology. Free cash flow spent on a record level of stock buybacks does not bode well for future productivity growth. |
| There have been multiple new indicators of rising concern with “corporate zombification”, particularly in the European Union. This represents another potential drag on productivity growth | A new report from the European Central Bank (“Corporate Zombification: Post-Pandemic Risks In The Euro Area”, by Helmersson et al) noted that, “Policy measures aimed at supporting corporates and the economy through the coronavirus pandemic may have supported not just otherwise viable firms, but also unprofitable but still operating firms – often referred to as zombies”. “This has in turn raised questions about an increased risk of zombification in the euro area economy, which could constrain the post-pandemic recovery. “Firm-level, loan-level and supervisory data for euro area companies suggest that zombie firms may have temporarily benefited from loan schemes and accommodative credit conditions – but likely only to a modest degree. “These firms may face tighter eligibility criteria for schemes and more recognition of credit risk in debt and loan pricing in the future. Tackling the risk of zombification more fundamentally requires the consideration of suggested reforms to insolvency frameworks, and better infrastructure for banks to manage non-performing loans.” In another recent report (“Prevention and Management Of A Large Number Of Corporate Insolvencies”) the European Systemic Risk Board observed that, “A key question is the extent to which support measures in this crisis have had the effect of merely postponing or durably preventing a large wave of corporate insolvencies. In a worst-case scenario, the postponed insolvencies would suddenly materialise and trigger a recessionary dynamic, potentially causing further insolvencies. The current low rate of insolvencies would then be similar to the sea retreating before a tsunami"… This would lead to knock-on effects: “A significant rise in corporate insolvencies would translate into higher non-performing loans (NPLs) and impair the banking sector’s ability to finance the economic recovery.” In addition, “Large-scale government support in the form of loan guarantees have increased contingent liabilities and made the sustainability of public finances more dependent on the recovery of the corporate sector. A surge in corporate insolvencies would result in an additional burden on public budgets on top of the well-known impact of automatic stabilisers during a recession.” |
| Another new report, from Moody’s, the credit rating agency, found that in the case of US insolvencies, the percent of a debt’s face value that lenders recover is now much lower than in the past, because of lax lending standards during the pre-COVID lending boom. | As Joe Rennison noted in the Financial Times, “The average recovery rate for the holders of bonds and loans was 45 cents on the dollar, rating agency Moody’s found, down from 59 cents in the 2008-09 financial crisis and below the historical average of more than 50 cents.” The plunge in recovery percentage worsened further down the capital structure. “the company-wide averages downplayed the severity of the situation for specific types of debt. Subordinated bondholders, which sit just one level above equity investors in terms of seniority in bankruptcy, received an average of just one cent for every dollar. This was a drop from 29 cents on the dollar from the financial crisis, and down from 23 cents during the dotcom bust.” |
| A new analysis from the Wharton School of the University of Pennsylvania (“COVID-19 School Closures: Long-run Macroeconomic Effects”) finds that the potential negative macroeconomic impact of a permanent reduction in labor productivity due to extended school closures (and switch to less effective remote teaching) during COVID has likely been underestimated. Unfortunately, too many school districts do not appear to be approaching the recovery of student learning losses with any sense of urgency. This has increased skepticism among education analysts that this will ever happen. These findings align with a previous analysis, “The Economic Impact of Learning Losses”, by Hanushek and Woessmann for the OECD. | “Overall, we project that the productivity losses current K-12 students experience as a result of school closures lead to a 3.6 percent decrease in GDP and a 3.5 percent decrease in hourly wages by 2050 relative to the counterfactual where there had been no disruption to learning. “Government tax revenues decline and, consequently, government debt cumulates more quickly. Higher debt along with less total savings by individuals with lower incomes leads to a lower real capital stock, lowering wages and GDP further. By 2050, the nation’s capital stock will be 4.1 percent lower and government debt will be 5.2 percent higher. “Note that current primary schoolers will be aged 34 to 40 in 2050, so the drop in their productivity will continue to affect the economy for many years afterwards.” |
| In the United States, President Biden’s fiscal stimulus proposals have run into political opposition in the US Senate from the Republican Party, due to that body’s arcane (and arguably unconstitutional) “filibuster” rule, the impact of which is to effectively require 60 votes for most pieces of legislation. | Some of the opposition is due to concerns that the amount of proposed amount of stimulus is excessive, and could lead to a sustained increase in inflation. Other opposition seems more rooted in pure political obstructionism, whose goal is a weak economy going into the 2022 congressional elections, which in turn could produce Republican majorities in the House and Senate. The net results of continuing delay will likely be an increase in uncertainty that damps down the growth in consumption and investment spending, and thus economic growth. |
| “Human Capitalists”, by Eisfeldt et al | SURPRISE “The widespread and growing use of equity-based compensation has transformed high-skilled labor from a pure labor input to a class of "human capitalists." We show that high-skilled labor earns substantial income in the form of equity claims to firms' future dividends and capital gains. “Equity-based compensation has dramatically increased since the 1980s, representing forty percent of total compensation to high-skilled labor in recent years. Ignoring equity income causes incorrect measurement of the returns to high-skilled labor… “In our sample, including equity-based compensation in high-skilled labor income reduces the total decline in labor's wage-only income share relative to total value added since the 1980s by over 30%. The inclusion of equity-based compensation also eliminates the majority of the decline in the high-skilled labor share.” |
| | |
| | |
| | |
| | |
| | |
| | |
| | |
| | |
| | |
| | |
| | |
| | |
| | |
| New National Security Information: Indicators and Surprises | Why Is This Information Valuable? |
| Belarus forced an airliner transiting its airspace to land in Minsk in order to arrest a Belarusian citizen who was a passenger onboard. The citizen was Roman Protasevich, a prominent Belarusian journalist, who had chronicled the repression and corruption of Belarusian president Alexander Lukashenko’s regime. | SURPRISE This is an important change that will almost certainly significantly increase uncertainty about the stability of the current global order. For example, consider China, whose national security laws are very broadly defined, and which has extradition treaties with 59 other countries. Should China want to arrest a passenger (of whatever nationality) on a plane transiting the airspace of one of those countries, could it not ask that the plane be forced down to enable their arrest (and later extradition)? The key point is that the impact and precedent of Belarus’s actions potentially go far beyond the risk to passengers on planes transiting Russian or Chinese airspace. What remains to be seen is whether other nations can impose sufficiently painful penalties on Belarus and Lukashenko that in the future other nations will hesitate to take such actions. More broadly, an article in Foreign Affairs by Nate Schenkkan noted that, “Lukashenko’s methods were novel; state-sponsored hijackings are rare. But Pratasevich’s arrest represents just the most recent example of a trend toward transnational repression, as authoritarian regimes increasingly seek to apply the brutal tactics they use at home to exiles and members of diasporas elsewhere in the world” (“The Authoritarian Assault on Exiles”). In another column on the incident, AEI’s Hal Brands asks, “Why do unaccountable rulers go to such lengths to grab a few annoying individuals, even when doing so puts their relations with democratic countries at risk? The brazenness of the strategy is, in fact, the point. Extraterritorial repression shows dissidents that they will never be safe, even in exile. It threatens the foreign support networks on which those challenging dictatorships often rely… Lukashenko’s actions also “raise troubling omens for the future: Who says that authoritarian regimes will be content cracking down on dissent by their own citizens abroad? They won’t… The detention of Pratasevich is a small thing that highlights much bigger global changes” (“Belarus Hijacking Showed The Fraying Of America’s World”). |
| For a long time, the theory that the emergence of SARS-CoV-2 was the result of a leak from a lab doing “gain of function” studies on coronaviruses was dismissed many quarters because some of its strongest advocates were members of the Trump administration. (e.g., see “The Groupthink That Produced the Lab Leak Failure Should Scare Liberals”, by Jonathan Chait and “The Lab-Leak Theory: Inside the Fight to Uncover COVID-19’s Origins”, by Katherine Eban). Following the Biden administration ordering the US intelligence community to prepare a new analysis of it, and publication of analyses by respected science journalists that gave it more credence (e.g., “Origin of Covid – Follow the Clues’ by Nicholas Wade, which was covered in our May issue), the lab leak theory came roaring back to life in May. | SURPRISE The initial reaction from Chinese journalists and “wolf warrior” diplomats was predictable, as they aggressively attacked the revived claims. But then things got more interesting. The BBC reported that in a speech to senior Communist Party officials, Xi Jinping said it was now “important to present an image of a "credible, loveable and respectable China”… "It is necessary to make friends, unite and win over the majority, and constantly expand the circle of friends [when it comes to] international public opinion," he was quoted as saying” (“Xi Jinping Calls for More Loveable Image for China in Bid to Make Friends”). Why such a dramatic change? And why now? Here are three hypotheses: (1) China’s slow release of information about the seriousness of COVID-19 in the early months of 2020, and its later blocking of the WHO’s attempts to investigate the source of the virus has led to a strengthening of the de facto global alliance against the further expansion of China’s economic, military, and diplomatic power. China’s attempt to intimidate other nations through Wolf Warrior diplomacy has only made things worse. (2) The external consequences of a conclusive finding that the virus escaped from a lab would likely be devastating, including demands for compensation and the filing of endless lawsuits seeking to attach overseas Chinese assets to obtain it (note that this has successfully been done in the case of some sovereign debt workouts). (3) Most devastating of all would be the threat to Xi Jinping’s continued rule, and perhaps to the Chinese Communist Party itself. All of these hypotheses must also be seen in the context of Xi’s calculations with respect to a possible Chinese attempt to forcibly take back Taiwan, for example through a prolonged blockade or sudden invasion. The global resurgence of the lab leak hypothesis has very substantially raised the stakes for Xi Jinping should he attempt a move against Taiwan. Xi must also wonder what secret intelligence the US and other allied nations have about the lab leak hypothesis that they have not – yet – released. The critical uncertainty is whether these concerns will make Xi more or less cautious in the months ahead. |
| A number of other new analyses highlight why the global resurgence of the lab leak hypothesis is potentially so important given the increasingly close relationship between China and Russia and rising tensions over Taiwan. | SURPRISE In “China and Russia’s Dangerous Convergence”, Andrea Kendall-Taylor and David Shullman observe that “On March 23, Chinese Foreign Minister Wang Yi and his Russian counterpart, Sergey Lavrov, sat down for an auspiciously timed meeting. The high-level talks came just a day after an unusually heated public exchange between senior U.S. and Chinese officials in Anchorage, Alaska, and in sharp contrast, the Chinese and Russian foreign ministers struck an amicable tone. Together, they rejected Western criticism of their human rights records and issued a joint statement offering an alternative vision for global governance. “The meeting was noteworthy for more than its rhetoric, however. “Within days of it, Russia began amassing troops along Ukraine’s border—the largest number since Moscow’s annexation of Crimea in 2014. Simultaneously, China began conducting highly publicized amphibious assault exercises and air incursions into Taiwan’s so-called air defense identification zone at the highest frequency in nearly 25 years. “Chinese military moves have reignited concerns in Washington about the potential depth of Chinese- Russian coordination. “For the United States, confronting these decidedly different adversaries will be a tall order, and the two countries will inevitably divide Washington’s attention, capabilities, and resources. The events of the last several weeks make clear that the administration of President Joe Biden will have difficulty managing Chinese behavior without addressing Moscow’s support for Beijing and that Washington must now calculate how its response to one adversary will shape the calculus of the other. “The problems the two countries pose to Washington are distinct, but the convergence of their interests and the complementarity of their capabilities—military and otherwise—make their combined challenge to U.S. power greater than the sum of its parts.” Writing in Foreign Affairs, Tufts Professor Michael Beckley lays out the case for why “America Is Not Ready for a War With China”. In the same publication, Hoover and AEI scholar Oriana Skylar Mastro describes, “why Beijing might resort to force” to retake Taiwan. She notes that while, “U.S. policymakers may hope that Beijing will balk at the potential costs of such aggression, there are many reasons to think it might not. Support for armed unification among the Chinese public and the military establishment is growing. Concern for international norms is subsiding. Many in Beijing also doubt that the United States has the military power to stop China from taking Taiwan—or their international clout to rally an effective coalition against China in the wake of Donald Trump’s presidency. Although a Chinese invasion of Taiwan may not be imminent, for the first time in three decades, it is time to take seriously the possibility that China could soon use force to end its almost century-long civil war.” Back in the 1970s, I took a course taught by Henry Kissinger, shortly after he left government service. I’ve never forgotten his very pragmatic conception of what it takes for a nation to deter action by a potential adversary. It basically comes down to the state of the nation’s power (military, diplomatic, economic, cultural), its political will to use it, and an adversary’s perception of those two factors. Both China and the US are making those calculations today. |
| Two other new papers highlighted a critical point. As Elizabeth Economy notes, “Xi Jinping is in a race against time”, as “China’s society is fracturing in complex and challenging ways” (“China’s Inconvenient Truth”). In “China: Rise or Demise?”, John Mueller writes that, “Rather than rising to anything that could be conceived to be “dominance,” China could decline into substantial economic stagnation. “It faces many problems, including endemic (and perhaps intractable) corruption, environmental devastation, slowing growth, a rapidly aging population, enormous overproduction, increasing debt, and restive minorities in its west and in Hong Kong. “At a time when it should be liberalizing its economy, Xi Jinping’s China increasingly restricts speech and privileges control by the antiquated and kleptocratic Communist Party over economic growth. And entrenched elites are well placed to block reform.” See also, “China’s Potemkin Nation” by Milton Ezrati. | If Economy and Mueller are right in their prediction that, absent changes that currently seem impossible, China is headed for a substantial increase in domestic challenges, will this deter Xi from using military force in an attempt to take Taiwan, or provide an impetus to take such a risk sooner rather than later? In terms of reference case/base rate data, history has many examples of leaders who used external aggression to deflect public attention from deteriorating domestic conditions. That said, we have no way of knowing how many leaders were deterred from external aggression because of deteriorating domestic condition, as it is impossible to measure something that didn’t happen. |
| New research from Pew highlighted partisan differences over the question of whether “Limiting the Power and Influence of China” should be a top US Foreign Policy Priority. 79% of Republicans and Independents who Lean Republican who get most of their information from conservative news outlets agreed. So did 55% of Republicans and Leaners who use a broader range of news outlets. Only 33% of Democrats and Leaners who get their news from liberal news outlets agreed with the statement, as did 42% those who use a broader range of news sources. | This poll raises a disturbing question as to whether Xi Jinping and the CCP might interpret its results as an indicator of a lack of US resolve should China attack Taiwan. |
| Coming close on the heals of the cyberattack on the Colonial Pipeline, a similar ransomware attack temporarily shut down operations of JBS, the world’s biggest meat processor, and in so doing threatened meat supplies in multiple countries. The White House claimed that, as in the case of the Colonial Pipeline, the attack on JBS originated in Russia. | SURPRISE In response, the US Department of Justice announced it would begin treating ransomware attacks as a form of terrorism, in line with growing demands from various analysts to take this step (e.g., see “Cyber Security as Counter-Terrorism: Seeking a Better Debate” by Handler et al, and “Deterring Attacks Against the Power Grid” by Narayanan et al from RAND). The underlying logic is that ramsomware is a form of “cyber-coercion” that, as the Colonial and JBS attacks showed, can do significant damage to a nation state (e.g., see, “The Political Economy of Ransomware” by Jenny Jun). In so far as treating ransomware as terrorism implies increased counterterror activities that go beyond the realm of law enforcement, this will likely lead to increased conflict between the US and Russia. |
| | |
| | |
| | |
| | |
| | |
| | |
| | |
| | |
| New Health and Disease Information: Indicators and Surprises | Why Is This Information Valuable? |
| With Trump no longer in the White House, stories examining the hypothesis that SARS-CoV-2 originated in the Wuhan Virology lab exploded in May. | See the National Security Evidence File for our take on the most important consequences of this new development. |
| The race between the spread of B.1.617.2 (the Indian or Delta variance) and vaccination rates and efficacy accelerated in May. | With cases of the B.1.617.2 variant rapidly displacing B.117 in the UK, it is clear that the latter’s estimated 50% transmissibility advantage over the former means that it is on course to become the world’s dominant strain of SARS-CoV-2, at least until an even more transmissible mutation or recombination appears. As we have written before, there are two pieces of good news: Vaccine efficacy against the new variant appears to be quite strong, and thus far relatively limited evidence suggests that it is unlikely to make people sicker than previous variants. It thus appears that the speed of vaccination and percent of the population that is fully vaccinated are the keys to avoiding stress on national medical systems and thus the need for further lockdowns and other behavioral interventions with all the mental health, student learning losses and other social, economic, and political costs they bring with them. Unfortunately these still vary widely around the world, leading to the conclusion that SARS-CoV-2 still has the potential to cause substantial further damage to at least some parts of the global political economy. As Brilliant and his co-authors note in “The Forever Virus”, “It is time to say it out loud: the virus behind the COVID-19 pandemic is not going away. SARS-CoV-2 cannot be eradicated, since it is already growing in more than a dozen different animal species. “Among humans, global herd immunity, once promoted as a singular solution, is unreachable. Most countries simply don’t have enough vaccines to go around, and even in the lucky few with an ample supply, too many people are refusing to get the shot. As a result, the world will not reach the point where enough people are immune to stop the virus’s spread before the emergence of dangerous variants—ones that are more transmissible, vaccine resistant, and even able to evade current diagnostic tests. Such supervariants could bring the world back to square one. It might be 2020 all over again. “Rather than die out, the virus will likely ping-pong back and forth across the globe for years to come.” |
| | |
| | |
| | |
| | |
| | |
| | |
| | |
| | |
| | |
| New Social Information: Indicators and Surprises | Why Is This Information Valuable? |
| As the debate over teaching of “Critical Race Theory” heats up in the US, there were interesting findings from a new poll from Parents Defending Education (defenginged.org) (N=800). “25% said it was somewhat or very important for schools to “teach students that their race is the most important thing about them” compared to 70% who said this is not important or not at all important.” “When asked whether their local K-12 school has increased or decreased its emphasis on issues of race, gender, and activism in the last two years, 52% said it had increased a lot or a little. Only 2% said it had decreased. Similarly, 57% said their local schools had become more political, with only 4% saying less political. “74% said they were somewhat or strongly opposed to teaching students that white people are inherently privileged and black and other people of color are inherently oppressed. Similarly, only 6% of respondents favored schools assigning white students the status of “privileged” and nonwhite students the status of “oppressed” – versus 88% opposed, including 78% strongly opposed. “69% opposed schools teaching that America was founded on racism and is structurally racist." "75% oppose teaching there is no such thing as biological sex, and that people should choose whatever gender they prefer for themselves. Only 18% supported teaching such concepts.” | If this (albeit relatively small) poll is even a roughly accurate summary of beliefs in America today about the cultural agenda of the “woke” left, Republicans have a powerful set of wedge issues to use against the Democratic Party in the 2022 Congressional elections. And Joe Biden may face a growing challenge in trying to persuade the Congress to enact his fiscal stimulus agenda. |
| On the other hand, a blog post by Webber and Samaras from RAND highlights another US fault line with a high degree of tension on it. “For COVID-19, we ask schoolchildren to wear masks all day in socially-distant classrooms or endure endless hours of staring at screens on computers, phones, or tablets for virtual classes without social stimulation with their friends... The risk of death or hospitalization for children is relatively lower, so ultimately their sacrifice is to protect older generations including their teachers, parents, and grandparents…The burden from COVID-19 on younger generations has been heavy… “For climate change, society is asking older generations—today's decision makers—to build better infrastructure for tomorrow and to change our energy and land use patterns today tor educe and reverse emissions on behalf of schoolchildren and future generations that haven't been born yet. But unlike the schoolchildren who are sacrificing to protect older generations, the older generations do not seem willing to reciprocate. Rather, today's leaders put up a fight and resist the necessary changes.” “COVID-19 and Climate Change Both Require One Generation to Sacrifice for Another” | Whether and how the conflict they highlight will spill over into the political arena remains to be seen. This is a politically tricky juxtaposition of two powerful issues. While the Biden Administration has laid out aggressive climate goals, the teachers unions, which fought hard to keep schools closed, are a major Democratic constituency. In contrast, while Republicans have fought hard to reopen schools, much of their voter and donor base is opposed to the Biden Administration’s aggressive approach to climate issues. |
| “How America Fractured Into Four Parts”, by George Packer in The Atlantic Packer has written a long and very thought provoking analysis of how four different narratives have emerged in recent years that disagree about the United States’ “purpose, values, history, and meaning”. Broadly, they are defined by a focus on either the individual or group, and by a Democratic or Republican orientation. Packer terms them “Free America” (I/R), “Smart America” (I/D), “Real America” (G/R), and “Just America”(G/D). Interestingly, previous writers have also found four narratives or cultural orientations. In his 1989 book Albion’s Seed, David Hackett Fischer focused on the impact of four waves of early emigration to the US from different parts of England (to which Russell Shorto added the impact of Dutch emigration to New York in his 2001 book, “The Island in the Center of the World”). In 2001, Walter Russell Mead’s book “Special Providence” found four durable traditions in American foreign policy, which he termed Hamiltonian, Wilsonian, Jeffersonian, and Jacksonian. | Fischer, Mead, and Shorto all describe how the traditions they identify have interacted over time, including their respective impacts on the Revolutionary and Civil Wars when differences between them became irreconcilable by peaceful means. Packer raises a similar question about today, when he asks whether reconciliation is possible between the narratives he identifies. He claims that, “all four of the narratives…emerged from America’s failure to sustain and enlarge the middle-class democracy of the post-war years” (I think Fischer, Mead, and Shorto might say there were also deeper historical forces at work). Packer also warns that, the four narratives, “are driven by a competition for status that generates fierce anger and resentment. They all anoint winners and losers.” Thus, the “tendency [of these four narratives] is to divide us, pitting tribe against tribe” and in so doing, “impoverish each narrative into a cramped and ever more extreme version of itself.” As Packer says, “I don’t much want to live in the republic of any of them.” He concludes that the way forward is “a road that tries to make us Equal Americans, all with the same rights and opportunities—the only basis for shared citizenship and self-government.” |
| | |
| | |
| | |
| | |
| | |
| | |
| | |
| | |
| | |
| | |
| New Political Information: Indicators and Surprises | Why Is This Information Valuable? |
| “Europe’s Phantom Political Centre Risks Fueling Populism”. Writing in the Financial Times, Catherine Fieschi notes that, “In Europe, the idea of the political centre has never been so fashionable. Centrism seems to be the balm of choice to soothe the populist wounds of European democracies.” However, she sees this as “expedient, rather than ideologically meaningful… “In part, it is the result of the much-peddled story of the demise of the left-right divide. But mostly, it is the result of political opportunism: a convenient way for parties to tread water as electorates are transformed under the weight of tectonic shifts, be they digital, environmental or geopolitical. As voters adapt, float and flit and as values shift (or not), parties hunker down and wait. What better place to do so than in the non-committal centre?” Fieschi concludes with a warning: “The paradox is that, in its meaninglessness, this phantom centre may fuel precisely the kind of ersatz consensus that triggered the great populist backlash to begin with.” | In democracies, stable parties of the center left and center right play a critical role, with the former promoting changes to address emerging issues, and the latter ensuring that this change does not happen too quickly, or without due consideration of its potential costs as well benefits. When they fail to effectively address worsening problems, they open the door to populist radical and reactionary parties of the left and right. That usually doesn’t end well for the country in question, and sometimes the world. In that sense, today’s apparent dominance of uninspiring centrist parties in Europe has an air of the “phony war” about it |
| Fieschi’s general point about the dangers faced by centrist parties is born out by the struggles of the Labor Party in the UK and the Republican Party in the US. In the New Statesman, Tony Blair explain why “Without Total Change, Labour Will Die”, noting the twin threats posed by the radical cultural views of its left wing, and its lack of convincing economic policies in an age of unprecedented technological change and disruption. In the US, multiple writers have noted how the ouster of Liz Cheney from the House Republican Leadership and Senate Republicans blocking the establishment of an independent commission to investigate the January 6th attack on the US Capitol are painful indicators of a party still in thrall to Donald Trump, who is unwilling to let it move on without him. In the Financial Times, Martin Wolf claimed that as a result, “the Republicans are no longer a normal democratic party. They are increasingly an anti-democratic cult with a would-be despot as their leader” (“The Struggle For The Survival Of US Democracy”). In his weekly letter, Andrew Sullivan noted, that Trump’s “unappeasable vanity, the GOP is flubbing one of its biggest political opportunities in years: to craft redistributionist policies for the mass of working Americans, and to defend the legacy of the West, its values and traditions, against the most radical left assault since the late 1960s.” Moreover, the Republicans are in the process of potentially scoring an own-goal at the state level, where they are attempting to put in place radical changes to election laws that seem intended to disenfranchise likely Democratic voters. In their recent public “Statement of Concern”, a large number of prominent scholars of democracy warned that, “we have watched with deep concern as Republican-led state legislatures across the country have in recent months proposed or implemented what we consider radical changes to core electoral procedures in response to unproven and intentionally destructive allegations of a stolen election. “Collectively, these initiatives are transforming several states into political systems that no longer meet the minimum conditions for free and fair elections. Hence, our entire democracy is now at risk. “When democracy breaks down, it typically takes many years, often decades, to reverse the downward spiral. In the process, violence and corruption typically flourish, and talent and wealth flee to more stable countries, undermining national prosperity. It is not just our venerated institutions and norms that are at risk—it is our future national standing, strength, and ability to compete globally.” | Tony Blair’s analysis highlights that the struggles within center left and center right parties (or growing tensions on the fault lines within them) is broader than what is happening in the United States. Both Joe Biden’s fight to contain the progressive left and Republicans’ struggles to break free of Donald Trump highlight how this broader phenomenon is playing out politically in the United States (George Packer described the broader social context in which these conflicts are occurring). The Statement of Concern scholars of democracy is undoubtedly right about the long-term threat posed by Republican attempts to constrain voting rights (they don’t mention the opposite threat posed by Democratic attempts to expand them to much, e.g., through same day registration, lowered voting ages, and reduced voter identification requirements). However the more immediate threat is how the continued intensification of political polarization and partisan battles may affect decision making in Beijing with respect to risking a war with the United States over Taiwan. |
| | |
| | |
| | |
| | |
| | |
| | |
| | |
| | |
| | |
| | |
| | |
| New Financial Markets and Investor Behavior: Indicators and Surprises | Why Is This Information Valuable? |
| “Total Returns to Single Family Rentals”, by Demers and Eisfeldt | The market value of US Single Family Rental assets totals more than $2.3 trillion. We believe that we provide the first systematic analysis of total returns to Single Family Rentals over a long time period, in a broad and granular cross section. We find that total nominal returns are approximately equalized across US cities, at about 8.5%, the same order of magnitude as equity returns.” Note, however, that both stock and rental housing returns are both likely to be affected in the same direction by macroeconomic factors like GDP growth and interest rates. “On average, net rental yields and house price appreciation have each contributed around half of the 8.5% total return. However, these two components are negatively correlated in the cross section. High price tier cities accrued more capital gains, while low price tier cities had higher net rental yields. Within cities, we show that lower-price-tier zip codes have higher total returns as a result of both higher yields and higher house price appreciation.” |
| “Why and How Systematic Strategies Decay”, by Falck et al | This paper investigates the determinants of the performance decay of known investment strategies after their publication. The authors examine two non-exclusive possibilities: arbitrage (more money flowing into strategies and factors that have delivered high returns in the past after they become public knowledge) and overfitting (the risk that superior backtested performance resulted from chance, not a true signal, due to multiple strategies having been tested to find one that worked – at least in the past). The authors find that “the year of publication [which captures both effects] alone explains 30% of the variance of Sharpe decay across factors…Proxies for overfitting add another 15% of explanatory power. Arbitrage-related variables only marginally contribute to return decay.” A third hypothesis, which the authors don’t test, is that the continuing evolution of the complex adaptive system that generates financial market returns gradually invalidates the relationships on which backtested results were based, even if they weren’t overfitted. |
| With many commentators claiming that many asset classes are overvalued to a degree not seen since 2000 (e.g., see Robert Armstrong’s “Unhedged: Talking Bubbles with Jeremy Grantham” and John Hussman’s “The Myths Behind the Current Stock Market Bubble”, both in the Financial Times) two new research papers shed new light on how such bubbles arise. In “When Do Social Learners Affect Collective Performance Negatively? The Predictions of a Dynamical-System Model”, Yang et al ask “whether a collective decision-making system can settle on the best available option when some members learn socially instead of evaluating the options on their own.” They note that “This question is challenging to study, and previous research has reached mixed conclusions, because collective decision outcomes depend on the insufficiently understood complex system of cognitive strategies, task properties, and social influence processes.” They “investigate how the interplay of the proportion of social learners, the relative merit of options, and the type of conformity response affect collective decision outcomes in a binary choice.” Their model “predicts that when the proportion of social learners exceeds a critical threshold, a unstable state appears in which the majority can end up favoring either the higher- or lower-merit option, depending on fluctuations and initial conditions. Below this threshold, the high-merit option is chosen by the majority. “The critical threshold is determined by the conformity response function and the relative merits of the two options…The more agents are motivated by “fitting in” rather than using social information to them determine the “right answer”, and the narrower the difference between the two options, the more likely the unstable state.” In “Phase Transition And Cascading Collapse In Binary Decision-Making Dynamics”, Chen et al propose “an agent-based model to study the collective behaviors of individual binary decision-making process through competitive opinion dynamics on social networks. “Three key factors are considered: bounded confidence that describes the cognitive scope of the population, stubbornness level that characterizes the opinion updating speed, and the opinion strength that represents the asymmetry power or attractiveness of the two choices.” They find “that bounded confidence plays an important role in determining competing evolution results. As bounded confidence grows, population opinions experience a phase transition from co-existence” [of multiple views to a dominant view/decision]. “Of particular interest, we show how the combined effects of bounded confidence and asymmetry of opinion strength may reverse the initial supportive advantage in competitive dynamics” [i.e., as uncertainty increases, the more strongly held opinion can become more dominant]. “Notably, our model qualitatively reproduces the important dynamical pattern during a brutal competition, namely, cascading collapse, as observed by real data… “Intriguingly, we find that an increase agents’ cognitive heterogeneity can bring about randomness and unpredictability in the binary decision-making process, leading to the emergence of indeterministic oscillations.” | Our long-held, research-based view is that evolution has primed human beings’ survival instincts to increase their reliance on social learning and conformity to others’ behavior as uncertainty increases. Our current age of hyperconnectivity has supercharged this process. As a result, in multiple domains we observe narratives becoming more dominant, even as their underlying justifications become more fragile, setting the stage for violent, non-linear changes. Both of these papers reinforce our view that a combination of increasing system complexity and hyperconnectivity, have led to a substantial increase not only in irreducible uncertainty, but also in the potential for rapid non-linear changes in many complex adaptive systems, including asset class valuations. This is a new source of systematic risk, and we believe that it is still either unrecognized or underestimated by many. |
| | |
| | |
| | |
| | |
| | |
System Tipping Points/Critical Threshold Analysis
Like Professors Andrew Lo, Doyne Farmer and others, we regard financial markets as a complex adaptive system (CAS), that exist as part of a larger macro system comprised of other CAS between which there are multiple feedback loops. These other systems include those that produce technology innovations, and economic, environmental, national security (including cyber), social, demographic, and political outcomes.
We also find that these systems tend to operate and generate effects in a rough chronological sequence, albeit with many feedback loops between them. The following chart highlights that the changes we observe in different areas at any point in time are actually part of a much more complex evolutionary process.
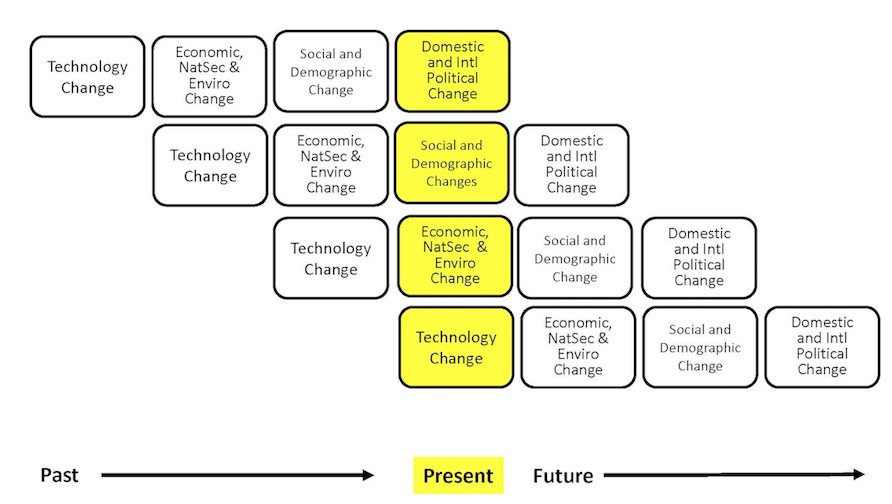
While most media coverage of these systems focused on flows (e.g., the size of the government deficit), rapid non-linear change in complex adaptive systems is often caused by a key stock (e.g., the amount of outstanding government debt) exceeding a critical threshold.
The next table highlights the key macro system stocks that we monitor.
In the next section, we will discuss information received over the past month that is related to these stocks, and which we believe is significant to our assessment of the probabilities that a critical threshold will be reached and a regime change will occur. We will conclude with our estimate, at the end of this month, of how close the macro system is to these critical thresholds, and the implications for financial market regime change probabilities.
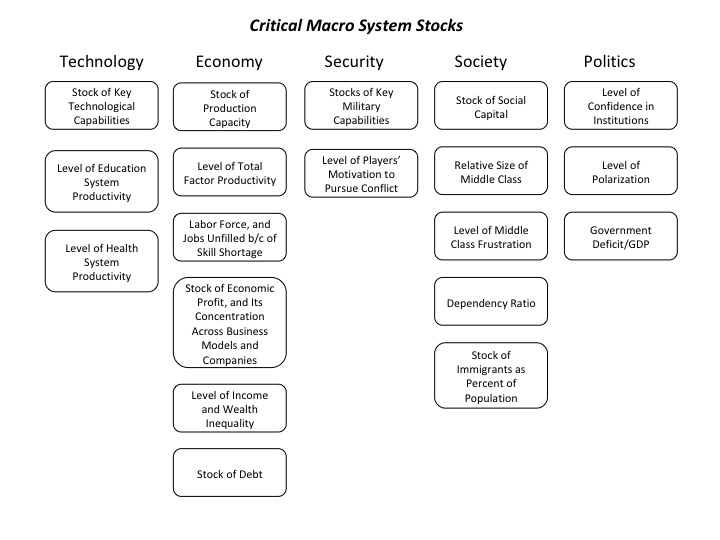
How Close is the Macro System to One or More Critical Thresholds?
As we have noted, the macro drivers of financial market regime changes typically follow a rough chronological sequence, from technology to economic, security, social, and political causes and effects. Yet there are many feedbacks loops between them, creating complex root causes for many of the critical thresholds we have identified.
Understanding the time dynamics in this complex system is critical to avoiding substantial downside investment risk.
We use the UK Met Office Warning Model to communicate our assessment of these time dynamics. We estimate the time remaining before a critical macro system threshold is reached that could trigger a regime change, which is usually accompanied by substantial changes in asset class valuations.
The model uses three increasingly serious levels of warning, from “Be Aware” (condition yellow), to “Be Prepared” (condition orange), to “Take Action” (condition red).
For our purposes, we denote as “Be Aware” (yellow) critical thresholds that we assess to be three or more years away. We estimate that “Be Prepared” (orange) thresholds could be reached within 1 to 3 years. “Take Action” thresholds are very likely to be reached within one year.
Given their nature, we also note that in our three “wildcard” areas (Environment and Energy related; Disease and Human Caused Bioevents; and Cyber and Electromagnetic Events), our forecasts have higher levels of uncertainty.
The following charts summarize our current estimate of the time remaining before different critical thresholds will be reached.
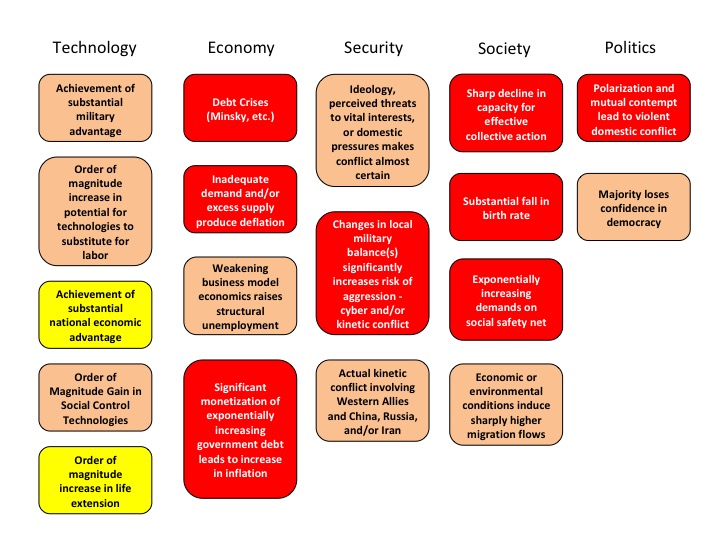
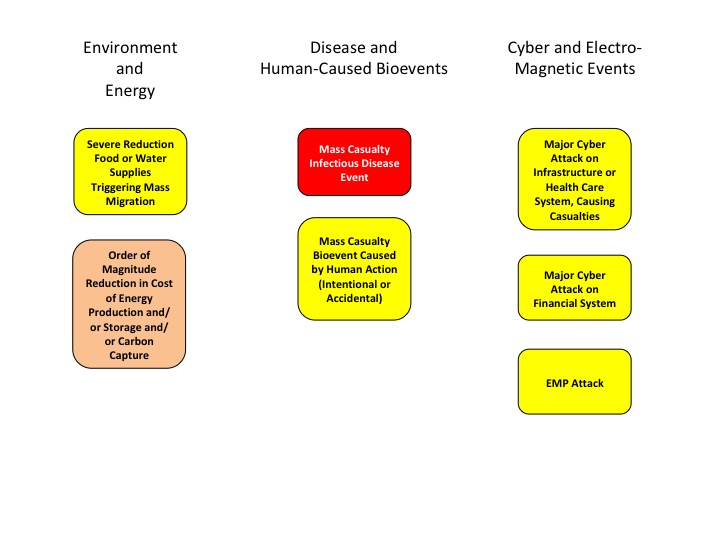
At the highest level, we believe the complex adaptive global macro system can be in one of four states, based on its degree of order versus disorder, and degree of social cooperation versus conflict. A very coarse-grained reading of history suggests that these states evolve in a predictable cycle, from ordered/cooperative, to disordered/cooperative, to disordered/conflicted, to ordered/conflicted.
We believe that the system is currently in its most uncertain state, characterized by high degrees of underlying disorder and social conflict, both domestically and internationally. Beyond some point, intensifying conflict eventually increases the degree of order in the system. That appears to be happening now, via the increasing conflict between China, Russia, and Iran and the United States and other Western nations.
If you have any questions about anything we have written in this issue, please don’t hesitate to get in touch, at contact@indexinvestor.com
Appendix: Anticipatory Thinking and Forecasting Methodologies
Our process is based on methods and tools developed over the past seven years at our affiliate, Britten Coyne Partners, which provides consulting services and education courses to executive teams and boards on strategic risk governance and management.
At The Index Investor, we engage in both anticipatory thinking to identify what could happen (e.g., different macro regimes and related events), and forecasting, to estimate the probability that events and regimes will happen, and the impact they will have if they do (e.g., on macro variables and broad asset class returns).
With respect to what could happen, we are acutely conscious of the conclusion reached by a 1983 CIA study of failed forecasts: "each involved historical discontinuity, and, in the early stages…unlikely outcomes. The basic problem was…situations in which trend continuity and precedent were of marginal, if not counterproductive value."
When it comes to forecasting, we know that in complex socio-technical systems that are constantly evolving, the accuracy of statistical or machine learning based forecasting methods declines exponentially as the time horizon lengthens, since the historical data set on which they were trained will (depending on the speed and effectiveness of any retraining cycle) bear less and less resemblance to the distribution of outcomes the system is likely to produce in the future.
Under these circumstances, forecast accuracy over longer time horizons depends on causal and counterfactual reasoning about the possible future effects of multiple interacting trends and uncertainties that are hard to quantify.
And we are acutely aware of the economist Rudi Dornbusch's famous warning: "Crises take a much longer time coming than you think, then happen much faster than you would have thought."
Our forecasting process also draws on lessons Tom Coyne learned from spending four years as a member of the Good Judgment Project team, which won the Intelligence Advanced Research Projects Activity’s forecasting tournament with forecast accuracy that was more than 50% better than the tournament's control groups (the team's experience is described in Professor Philip Tetlock's book, “Superforecasting").
Our analysis focuses on the probability of the global macro system being in four possible macro regimes 12 and 36 months from the date of our forecast: (1) Normal Times, where equity asset classes perform well; (2) a High Uncertainty regime that is usually short and transitory, where asset classes like short-term government bonds perform best and equities suffer significant declines; (3) High Inflation (which we deem 5% or more, year-on-year), where commercial property, real return bonds and other traditional hedges are favored; and (4) Persistent Deflation (a year-on-year decline in the US CPI), which up to now has only been seen in Japan, and in which the relative performance of different asset classes remains uncertain, but will likely favor high quality bonds and the consumer staples equity sector.
In response to subscriber requests, we have added a 36-month regime forecast to our existing 12 month forecast. The logic is that, in a complex evolving system like global macro, a longer forecast horizon gets beyond the “detection range” of algorithmic forecasting approaches, and therefore raises probability that a manager/investor can gain an edge in identifying emerging threats and opportunities.
That said, because evolving (i.e., “non-stationary”) complex systems populated by highly connected human agents are also capable of sudden non-linear changes (with which are hard for algorithmic approaches to predict), we are also keeping our 12 month forecast.
Our forecasting methodology starts with base rate/reference case data about the historical probability of large changes in equity and bond valuations. We then analyze the current situation from both a quantitative and qualitative perspective. In the latter, we focus on the key endogenous drivers of macro regime change, including technological, economic, national security, social, and political trends and uncertainties. We also focus on three potential sources of exogenous shocks that could also produce a macro regime change, caused by environmental, disease, and cyber related events.
While most of our attention typically focuses on various flows (e.g., economic growth, change in the price level, sales, earnings, job creation, etc.), endogenously caused regime changes result when those flows push key stocks beyond a critical threshold or tipping point, often setting off non-linear reactions across multiple areas. As noted by Hyman Minsky and others, a classic example is the steady accumulation of outstanding debt until it reaches the point where it can no longer be serviced and triggers a crisis.
Base Rate Data
Since the end of World War Two, there have been fifteen months where a downturn in the US equity market began that eventually reduced asset class value by 20% of more. That is a hazard rate of about 1.75% per month. Put differently, in any given month there is a 98.25% probability that a 20%+ downturn won’t occur, or, in a given year, an 81% probability.
However, as the time without a 20%+ downturn extends, the compound probability that one will not occur shrinks. At the end of August 2018, it is more than nine years since the last equity market decline of 20% or more. The probability of that happening is only 15%.
To estimate the base rate for a 20% fall in bond prices (which historically has been caused by a sharp increase in inflation, as we saw in the late 1970s and early 1980s), we analyzed monthly historical AAA bond yields since 1919. For consistency, we used them to calculate the price of a ten-year zero coupon bond. We then calculated the probability of a price decline of 20% or more over three different holding periods: 12, 18, and 24 months. In any month, the annualized probability of a decline of 20% or more over the subsequent 12 months is 12%; over 18 months, 20%, and over 24 months, 25%.
Market Stress Indicators Methodology
We view financial markets as a complex adaptive system. The size of changes generated by such a system follows a power law rather than a normal (Gaussian) distribution. The critical point is that large changes are much more common in complex adaptive systems than most people’s intuition leads them to believe.
While predicting the behavior of complex adaptive systems remains far more art than a science, various researchers have found that large changes in such systems are often preceded by subtle warning signs, as stress accumulates within them. While this research is not definitive, we believe that five warning signs are worth monitoring as potential indicators of growing stress within financial markets that could suddenly give rise to large changes in asset class valuations.
Our first indicator is the month-to-month autocorrelation of broad asset class returns (i.e., the relationship of this month’s returns to last month’s). A system under increasing stress loses resiliency, causing it to take longer to recover from perturbations; hence, autocorrelation increases as it approaches a critical transition (see, “Early Warning Signals for Critical Transitions” by Scheffer, et al).
The second market stress indicator we monitor is the Economic Policy Uncertainty Index published by the Federal Reserve Bank of St. Louis (via its FRED economic database), which is based on research by Baker, Bloom, and Davis (see their paper, “Measuring Economic Policy Uncertainty”). The index is based on automated text analysis of leading newspapers and magazine publications, to identify the frequency with which words and phrases are used that indicate uncertainty.
In humans’ evolutionary past, when uncertainty increased the probability of survival was enhanced by staying close to a group. All of us still have that instinct. Research has found that as uncertainty increases, we have an unconscious bias towards higher conformity of our own views with those of a larger group (i.e., reduction in cognitive diversity). Behaviorally, heightened uncertainty induces more “social copying” of others, likely due to both conformity bias and the rational belief that others may be acting on the basis of superior information. This increase in conformity and copying makes a social system more ordered as uncertainty increases, and also reduces its responsiveness to perturbations (i.e., increases autocorrelation) because of delays in the social copying process.
The key point is that increasing uncertainty induces more, not less order in social systems, and in so doing primes them for sudden non-linear change.
Our third market stress indicator is the spread between the yield on AAA rated bonds and the 10-year US Treasury. This is a proxy for the level of investor concern about financial system funding liquidity.
Our fourth market stress indicator is the yield spread between speculative BB rated bonds and the ten-year US Treasury. Throughout history, excessive credit growth has been a root cause of many financial crises. An indicator of such growth is falling credit spreads, particularly in the case of riskier borrowers. In contrast, rising BB spreads indicate growing investor concern about the consequences of such growth, and the financial distress lower rated companies could experience in an economic downturn.
Our fifth market stress indicator is what we term the “political risk premium” that is implicit in the price of gold. Our starting point for estimating this premium is the three different roles that gold plays. First, gold is a store of value in a world of fiat currencies. When the rate of money supply growth exceeds the growth of nominal GDP, gold’s price should increase to maintain its purchasing power. Between 2007 and 2017, the US money supply (M2) grew by about 86%, while nominal US GDP grew by 35%. The stock of gold grew by 18%, based on mine production over this period. We therefore infer that 33% of the increase in the price of gold represented the maximum potential gold price change that could be attributed to a desire to hedge inflation risk (86% less 35% less 18%).
Second, gold is a unit of account. We take this to mean that the annual change in GDP expressed in terms of physical gold (i.e., nominal GDP divided by the price of gold) should equal the change in real GDP calculated using the GDP price deflator to account for actual inflation over the period. A key challenge is the point at which to start this calculation.
We chose the price of gold in 1995/1996. In that period, the change in real global GDP measured using the IMF’s price deflator just about equaled the change in GDP measured in terms of physical gold. We interpret that coincidence as indicating that at that point in time, concerns about future inflation and political risk were minimal, and the change in the price of gold was mostly driven by its role as a unit of account. We calculated a subsequent series of gold prices that would produce the same change in “gold GDP” as the actual real GDP as calculated by the IMF. Between 2007 and 2017, “gold as a unit of account” warranted a 21% increase in its price.
Gold’s third role is as a hedge against inflation and what we term “political disaster” risk. We subtract the 21% estimated compensation for actual inflation from the 33% “gross” inflation risk hedge to derive an apparent 12% increase in the gold price that reflected the true risk premium to hedge against possible future inflation. However, between 2007 and 2017 the price of gold actually increased by 81%. This implies that 48% of this (81% less 21% less 12%) represented a premium for some other type of uncertainty at the end of 2017. The interesting question is the nature of the uncertainty for which gold is believed by some investors to be a superior hedge than traditional ports in a storm like short-term US government securities, or similar securities issued by other developed countries.
The logical inference is that the uncertainty in question must reflect a situation in which short term US Treasuries would be a less effective hedge than gold. This could be a world of widespread hyperinflation, capital controls, and/or radical changes in nations’ governments (of course, this would also imply a preference for investing in gold coins rather than bullion, as while the latter may be a store of value, it is far less convenient as a means of paying for transactions).
To put this in further perspective, this gold price “disaster risk” premium sharply increased from 2008 to 2012, then declined before sharply increasing again after 2016. Arguably, a significant part of the former increase reflects concerns about the potential inflationary consequences of dramatic quantitative easing by central banks. But this is not likely to be the case after 2016.