The Index Investor
June 2020
Tactical Asset Allocation Implications of Our Forecasts
Forecast Logic
Forecast Pre-Mortem Analysis
Combining and Extremizing Forecasts to Improve Predictive Accuracy
Feature Article: Making Good Decisions in Highly Uncertain Situations
High Value Information Observed Last Month
Critical System Thresholds/Tipping Points Analysis
Appendix: Anticipatory Thinking and Forecasting Methodologies
Current Macro Forecast
This month we have seen accumulating evidence that equity investors have substantially underestimated the underlying damage COVID19 has done to the demand side of the US economy (which will quickly become apparent if the US Congress fails to pass another stimulus bill to support middle and lower income households).
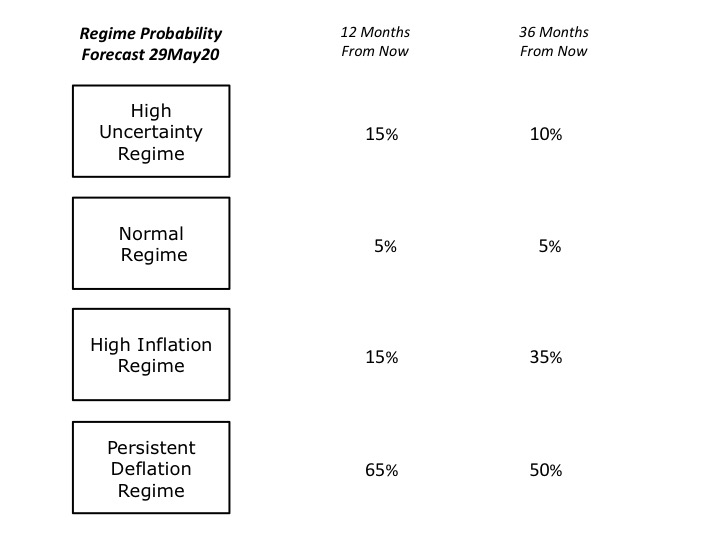
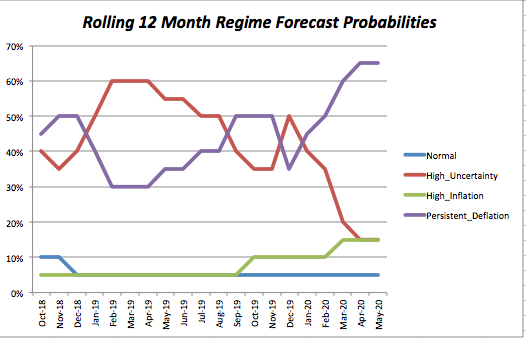
We have made no change to our 36-month regime forecasts. The probability the United States will be in the Persistent Deflation Regime remains 50%.
This forecast still rests on three assumptions. The first is that the increasing headwinds that were restraining aggregate demand growth before the devastating arrival of the COVID-19 pandemic will almost certainly worsen. These headwinds included population aging, weak productivity growth, declining labor share of GDP, high levels of both inequality and debt, and the growing threat of job displacement as increasingly capable automation and artificial intelligence technologies are deployed.
The second assumption is that COVID19’s unprecedented demand and supply shocks will worsen corporate and household debt servicing problems, and lead to rising defaults and liquidations that on balance will have a deflationary impact.
The third assumption is that the lagging recovery of demand, accelerating debt problems, continued increase in tensions with China, and increasing domestic tensions in the United States between now and the November election will keep uncertainty higher than most people currently expect, which will further depress aggregate demand relative to supply and cause price declines in many sectors.
Our 36-month forecast probability for being in the High Inflation Regime remains at 35%.
Whether the High Inflation Regime comes to pass will depend on the future evolution of, and interaction between, the demand and supply shocks, COVID19 had created. We know that the demand shock has been swift and severe, and has triggered falls in the US Consumer Price Index. A critical uncertainty is how long the demand shock will last.
In the absence of a vaccine, social distancing (and the possibility of second, third, and subsequent waves of seasonal coronavirus) will permanently depress demand in many service industries (and therefore reduce the stimulative impact of government deficits on consumer spending).
Increasing layoffs, high debt service burdens, and higher levels of precautionary savings in the face of continuing uncertainty will further depress domestic consumer spending, and thus private domestic investment spending as well.
However, the nature of the COVID19 shock to aggregate supply is also important; many past episodes of high inflation were caused by supply side shocks (e.g., oil supply cutbacks in 1973 and 1979). However, while we are seeing price rises on some food items where the supply chain has been disrupted, the overall CPI is still declining.
In the coming months, the combination of weak demand, high debt levels and a bankruptcy process that is much less favorable to small and medium sized businesses than to large ones will almost certainly lead to a supply reductions in other sectors (e.g., restaurants). Social distancing rules could have the same effect, even if a company stays in business. Think of a restaurant that can now seat only one third as many people as before, and must therefore triple its prices to stay in business (assuming that doesn’t destroy its demand).
COVID19’s disruption of global supply chains (reinforced by the intensifying cold war between China and the United States) will also almost certainly lead to reshoring of production, which could create new jobs and stimulate domestic demand. However, the impact of reshoring on supply side costs is uncertain; greater use of automation could result in lower supply costs at reshored facilities, while greater demand for labor with scarce skills could raise them.
Finally, we have to acknowledge two potential wildcards in this forecast. The first is a sharp increase in uncertainty related to the November elections in the United States (e.g., a Trump announcement that because of claimed interference he will not accept their result and leave office if he is defeated).
The second is the outbreak of open conflict between the China and the United States (e.g., a Chinese invasion of Taiwan or rapid escalation of a kinetic encounter in the South China Sea). The first might trigger an outflow from the US dollar, which would be inflationary if it was directed into another currency (e.g., the Euro or Yen), but less so if it primarily went into gold. The second would trigger a sharp increase in precautionary savings that would be deflationary (as well as increased demand for US Treasury securities and gold).
On balance, at this point it seems much more likely that the COVID19 shock’s net impact on demand and supply will lead to the Persistent Deflation rather than the High Inflation Regime.
Finally, at the 36 month time horizon, the forecast probabilities for the High Uncertainty (10%) and Normal Regimes (5%) also remain unchanged.
Portfolio Allocation Implications of Our Forecast
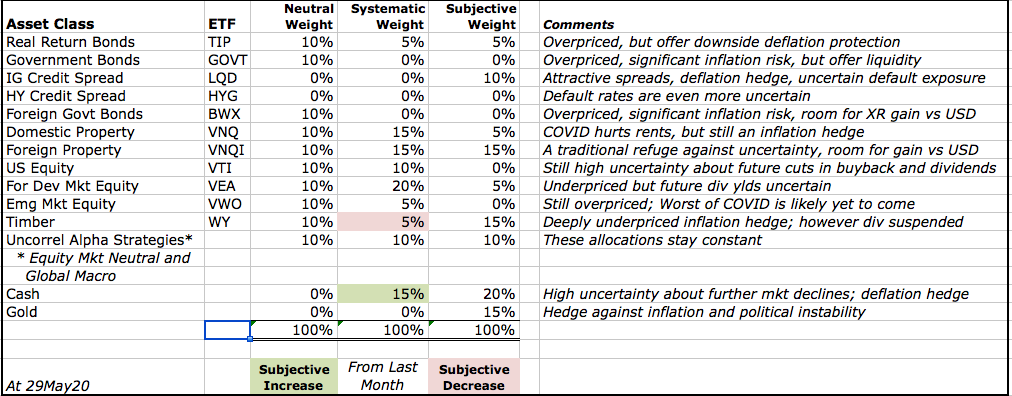
We take two approaches to deriving the tactical asset allocation implications from our analyses. The first takes a systematic approach, and is based on relative asset class valuations. Our starting point is our “neutral” model portfolio, which is equally weighted across nine broad asset classes, and also includes a 10% allocation to alpha strategies (equity market neutral and global macro) that are designed to have a low correlation to returns on broad asset classes. Based on asset class valuations, we systematically vary the asset class weights (but not the active strategy weight), increasing from 10% to 15% when an asset class is likely undervalued, and 15% when it is very likely undervalued. In the case of overvaluations, we go to 5% and then into cash, if there are no undervalued asset classes with room for an increase. In effect, this replicates the systematic rebalancing strategy we used for 15 years in our previous model portfolios.Based on subscriber requests, this month we are re-introducing a feature from the previous version of The Index Investor: Tactical Asset Allocation Implications from our analyses.
The second tactical approach is based on our subjective view not only of current asset class valuations, but also of the implications of the broader macro trends and uncertainties that we analyze each month. Importantly, this subjective view reflects our primary goal of avoiding large downside losses, rather than seeking large upside gains.
Two final notes: First, with respect to US fixed income, we include credit products (investment grade and high yield) in the same asset class as government debt, and will shift into the former when their valuations become attractive. Second, we regard gold not as a separate asset class to be held long-term, but rather as a complement to cash, into which we shift in periods of substantial overvaluation across multiple asset classes.
More information about our investment beliefs, including our core philosophy, approach to asset allocation (including our model portfolios and their long-term track record), and views on various approaches to active and passive management can all be found here.
Here is our latest asset allocation view:
Forecast Logic: Quantitative Indicators
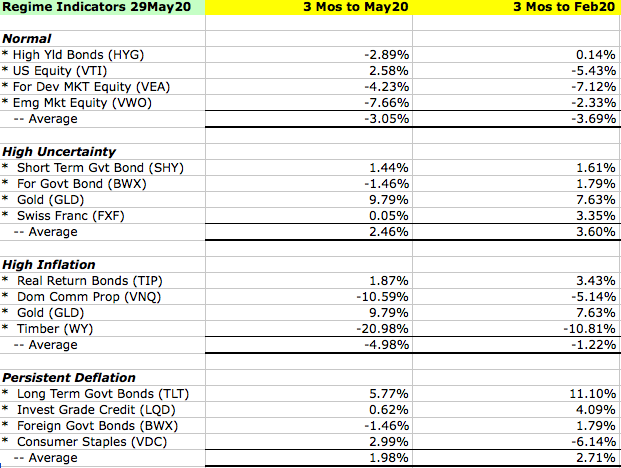
Implications of the Most Recent Three Month Asset Class Returns
Our quantitative forecast methodology focuses on the level and change in three-month returns, over the most recent and previous three-month periods, for those asset classes, which should perform best under different regimes (in this sense, our regimes can be regarded as macro factors). We assume that relatively higher returns are associated with more widely held investor belief in the probability that a given macro regime will develop in the future.
Asset Class Valuation and Momentum Indicators (@29May20)
| Asset Class (ETF) | Valuation | 1 Month Return | Conclusion |
| US Real Return Govt Bond (TIP) | Likely Overvalued* | 0.65% | Increasing Overvaluation |
| US Nom Return Govt Bond (GOVT) | Likely Overvalued* | (0.13)% | Decreasing Overvaluation |
| US Investment Grade Credit (LQD) | Likely Undervalued* | 2.45% | Decreasing Undervaluation |
| US High Yield Credit (HYG) | Likely Overvalued* | 2.93% | Increasing Overvaluation |
| US Commercial Property (VNQ) | Likely Undervalued* | 5.29% | Decreasing Undervaluation |
| US Equity (VTI) | Very Likely Overvalued* | 5.40% | Increasing Overvaluation |
| Foreign Devel Mkt Equity (VEA) | Very Likely Undervalued* | 5.58% | Decreasing Undervaluation |
| Emerging Markets Equity (VWO) | Very Likely Overvalued* | 3.29% | Increasing Overvaluation |
| Timber (WY) | Almost Certainly Overvalued* Dividend eliminated this month. | (7.68)% | Decreasing Overvaluation |
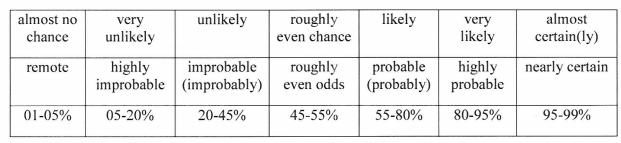
Note: The language we use to describe our estimated likelihood of asset class over or undervaluation is based on US Intelligence Community Directive 203 on Analytic Standards, which includes the following table:
Market Stress Indicators (@29May20)
| Market Stress Indicator | This Month vs Last Month |
| Asset Class Returns Autocorrelation (this month versus last month). Higher autocorrelation is an indicator of higher market stress. | .45 vs .66 the previous month. This indicates a decrease in market stress. |
| Economic Policy Uncertainty Index (how many days over the last 30 was index in top quartile of values since 1985?). A higher number equals more market stress. | On 30 days last month (unchanged from the previous month) the index was in the top quartile of daily values since 1985 (the 99th percentile of all rolling 30-day periods). This indicates a very high level of stress. |
| AAA Rated Bonds Spread over 10 Year Treasury Yield (month end). Higher spreads indicate rising concern about market liquidity. | 1.76% (789h percentile since 1983), vs 1.74% at the end of the previous month. |
| BB Rated Bonds Spread over 10 Year Treasury Yield (month end). High spreads indicate increasing credit risk. | 4.17%, (67th percentile) down from 5.39% (87th) last month. |
| Gold Price per Ounce in US Dollars (month end). Rising gold prices are an indicator of increasing market uncertainty and stress. | $1,740 vs $1,717, up 1% from the previous month. At the end of 2017, we estimated the “disaster premium” in the gold price was 47% (see our methodology in the Appendix). At the end of last month it was 81%. (see our methodology in the Appendix). |
New Qualitative Evidence
Many of them indicate that a substantial increase in uncertainty very likely lies ahead that is not yet reflected either in dominant popular narratives or financial market prices. These include:
(1) China’s unilateral imposition of a new security law on Hong Kong that will sharply reduce personal liberties there. This will also trigger stronger opposition in Taiwan to closer ties with China. Along with the proposed US blockage of advanced microchip shipments to China (and possibly worsening domestic political conditions there), this raises the probability of some type of kinetic conflict between the US and China – e.g., rapid escalation of an incident in the South China Sea, or an outright invasion of Taiwan.
(2) Indications of worsening credit problems as COVID19 social distancing and other measures drag on.
(3) An increasing number of COVID19 infections in US states that were early to reopen their economies.
(4) Riots in many US cities in which property destruction and looting reached into affluent areas that had not been affected by riots in the 1960s. While ostensibly a reaction to the murder of George Floyd by a police officer in Minneapolis on May 25th, they also very likely represented an expression of many people’s rage and frustration over the increasingly unequal health and economic impacts of the COVID19 shutdown. These feelings will very likely further intensify as emergency government support payments to businesses and individuals expire, which will very likely lead to sharp increases in job losses, housing evictions, and pressures on an already overtaxed food bank system. In short, given building stresses on the economic, social, and political system, there is substantial potential for more demonstrations and riots in the run-up to the November election.
(5) President Trump’s authoritarian reaction to the George Floyd riots – particularly his threat to deploy military troops to cities to “dominate the rioters” – triggered stinging public rebukes from Admiral Mike Mullen and General Jim Mattis, two highly respect former Chairmen of the US Joint Chiefs of Staff. Ominously, as his approval ratings continued to decline, the president’s rhetoric about the potential illegitimacy of the November election has been increasing, causing some observers to wonder whether he will either attempt to cancel it, prevent the adoption of postal voting (which would be critical to voter turnout if the country is in the middle of a second wave of COVID19 infections), and/or refuse to accept his defeat if that is the final outcome.
Pre-Mortem Analysis
One of the most important forecasting disciplines is to ask yourself why your forecast could be wrong. Dr. Gary Klein’s research has shown that a very powerful and insightful way to do this is via a “pre-mortem analysis.” This method asks you to assume that it is a point in the future, and your forecast has been proven wrong (or your strategy or company has failed). You are then asked to look backward from this imagined point in the future, to explain why you failed, what you missed, and what you could have done differently to avoid your fate.
The pre-mortem method takes advantage of the fact that humans reason much more concretely and in more detail when explaining the past than they do when trying to forecast the future.
So let us assume that it is one year from now, and our current forecast has turned out to be wrong.
How did this happen? What developments did we fail to anticipate?
- A number of world leaders – Xi Jinping and Donald Trump, and to a lesser extent Vladimir Putin and Ali Khamenei are all facing sharply weakened economies and declining political popularity. History teaches us that this can lead to increased “foreign adventurism” to distract the public from worsening domestic conditions, as a nation rallies around its leader in a period of heightened external conflict. Should a “kinetic” conflict develop between China and the United States, or Iran and Israel, Saudi Arabia, and/ or the US, or between Russia and one or more European countries (e.g., due to a Russian incursion into the Baltics), it would generate a very sharp increase in uncertainty that would likely accelerate the already sharp COVID-19 economic slowdown. Given given high debt levels, this would very likely accelerate the arrival of the Persistent Deflation Regime.
- On the other hand, the removal from office (by one means or another) of Xi Jinping or Donald Trump * could * lead to a reduction in the dangerously growing conflict between the two nations, and increase cooperation in both the fight against COVID19 and the recovery of the global economy. This would somewhat reduce the probability of both the Persistent Deflation and High Inflation Regimes, and raise the relative probabilities of the High Uncertainty and Normal Times Regimes.
- A supply side shock of some type – beyond the disruption of global supply chains caused by COVID-19 -- could produce a sudden increase in inflation. The most likely scenario is a reduction in oil supplies due to a prolonged kinetic conflict between Iran and the US. An unlikely scenario could be major crop failures associated with the next solar cycle, which NASA forecasts will be the weakest in 200 years.
- Another route to the high inflation regime (repeatedly noted by Bridgewater’s Ray Dalio) would be a sudden loss of confidence in the US dollar relative to other currencies (driving up import prices), perhaps because of deficit monetization and policy paralysis if a severe downturn continues without meaningful policy reform to increase productivity and growth and reduce inequality. However, this would also require that there was relatively more confidence in another currency, with the Euro being the most likely candidate. This currently seems unlikely, given both the Eurozone’s economic and political situation, and the prospect of an intensifying conflict between the West and China. However, if confidence collapsed in all major currencies, a sharp increase in inflation would lead to a dramatic rise in the price of gold.
Note: Combining Our Forecasts with Others From Other Sources and Extremizing the Result Should Increase Your Predictive Accuracy
Research has found that three steps can improve forecast accuracy. The first is seeking forecasts based on different forecasting methodologies, or prepared by forecasters with significantly different backgrounds (as a proxy for different mental models and information). The second is combining those forecasts (using a simple average if few are included, or the median if many are). The final step, which significantly improved the performance of the Good Judgment Project team in the IARPA forecasting tournament, is to “extremize” the average (mean) or median forecast by moving it closer to 0% or 100%.
Forecasts for binary events (e.g., the probability an event will or will not happen within a given time frame) are most useful to decision makers when they are closer to 0% or 100% than the uninformative “coin toss” 50%. As described by Baron et al in “Two Reasons to Make Aggregated Probability Forecasts More Extreme”, forecasters will often shrink their probability estimates towards 50% to take into account their subjective belief about the extent of potentially useful information that they are missing.
When you average multiple forecasters’ estimates, you are including more information, which should increase forecast confidence and push the mean estimate closer to 0% or 100%. However, this doesn’t happen when you use simple averaging. For this reason, forecast accuracy is increased when you employ a structured “extremizing” technique to move the mean estimate closer to 0% or 100%.
You can download an extremizing model from our website to use when combining the forecasts you use in your decision process.
The extremizing factors in our model are those that the Good Judgment Project found maximized the accuracy of combined forecasts. Note that the extremizing factor is lower when average forecaster expertise is higher. This is based on the assumption that a group of expert forecasters will incorporate more of the full amount of potentially useful information than will novice forecasters.
Feature Article: Making Good Decisions in Highly Uncertain Situations
Introduction
At the end of December 2019, global leaders faced an environment that was becoming increasingly uncertain, due to the interaction of accelerating changes in multiple areas (e.g., technology, energy and the environment, the global economy, national security, society, and politics).
And then COVID-19 arrived, creating a global health and economic crisis, and plunging the world into what is, for many people, a situation of unprecedented uncertainty.
One of our core beliefs is that decisions should be judged not on their results (which will always be affected by both unforeseen factors and normal randomness), but on the quality of the process used to make them.
But in the fact of the complex, rapidly evolving uncertainty we face today, what constitutes a high quality decision process?
This month’s feature article provides our answer to that question.
There are many criteria that can be used to categorize different kinds of decision challenges. In our experience, the three most salient are time, the nature of goals and constraints, and the degree of uncertainty.
In situations involving high time pressure, Naturalistic Decision Making (NDM) researchers like Gary Klein and Marvin Cohen have determined that high quality decisions follow a common process:
- Using cues to recognize the situation and matching it to previous experience;
- Using that experience to quickly recall from memory a preliminary course of action (COA) that worked in the past;
- Mentally simulating whether it will achieve the minimally required goals in the current situation (i.e., satisficing);
- Implementing the COA if it does, and either modifying the initial COA or repeating the process if it does not.
For decisions in evolving situations involving multiple (and often competing) goals and complex constraints, researchers like RAND’s Robert Lempert have developed methodologies like ensemble modeling and Robust Decision Making (RDM). Other researchers continued to develop scenario planning as a decision support methodology under these same conditions.
In comparison to classic multi-attribute decision theory (which focuses on identifying the optimal COA in a relatively static situation), approaches like RDM and scenarios focus on making decisions that are “robust”. Such decisions maximize the estimated likelihood of achieving a given set of goals under a wide range of possible futures.
The nature and degree of uncertainty in a situation is another critical consideration in decision processes. Such uncertainty broadly falls into three increasingly severe categories:
Risk
- The underlying causal process generating key outcomes is understood theoretically and/or can be reliably modeled (e.g., using either classical econometric and statistical methods or via machine or deep learning);
- The distributions of possible values for the model’s parameters are well known (e.g., based on historical frequencies);
- The relationships between model outcomes and target goals is clear.
Epistemic Uncertainty
- The underlying causal process generating key outcomes is understood theoretically and can be reliably modeled;
- The distribution of parameter values is not well understood, but through more research it is possible to eventually understand it;
- The relationships between model outcomes and target goals is not clear, but through more research it is possible to eventually understand them.
Ontological Uncertainty
- The underlying process generating key outcomes is not fully understood theoretically and/or cannot be reliably modeled.
- This includes situations in which machine and deep learning are used to produce forecasts instead of theorizing about and modeling the causal processes that produce the outcomes of interest.
- It also includes data generating processes (like the political economy and financial markets) in which causation is complex (e.g., characterized by time delays and non-linearities) and constantly evolving.
Since the arrival of COVID-19, we have largely been operating in the Ontological Uncertainty zone.
At first, the health challenge in the face of disease was met by Naturalistic Decision Making methods, focused on COAs that satisficed versus a simple goal: Stop people from becoming infected and dying.
As the economic, social, and political costs of measures to stop people from dying increased, the goals and constraints facing many decision makers have become more complex, causing a shift from satisficing to a search for new courses of action that are robust across a range of possible future scenarios for the evolution of COVID-19 (e.g., the effect of social distancing and masks, and the timing and effectiveness of a vaccine). At the same time, we are gradually developing a better understanding of the underlying processes generating key health and economic outcomes in the novel situation we face. But, as recent events have painfully demonstrated, we still face considerable ignorance about the drivers of medium-term national security, social, political, and financial market outcomes.
Nine Steps to Better Decisions
So how do you make good decisions in the face of these conditions?
Step #1: Identify the goal(s) you’re trying to achieve, and the constraints on the possible COAs you could pursue.
Step #2: Regain your “Situation Awareness” (SA).
SA exists on three progressively more complete levels, which correspond to your ability to accurately answer three questions:
(1) What are the most important factors/variables/forces in the situation I face? In any uncertain situation produced by a complex adaptive system, there are always many. Focus on the ones that are most important, which will likely have the biggest impact on the way the situation evolves in the future.
(2) How are these factors related to each other? In complex adaptive systems, there are usually many relationships between key variables. The key to accurate forecasts is to focus on those relationships that are most important, which tend to be the ones that are changing the fastest, and/or have non-linear and/or time-delayed effects. These interactions are often the ones that generate emergent threats (and opportunities).
(3) How could the system evolve in the future, depending on how key uncertainties turn out, and/or the effects produced by possible actions you could take?
Step #3: More deeply examine your answers to the first two questions.
For each of them, start by listing the key facts (what you know to be true) that contributed to your answers about each important element and relationship.
Then list the key assumptions (what you believe to be true) that led to your answers. Where did those assumptions come from? Possible answers:
(1) Derived from theory. How reliable is the theory, and how accurately does it describe the current situation?
(2) Derived from history (e.g., a base rate). In an evolving system, history may not always be a good guide to the future.
(3) Derived from an analogy. How different is the analogous situation from the one you face today?
(4) Inferred from your previous personal experiences. How different were they from the situation you are facing?
(5) Social learning (e.g., what other people are saying/doing; the conventional wisdom or most popular narratives). To what extent are these people relying on the same set of common, but widely shared information inputs? To what extent do these common inputs conflict with your own information?
Step #4: More deeply explore the assumptions you have listed.
What is your 95% confidence interval around the “most likely” value you have estimated for an assumption?
What is the critical uncertainty or uncertainties that drive that confidence interval?
What could you do to reduce that uncertainty (e.g., collect key information, run an experiment, etc.), and narrow the width of your confidence interval?
Step #5: Use the facts and assumptions you have provided for Questions (1) and (2) to update your answer to question (3):
How could the system evolve in the future, depending on how key uncertainties turn out, and/or the effects produced by possible actions you could take? Remember that in complex adaptive systems, the distribution of possible outcomes usually follows a power law, and not the familiar “bell curve”. Put differently, they have a lot more “tail risk” than most people appreciate.
If possible, improve your predictive accuracy by combining your forecasts with those made by others using different methodologies and/or information.
Step #6: Identify possible courses of action (COAs), and forecast their outcomes versus your goals, based on your facts and assumptions about key situation factors and relationships.
Step #7: Test the robustness of each possible COA.
How much would each assumption have to change from its “most likely” value before you would choose a different COA?
The most robust COA is the one that will achieve your minimally acceptable outcomes versus your goals under the widest range of possible value for your assumptions.
Step #8: Always do a Pre-Mortem analysis.
As human beings, we have natural tendencies towards over-optimism and overconfidence that we need to offset.
Assume it is some point in the future and your preferred COA has failed. Ask why this happened. What indicators did you miss? What could you have done differently?
Based on your answers, either modify your COA or reconsider others.
Step #9: Implement your COA, while collecting key information and using it to constantly update your Situation Awareness.
Be especially alert to information that surprises you, which is a sign that your SA is incomplete. Write the information down, because you will soon forget it as your mind subconsciously tries to incorporate it into your existing mental model(s). Then take the time to consider what the surprising information means.
For more information on how to weigh new information to update your beliefs and Situation Awareness, see this post by our affiliate, Britten Coyne Partners.
Ultimately, the use of a good process to make decisions in situations of high uncertainty has two benefits. First, it raises the odd that you will make good decisions, and that over time this will result in cumulatively better outcomes for you than for people who use weaker decision processes.
Perhaps more important, good decision processes reduce your future exposure to self-destructive regret. Using a good process makes it far less likely you will torment yourself by endlessly revisiting past decisions and playing “woulda-coulda-shoulda” in your head.
High Value Information Observed In May 2020
In our model of the complex global macro system, change drivers are arrayed across a roughly chronological process (albeit one with many feedback loops), in which technological and environmental changes precede changes in the economy and national security, which in turn lead to changes in society and politics, all of which produce the effects we observe in investor behavior and financial market valuations and returns.
In our methodology, we classify new information as significant and highly valuable if either it (1) is an “indicator”, which reduces our uncertainty about the value of a parameter in our mental model for making sense of the dynamic macro system, or (2) it is a “surprise” which increases our uncertainty about either the range of potential values for a parameter or the structure of our model. With respect to indicators, the higher our priori probability is for a regime, the more we look for indicators that it will not occur, and the lower our prior probability for a regime, the more we look for indicators that it will occur. Put differently, we tend to look for high value indicators that disconfirm our prior views.
| New Technology Information: Indicators and Surprises | Why Is This Information Valuable? |
| “Measuring the Algorithmic Efficiency of Neural Networks”, by Hernandez and Brown | SURPRISE This month, there are further indicators of the rate at which various technologies are developing. “Three factors drive the advance of AI: algorithmic innovation, data, and the amount of compute available for training. Algorithmic progress has traditionally been more difficult to quantify than compute and data… “We show that the number of floating-point operations required to [produce a standard benchmark result] has decreased by a factor of 44x between 2012 and 2019. This corresponds to algorithmic efficiency doubling every 16 months over a period of 7 years. Notably, this outpaces the original Moore’s law rate of improvement in hardware efficiency (11x over this period).” |
| “The Changing Economics of Knowledge Production”, by Abis and Veldkamp | SURPRISE “Machine learning, artificial intelligence (AI), or big data all refer to new technologies that reduce the role of human judgment in producing usable knowledge… “Big data technologies change the way in which data and human labor combine to create knowledge. Is this a modest technological advance or a transformation of our basic economic processes? Using hiring and wage data from the financial sector, we estimate firms' data stocks and the shape of their knowledge production functions. “Knowing how much production functions have changed informs us about the likely long-run changes in output, in factor shares, and in the distribution of income, due to the new, big data technologies. Using data from the investment management industry, our results suggest that the labor share of income in knowledge work may fall from 44% to 27%”… “Our results inform us about how the demand for labor and data will change, how to value each in the new economy, and how the distribution of income is likely to shift, absent policy intervention.” |
| “Explainable Artificial Intelligence: a Systematic Review”, by Vilone and Longo | Rapidly increasing use of machine learning (ML) and deep learning (DL) technologies in recent years has led to a matching increase in demand for technologies that can explain the logic behind their results (“Explainable Artificial Intelligence” or XAI). This new paper presents an extensive overview of the current state of the XAI field. The authors note that, “unfortunately, most of the models that have been built with ML and deep learning have been labeled ‘black-box’ by scholars because their underlying structures are complex, non-linear and extremely dicult to be interpreted and explained to laypeople. “This opacity has created the need for XAI architectures that is motivated mainly by three reasons: i) the demand to produce more transparent models; ii) the need of techniques that enable humans to interact with them; iii) the requirement of trustworthiness of their inferences. “Additionally, as proposed by many scholars, models induced from data must be liable as liability will likely soon become a legal requirement. Article 22 of the [European Union’s] General Data Protection Regulation (GDPR) sets out the rights and obligations of the use of automated decision making. Noticeably, it introduces the right of explanation by giving individuals the right to obtain an explanation of the inference/s automatically produced by a model, confront and challenge an associated recommendation, particularly when it might negatively affect an individual legally, financially, mentally or physically.” |
| “From Probability to Consilience: How Explanatory Values Implement Bayesian Reasoning”, by Wojtowicz and DeDeo | SURPRISE This paper discusses in depth what we mean by “an explanation”. Along with “Explaining Explanation for Explainable AI” (which takes a naturalistic approach to explanation), and “Metrics for Explainable AI: Challenges and Prospects”, both by Hoffman, Klein, and Mueller, the current paper is the best one we have read on this increasingly critical topic. “Intuitively, philosophically, and as seen in laboratory experiments, explanations are judged as better or worse on the basis of many different criteria… “The multiplicity of values appears to conflict with Bayesian models of cognition, which speak solely in terms of degrees of beliefs and suggest we judge explanations as better or worse on the basis of a single quantity, the posterior likelihood [the extent to which the probability of observed data, given an explanation, aligns with observations].” The authors “show how to resolve these conflicts by arguing that previously-identified explanatory values capture different components of a full Bayesian calculation and, when considered together and weighed appropriately, implement Bayesian cognition.” These values include, “(i) descriptiveness, which measures the total extent to which the explanation predicts each fact in isolation from the others; (ii) co-explanation, which measures the extent to which the explanation links facts together; (iii) theoretical, or evidence-independent values; and (iv) context-dependent priors.” |
| “Smarter enterprise search: why knowledge graphs and NLP can provide all the right answers”, by Accenture | SURPRISE This article outlines how improvements in two technologies are leading to substantial improvements in augmented cognition, and increasing the productivity of knowledge workers – but in the longer term, probably also leading to a reduction in their numbers. “The amount of information available to us is extraordinary. And it’s growing exponentially all the time: already amounting to 44 zetabytes, data volumes are predicted to hit 175 zetabytes in the next five years (IDC) . Eighty percent of this data is unstructured (emails, text documents, audio, video, social posts and so on), and just 20% is held in structured systems of some kind. “To find answers from this massive resource and pinpoint exactly what we’re looking for, we need a way to extract facts from documents and store those facts somewhere for easy access.” Rapid progress in two areas is making this much easier: Natural Language Processing (the automatic computational processing of human knowledge), and Knowledge Graphs. A Knowledge Graph is a model of a knowledge domain created by subject-matter experts with the help of intelligent machine learning algorithms (a process that is gradually being increasingly automated). It provides a structure and common interface for data and enables the creation of smart multilateral relations throughout your databases (based on a common subject-predicate-object format). The knowledge graph is essentially another layer that sits on top of an existing database, which in turn enables that use of artificial intelligence technologies to operate across multiple knowledge graphs, in applications such as advanced search. |
| | |
| | |
| | |
| | |
| | |
| | |
| | |
| | |
| New Energy and Environment Information: Indicators and Surprises | Why Is This Information Valuable? |
| “Why Are Fossil Fuels So Hard To Quit?” by Samantha Gross from Brookings | This new analysis takes a sober look at the obstacles to fossil fuel displacement. Gross argues that, “throughout history, humanity’s energy use has moved toward more concentrated, convenient, and flexible forms of energy. Understanding the advantages of today’s energy sources and the history of past transitions can help us understand how to move toward low-carbon energy sources” … “The first big energy transition was from wood and charcoal to coal, beginning in the iron industry in the early 1700s. By 1900, coal was the primary industrial fuel, taking over from biomass to make up half the world’s fuel use. Coal has three times the energy density by weight of dry wood and is widely distributed throughout the world. Coal became the preferred fuel for ships and locomotives, allowing them to dedicate less space to fuel storage… “Oil was the next major energy source to emerge. Oil has twice the energy density of coal by weight…Oil entered the market as a replacement for whale oil for lighting, with gasoline produced as a by-product of kerosene production. However, oil found its true calling in the transportation sector…overtaking coal to become the world’s largest energy source in 1964… “In more recent times, natural gas has become valued for its clean, even combustion and its usefulness as a feedstock for industrial processes and power generation… “A final key development in world energy use was the emergence of electricity in the 20th century…which transformed the energy system from one in which fossil energy was used directly into one in which an important portion of fossil fuels are used to generate electricity…Fossil fuels are still the backbone of the electricity system, generating 64% of today’s global supply… “In sum, the story of energy transitions through history has been a constant move toward fuels that are more energy-dense and convenient to use than the fuels they replaced… “Pound for pound, gasoline or diesel fuel contain about 40 times as much energy as a state-of-the-art battery… “Electrify everything” is a great plan, so far as it goes, but not everything can be easily electrified…Certain qualities of fossil fuels are difficult to replicate, such as their energy density and their ability to provide very high heat, as is required for the production of steel, cement, and glass…. “Those pushing to end fossil fuel production now are missing the point that fossil fuels will still be needed for some time in certain sectors. Eliminating unpopular energy sources or technologies, like nuclear or carbon capture, from the conversation is short-sighted. “Renewable electricity generation alone won’t get us there — this is an all-technologies-on-deck problem. I fear that magical thinking and purity tests are taking hold in parts of the left end of the American political spectrum, while parts of the political right are guilty of outright denialism around the climate problem. In the face of such stark polarization, the focus on practical solutions can get lost — and practicality and ingenuity are the renewable resources humanity needs to meet the climate challenge.” |
| “Integrating Batteries in the Future Swiss Electricity Supply System”, by Vandepaer et al | SURPRISE This new analysis provides a lifecycle perspective on the environmental impact of increased use of batteries for energy storage. “Stationary batteries are projected to play a role in the electricity system of Switzerland after 2030. By enabling the integration of surplus production from intermittent renewables, energy storage units displace electricity production from different sources and potentially create environmental benefits. “Nevertheless, batteries can also cause substantial environmental impacts during their manufacturing process and through the extraction of raw materials. A prospective consequential life cycle assessment (LCA) of lithium metal polymer and lithium-ion stationary batteries is undertaken to quantify potential environmental benefits and drawbacks… “Energy scenarios are used to obtain marginal electricity supply mixes, and projections about the battery performances and the recycling process are sourced from the literature… “By enabling the integration of surplus production from intermittent renewables, energy storage technologies displace electricity production from different sources and potentially create environmental benefits. [However], increased use of stationary batteries is likely to cause additional [negative] environmental impacts… |
| | |
| | |
| | |
| | |
| | |
| | |
| | |
| | |
| | |
| | |
| | |
| New Economic Information: Indicators and Surprises | Why Is This Information Valuable? |
| “COVID-19 And Non-Performing Loans: Lessons From Past Crises” by Ari et al | Non-performing loans are a crucial policy consideration, especially in times of wider economic crisis. This analysis uses a new database covering 88 banking crises since 1990 to draw lessons for post-COVID-19 resolution of non-performing loans. The authors find that, “compared to the 2008 crisis, the pandemic poses some different challenges. Despite some respite from the credit-crash of 2008, policymakers today are faced with substantially higher public debt, less profitable banks, and often weaker corporate sector conditions, making resolution of non-performing loans even more challenging.” |
| “The Wrong Way to Help” by Steven Malanga | The dramatic economic impact of COVID019 will substantially reduce state and local government revenues in the United States. Malanga raises the important point that many of these governments were run ineffectively and inefficiently before COVID-19 arrived, and that bailing out their bad practices is not a long-term solution to the challenges they face. “The latest Democratic stimulus plan, the massive, $3 trillion Heroes Act, sets aside about a third of that total sum for aid to state and municipal governments. That’s on top of the hundreds of billions of dollars these governments have already received from the CARES Act and other measures, including money for additional Medicaid costs, mass transit subsidies, and direct aid to budgets”… “The Republican-controlled Senate has balked at these huge numbers, and with good reason. The amount that officials are seeking is likely well beyond the estimated total cost of the current recession for states and municipalities. The huge funding requests, moreover, essentially assume that the entire recession is a function of the virus and that governments deserve to be made whole for any losses, even though fiscal analysts have warned for years that another recession was coming and many states were unprepared for it… “Many states face extreme fiscal problems now because they’ve continued with bad budgeting practices for years, refusing to initiate reforms even after the fiscal pressures created by the 2008 recession.” |
| “Labor Markets During The Covid-19 Crisis: A Preliminary View”, by Coibion et al | SURPRISE “Using new ongoing large-scale surveys of U.S. households much like the ones run by the BLS, we provide some preliminary evidence on the response of labor markets in the U.S. to the current crisis. “We focus on three key variables typically measured by the BLS: the employment-to-population ratio, the unemployment rate, and the labor force participation rate. “Historically, the employment-to-population ratio and the unemployment rate are near reverse images of one another during recessions as workers move out of employment and into unemployment (or workers in unemployment find it harder to move into employment). “More severe recessions also sometimes lead to a phenomenon of “discouraged workers,” in which some unemployed workers stop looking for work. This leads them to be reclassified as “out of the labor force” by the BLS definitions, so the unemployment rate can decline along with the labor force participation rate while the employment-to-population ratio shows little recovery, not because the unemployed are finding work but rather because they stop trying to find it. “Jointly, these three metrics therefore provide a succinct and informative summary of the state of labor markets… The authors “use a repeated large-scale survey of households in the Nielsen Homescan panel to characterize how labor markets are being affected by the covid-19 pandemic” and document several facts. “First, job loss has been significantly larger than implied by new unemployment claims: we estimate 20 million lost jobs by April 8th, far more than jobs lost over the entire Great Recession. “Second, many of those losing jobs are not actively looking to find new ones. As a result, we estimate the rise in the unemployment rate over the corresponding period to be surprisingly small, only about 2 percentage points. “Third, participation in the labor force has declined by 7 percentage points, an unparalleled fall that dwarfs the three percentage point cumulative decline that occurred from 2008 to 2016.” |
| “Why Has the US Economy Recovered So Consistently from Every Recession in the Past 70 Years?” by Hall and Kulyak | SURPRISE “It is a remarkable fact about the historical US business cycle that, after unemployment reached its peak in a recession, and a recovery began, the annual reduction in the unemployment rate was stable at around 0.55 percentage points per year [i.e., just over half a percent per year]. “The economy seems to have had an irresistible force toward restoring full employment. There was high variation in monetary and social policy, and in productivity and labor-force growth, but little variation in the rate of decline of unemployment.” If the .55% per year recovery rates holds after the COVID-19 induced recession, the recovery of employment will be very slow, which will accentuate pre-existing social and political tensions. |
| “Production networks and epidemic spreading: How to restart the UK economy?” by Pichler et al See also, “Socioeconomic Network Heterogeneity and Pandemic Policy Response” by Akbarpour et al for a similar analysis based on US metropolitan areas | SURPRISE This is the best analysis of the challenges of reopening the economy and how they might be met that we have read. “The shocks to the economy caused by social distancing are highly industry specific. Some industries are nearly entirely shut down by lack of demand, others are restricted by lack of labor, and many are largely unaffected. Feedback effects amplify the initial shocks. The lack of demand for final goods such as restaurants or transportation propagates upstream, reducing demand for the intermediate goods that supply these industries. “Supply constraints due to lack of labor under social distancing propagate downstream, by creating input scarcity that can limit production even in cases where the availability of labor and demand would not have been an issue. “The resulting supply and demand constraints interact to create bottlenecks in production. The resulting decreases in production may lead to unemployment, decreasing consumption and causing additional amplification of shocks that further decrease final demand… “The social distancing measures imposed to combat the COVID-19 pandemic have created severe disruptions to economic output. Governments throughout the world are contemplating or implementing measures to ease social distancing and reopen the economy, which may involve a tradeoff between increasing economic output vs. increasing the expected number of deaths due to the pandemic. Here we investigate several scenarios for the phased reopening of the economy”… “At one extreme, we find that reopening only a very limited number of industries can create supply chain mis-coordination problems that in some cases might actually decrease aggregate output. In contrast, reopening all industries would most likely increase R0 [COVID-19’s Basic Reproduction Number] above 1 [and cause virus infections to once again exponentially increase]. “We find a good scenario in-between these extremes: reopening a large part of the upstream industries, while consumer-facing industries stay closed, schools are open only for workers who need childcare, and everyone who can work from home continues to work from home…[This] limits supply chain mis-coordination while providing a large boost to output and a relatively small increase in infection rates. |
| “Who Will Pay for the Government Spending?” by Rana Foroohar in the Financial Times | Writing before George Floyd’s death and subsequent riots, Foroohar observed that she “thought former Clinton labour secretary Robert Reich got it pretty much right a few days ago when he wrote about four new classes of workers born out of the Covid-19 era — the remotes, the essentials, the unpaid and the forgotten. “The first two categories will have work; the last two won’t, which roughly squares with the numbers in the NBER paper I flagged last week [as did we in our last issue, “COVID019 is Also a Reallocation Shock”, by Barrero et al], predicting that 42 per cent of -those being laid off won’t have jobs to come back to. “The big question: what to do about this? The answer — bigger government — seems obvious. These people will have to be retrained for new types of work, and in the meantime, provided with longer term unemployment benefits, given some form of free healthcare, and so forth” … “The idea that those people simply have to go it alone isn’t sustainable from either an economic or a social stability standpoint. So, if we assume a bigger government, we must ask: how is it paid for?...Do we print money, tax wealth, or do some combination of both?” In the same column, Rana’s colleague, Ed Luce replied that he didn’t “think the answer needs to be very complicated. Washington should equalise capital gains and dividend tax with the income tax rate, remove tax deferrals for leverage, purge loopholes in the corporate tax code and impose an escalating carbon tax. “Some of this would raise revenue. Other reforms, such as swapping a carbon tax for the employer-paid social security tax, would be fiscally neutral but highly efficient. We should tax “bads”, such as carbon, and remove taxes on “goods”, such as jobs… “The basic equation is simple. Coronavirus will deepen the secular stagnation malaise that Larry Summers has written about. In the absence of private sector demand, the public sector must fill the gap. Whether politics will permit common sense to prevail is another matter.” |
| Two new articles focused on the potential dangers to the financial system posed by deteriorating leveraged loans that have been packaged and resold in Collateralized Loan Obligation investment structures. | SURPRISE In “CLOs: Ground Zero for the Next Stage of the Financial Crisis?” the FT’s Rennison and Smith note that “the close cousin of collateralised debt obligations, the pools of mortgage-backed securities that became notorious during the subprime meltdown over a decade ago, CLOs package up risky corporate loans into a group of new securities that have cascading exposure to default by any of the underlying borrowers. “To the outsider, they can appear to perform some of the alchemy that was evident in the run-up to the financial crisis, transforming risky credits into securities where the largest tranche is awarded a triple A rating… The US CLO market — by far the biggest — has expanded from $327bn in 2007 to $691bn at the end of 2019, according to data from JPMorgan, rising in lockstep with the underlying leveraged loan market which has doubled from $554bn to nearly $1.2tn, according to data from S&P Global… “The worry is that further corporate downgrades and escalating defaults could start to unravel sections of the CLO market, in turn prompting a much deeper sell-off that magnifies the broader impact to the economy. Although proponents of CLOs say the shock absorbers built into their structures.” In “The Looming Bank Collapse”, Frank Partnoy presents a worst case, but not impossible, scenario, along with an excellent description of CLO mechanics. Partnoy notes that, “A CLO walks and talks like a CDO, but in place of loans made to home buyers are loans made to businesses— specifically, troubled businesses. CLOs bundle together so-called leveraged loans, the subprime mortgages of the corporate world.” Partnoy goes on to observe that, “The Bank for International Settlements estimates that, across the globe, banks held at least $250 billion worth of CLOs at the end of 2018… A more complete picture is hard to come by, in part because banks have been inconsistent about reporting their CLO holdings. “The Financial Stability Board, which monitors the global financial system, warned in December that 14 percent of CLOs—more than $100 billion worth—are unaccounted for.” In the same report, the FSB “estimated that, for the 30 “global systemically important banks,” the average exposure to leveraged loans and CLOs was roughly 60 percent of capital on hand.” In the case of CDO’s, analysts believed them to be relatively low risk investments because there had never been a highly correlated fall in housing market prices across the United States. We know how that turned out. The bad news is that the same assumption underlies the belief in the low risk of various CLO tranches – there has never been a steep, correlated fall in the value of loans made to companies across multiple industry sectors. Until COVID-19 arrived… Finally, CLO losses won’t be the only ones banks will likely be writing off against their capital bases. They also have their own direct business and consumer loans, many of which have deteriorating credit quality. For example, consider this recent grim assessment by McKinsey: “Unless the accounting rules regarding how losses must be recognized are amended, all signs point to a wave of losses crashing over the US retail-lending landscape over the next nine to 36 months. In the short term (three to six months), according to loss forecasts by McKinsey, the current stock of medium- and late-stage delinquent accounts is likely to charge off almost in its entirety, leading to losses of $15 billion to $25 billion. Longer term, the impact of an up to 20 percent unemployment rate will render those customers already struggling to manage their revolving debt largely incapable to do so and will spark an extended period of elevated losses, which could total an excess of $130 billion over the next two years” (“What’s Next for US Credit Card Debt?”). In sum, these articles make it painfully clear that continued deterioration in corporate credit and household quality could eventually trigger a banking crisis. |
| “Modern Private Equity and the End of Creative Destruction” by Sebastien Canderle | The author notes that the large number of loans made in recent years with very few covenants (i.e., “covlite” loans), often to private equity backed companies, will very likely produce drawn out loan restructurings during the post-COVID19 downturn, and the creation of many more “zombie” companies that exert a deflationary effect on the economy. |
| “Zombie Credit and Inflation: Evidence from Europe” by Acharya et al | Based on a study of European evidence, the authors show how providing cheap credit to keep distressed firms from closing has a number of deflationary effects. “In the cross-section of industries and countries, we find that a rise of zombie credit is associated with a decrease in firm defaults and entries, firm markups and product prices; lower productivity; and, an increase in aggregate sales as well as material and labor cost. These results hold at the firm-level, where we document spillover effects to healthy firms in markets with high zombie credit.” The authors conclude that “without a rise in zombie credit post 2012, annual inflation in Europe during 2012-2016 would have been 0.45 percentage points higher.” |
| “Monopsony and Outside Options”, by Stansbury et al | SURPRISE This paper supports the hypothesis that increasing corporate concentration has depressed real wages. “In imperfectly competitive labor markets, the value of workers’ outside option matters for their wage. But which jobs comprise workers’ outside option, and to what extent do they matter?” The authors “split outside options into two components: within-occupation options, proxied by employer concentration, and outside-occupation options, identified using new occupational mobility data.” They find that, “moving from the 75th to the 95th percentile of employer concentration (across workers) reduces wages by 5%. Differential employer concentration can explain 21% of the interquartile wage variation within a given occupation across cities.” They also find that the “differential availability of outside-occupation options can explain a further 13% of within-occupation wage variation across cities. Moreover, the two interact: the effect of concentration on wages is three times as high for occupations with the lowest outward mobility as for those with the highest.” |
| “Investment, Productivity, and the Bonus Culture” by Andrew Smithers | For years, Andrew Smithers has been one of the most acute, if underappreciated (outside the UK) observers of the way business and financial services culture interact in financial markets and the real economy. His latest essay is no exception. He begins with an often overlooked point: “Weak growth is far and away the most important economic problem facing the United States. This problem is not simply the result of the financial crisis or the severe recession that followed. Rather, it is the result of a much earlier reduction in business investment.” His thesis is that, “While short–term growth depends on demand, it is rising supply—the ability of the economy to increase output—that determines economic success over time. America’s problem is the slow growth of its potential to supply goods and services caused by two decades of underinvestment” … “Although commentators have blamed this weakness on various issues, the data show that the major cause has been a change in the way company managements are paid. The 1990s saw the arrival of the bonus culture, which massively shifted management incentives and thus changed management behavior. Sadly, the change did immense damage to the economy. “Managements were encouraged to invest less and, with lower investment, growth faltered… Had the U.S. economy continued to grow as rapidly over the past dozen years as it had before, the incomes of Americans—as well as spending on schools, law enforcement, and public health—could be 20 percent higher than they are today, without any increase in tax rates or public debt. Not only would there be more prosperity and less poverty, there would also be more resources available to address other problems. “Restoring growth should therefore be the major priority for the United States, and that will require higher levels of investment.” To which we would add that, in many cases higher investment in new technologies will not produce a broad increase in labor productivity unless it is matched by changes that dramatically improve the performance of America’s primary and secondary education systems. |
| | |
| | |
| | |
| | |
| | |
| | |
| | |
| | |
| New National Security Information: Indicators and Surprises | Why Is This Information Valuable? |
| On May 27th, China’s National People’s Congress passed a national security law that will drastically curtail civil liberties in Hong Kong | SURPRISE China has unilaterally abrogated the 1984 Sino-British Joint Declaration, and ended the “one country, two systems” approach that has prevailed in Hong Kong since the UK handed over its former colony to China in July 1997. This indicates that China is now less concerned with damaging its international reputation when perceived risks to its internal stability are involved. Whether this creates greater doubts about Xi’s leadership among other CCP factions, and whether that could lead to a removal of Xi remains to be seen. While the former seems very likely the latter seems equally unlikely. This latest development also very likely indicates that China is more willing to take aggressive action towards Taiwan, even as the citizens of the latter now see the emptiness of any future promise of “one country, two systems” for their island. |
| “The Chip Wars of the 21st Century”, by Steve Blank, and “Could Donald Trump’s War Against Huawei Trigger a Real War With China?” by Graham Allison See also, “The US Must Increase Chip Production to Survive the Tech Cold War” by Richard Waters in the Financial Times | SURPRISE Blank’s paper provides ample evidence to support his thesis: “Controlling advanced chip manufacturing in the 21st century may well prove to be like controlling the oil supply in the 20th. The country that controls this manufacturing can throttle the military and economic power of others.” He goes on to warn that, “The United States recently did this to China by limiting Huawei’s ability to outsource its in-house chip designs for manufacture by Taiwan Semiconductor Manufacturing Company (TSMC), a Taiwanese chip foundry. China may respond and escalate via one of its many agile strategic options short of war, perhaps succeeding in coercing the foundry to stop making chips for American companies. If negotiations fail, China might take drastic measures, turning the tables on the United States.” In his paper, Allison elaborates on this threat. “The centerpiece of the Trump administration’s “tech war” with China is the campaign to prevent its national champion Huawei from becoming the dominant supplier of 5G systems to the world. The Administration’s objective, as a former Trump NSC staffer described it, is to “kill Huawei.” And China has heard that message. “As Huawei’s legendary CEO Ren Zhengfei told its leadership in February, “the company has entered a state of war.” After months of diplomatic efforts to dissuade other nations from buying their 5G infrastructure from Huawei, the administration delivered what one official called a ‘death blow.’ “On May 15, the Commerce Department banned all sales of advanced semiconductors from American suppliers to Huawei. It also prohibited all sales of equipment to design and produce advanced semiconductors by foreign companies that use U.S. technology or intellectual property. “In the five months between now and the election, could the U.S. attempt to enforce that ban become a twenty-first-century equivalent of the oil embargo the United States imposed on Japan in August 1941?” … Allison goes on to make a point we have frequently made ourselves over the years: “The thought that the United States and China could find themselves in a real, hot, bloody war will strike many readers as inconceivable. But we should remember that when we say something is inconceivable, this is not a claim about what is possible in the world, but rather about what our minds can conceive. “In the summer of 1941, the possibility that a nation less than one-quarter the size of the United States would launch a bolt from the blue against the most powerful nation in the world was beyond Washington’s imagination.” Allison asks us to “imagine further that Huawei’s Chairman really believes what he said after the ban was announced that this forces Huawei “to seek survival.” If President Xi Jinping concludes that this is a matter of life and death for his champion advanced technology company that is the poster child for his signature program promising Chinese technological leadership by 2025 and 2030, then what options does China have?” “The leading producer of advanced semiconductors for Huawei is the Taiwanese company TSMC. Its factories that supply Huawei and other leading Chinese technology companies are located ninety miles off the shore of the Chinese mainland” … “While previous Chinese leaders had followed a strategy that envisioned the magnetic pull of its rapidly-growing economy drawing Taiwan into the motherland, Xi Jinping’s government has concluded that this approach failed. As Xi’s Party-led autocracy has tightened controls against political opposition or criticism, Taiwanese, like Hong Kong residents, have become increasingly resistant to the prospect of being ruled by Beijing. “In the twists and turns of this story, observers of the recent National People’s Congress in Beijing will have noticed that Premier Li Keqiang’s speech dropped the term “peaceful” from Beijing’s standard call for the reunification of Taiwan. One of China’s senior military leaders, Gen. Li Zuocheng, gave a rousing speech to the Congress assuring them that “If the possibility for peaceful reunification is lost, then the People’s armed forces will, with the whole of the nation, including the people of Taiwan, take all necessary steps to resolutely smash any separatist plots or actions”… “If Chinese forces seized TSMC factories and laboratories, then would this solve Huawei’s and other Chinese technologies leader’s advanced semiconductor problems? “While views differ, having consulted with a number of those at leading U.S. and UK companies in this industry, my best judgment is that this could buy China critical time—one to two years— to advance its own initiatives. Of course, industry leaders like Qualcomm and ARM are continuously improving their designs and their manufacturing processes. But since Huawei and a number of other Chinese firms have been hard at work in developing indigenous capabilities, even if they should be a year behind, given their other advantages in 5G, this could still allow Chin to sustain its leadership in this critical new technology”… “The critical question is whether such a scenario is possible. And the answer to that question is most certainly yes. Those who find this too fanciful should review carefully what President Xi’s Party-led autocracy has done in the past several weeks in Hong Kong… “In sum: the remainder of 2020 could pose as severe a test for the United States and China as the final five months of 1941 did for the United States and Japan.” See also: “A New Global Crisis is Looming in East Asia”, by Gideon Rachman in the Financial Times. |
| “Chinese Debates on the Military Utility of Artificial Intelligence” by Michael Dahm See also, “Mosaic Warfare” by Clark et al from the Center for Strategic and Budgetary Assessment, on the emergence of “decision centric warfare” | “The Chinese military has been opaque about its AI strategy and intentions. Undoubtedly, Chinese military officials understand they must compete with the United States by adapting quickly to changes in warfare brought about by AI and autonomous systems. An examination of the ongoing debate within the ranks of China’s People’s Liberation Army (PLA) about the transformation of warfare by AI — what they call “intelligentized warfare” — reveals that this new form of warfare is an extension of existing Chinese strategy and operational concepts… “The PLA’s overarching strategy for defeating the U.S. military, or any foreign adversary, is to dominate in a system-of-systems confrontation. This method of war fighting focuses on creating disruption or paralysis across an enemy system-of-systems versus emphasizing the attrition of forces. “First, the PLA will attempt to crash the adversary’s information networks using kinetic and non-kinetic means. The Chinese military believes that information is the critical element that binds and enables a larger military system-of-systems. “Second, the PLA intends to eliminate individual elements of a now-disaggregated enemy force with long-range precision fires. This Chinese military doctrine has been described as “systems confrontation,” but that short-hand does not accurately capture the potential for a cascade of compounding effects within a complex system-of-systems and the resulting paralyzing outcomes. AI may provide a critical means to that end… “American assessments of military AI o en focus on the second step — coordinated lethal attacks using autonomous systems against opposing forces. Drones and other autonomous systems are certainly under development in the PLA. However, the Chinese focus is currently on developing AI technology, methods, and tactics to precisely target key elements within an enemy’s system of-systems. “The objective is to paralyze the adversary, and goes well beyond merely “throwing sand in the gears” of the enemy joint force. If successful, the large-scale attrition of forces may not even be necessary. “The use of AI in a system-of-systems confrontation conforms with and enables existing Chinese military doctrine on informationized warfare. The PLA believes that the center of gravity in modern military operations has shifted from concentrations of forces to information systems-of-systems — everything from target detection to communication to information processing to command of action. “Modern military information systems-of-systems are vast, complex, and in the future will likely be managed by AI. Therefore, it follows that they can only be analyzed in real-time and attacked using AI. “The PLA’s objective is to use AI algorithms, machine learning, human-machine teaming, and autonomous systems collaboratively to paralyze its adversaries. “The ultimate goal for the Chinese military appears to be cognitive advantage — the ability to adapt one’s system-of-systems faster than one’s adversary… “Chinese military authors are fond of invoking the U.S.-originated OODA loop (observe, orient, decide, act). These Chinese authors observe that decision-making is the bottleneck in the OODA loop [a point made in 2006 by US authors Eric DeLange and Mike Morris in underappreciated Naval War College paper, “Decision-Centric Warfare: Reading Between the Lines of Network-Centric Warfare”]. “Future autonomous systems, they say, will compete for cognitive advantage and thus decision advantage enabling faster cycling of military action to dominate an adversary in “parallel operations” drawing from the U.S.-originated parallel warfare concept. |
| “Israel-Iran Attacks: Cyber Winter is Coming” by Srivastava et al in the Financial Times | The article describes a cyber attack on an Israeli municipal water system, alleged to have come from Iran. An unnamed Israeli official “was quoted as saying that the attack had created a precedent for tit-for-tat cyber attacks on civilian infrastructure that both countries have so far avoided — and may still be keen to avoid.” |
| “The Future of Warfare in 2030”, an excellent and very thought-provoking new series of reports from RAND | SURPRISE The first of these reports begins with point near and dear to our hearts as forecasters: “The U.S. track record for predicting the future of warfare is notoriously poor. Robert Gates, U.S. Secretary of Defense from 2006 to 2011, famously quipped, “when it comes to predicting the nature and location of our next military engagements, since Vietnam, our record has been perfect. We have never once gotten it right, from the Mayaguez to Grenada, Panama, Somalia, the Balkans, Haiti, Kuwait, Iraq, and more—we had no idea a year before any of these missions that we would be so engaged” … “And yet, for better or worse, the U.S. military is deeply invested in the forecasting business because the services need to start building today what will be needed one or even two decades from now. Thus, the question becomes how to predict the future of warfare correctly.” This new series of reports “starts by exploring why the U.S. military so often fails to the predict the future correctly and finds that failed predictions cannot be chalked up simply to stupidity of individual leaders, ignorance of technology, or failure to identify trends. Rather, the failures stem from not thinking comprehensively about the factors that shape conflict and how these variables interact with one another” [another point near and dear to The Index Investor]. The RAND authors propose a methodology to address this problem by “first identifying the key three dozen or so geopolitical, economic, environmental, geographic, military, legal, and informational trends that will shape the future of warfare from now until 2030 and then aggregating them to paint a holistic picture of which countries the United States will fight with and against, where these conflicts will occur, what they might look like, how the United States will wage them, and when and why the United States might go to war in the first place” [great minds think alike…]. The RAND study concludes that. “the United States will confront a series of deepening strategic dilemmas when confronting warfare from now through 2030. U.S. adversaries—China, Russia, Iran, North Korea, and terrorist groups—likely will remain constant, but U.S. allies are liable to change as Europe becomes increasingly fragmented and inward-looking and as Asia reacts to the rise of China. “The locations where the United States is most likely to fight will not match where conflicts could be most dangerous to U.S. interests. “The joint force will face at least four diverse types of conflict, each requiring a somewhat different suite of capabilities, just as it confronts diminishing quantitative and qualitative military advantages. “Above all, perhaps, the United States of 2030 could progressively lose the capacity to dictate strategic outcomes and to shape when and why the wars of the future occur. “Ultimately, as the future of warfare places more demands on U.S. forces and pulls limited U.S. resources in opposite directions, the United States will face a grand strategic choice: It can break with the internationalist foreign policy that it has pursued since at least the end of the Cold War and become dramatically more selective about where, when, and why it commits forces. “Alternatively, it can double down on its commitments, knowing full well that doing so will come with significantly greater cost—in treasure and perhaps in blood.” |
| | |
| | |
| | |
| | |
| | |
| | |
| | |
| | |
| | |
| New Health and Disease Information: Indicators and Surprises | Why Is This Information Valuable? |
| “Analysis of hospital traffic and search engine data in Wuhan China indicates early disease activity in the Fall of 2019”, by Nsoesie et al | SURPRISE “Early investigations into SARS-CoV-2 emergence and the resulting COVID-19 disease outbreak proposed the proximate cause was a zoonotic spillover event in late November or early December 2019 in Wuhan, China… “However, recent evidence suggests that the virus may have already been circulating at the time of the outbreak. Here we use previously validated data streams - satellite imagery of hospital parking lots and Baidu search queries of disease related terms - to investigate this possibility. We observe an upward trend in hospital traffic and search volume beginning in late Summer and early Fall 2019. While queries of the respiratory symptom “cough” show seasonal fluctuations coinciding with yearly influenza seasons, “diarrhea” is a more COVID-19 specific symptom and only shows an association with the current epidemic. “The increase of both signals precedes the documented start of the COVID-19 pandemic in December.” |
| “Bounding the Predictive Values of COVID-19 Antibody Tests” by Charles F. Manski | SURPRISE “COVID-19 antibody tests have imperfect accuracy. There has been lack of clarity on the meaning of reported rates of false positives and false negatives. For risk assessment and clinical decision making, the rates of interest are the positive and negative predictive values of a test. “Positive predictive value (PPV) is the chance that a person who tests positive has been infected. Negative predictive value (NPV) is the chance that someone who tests negative has not been infected. The medical literature regularly reports different statistics, sensitivity and specificity. Sensitivity is the chance that an infected person receives a positive test result. Specificity is the chance that a non-infected person receives a negative result. Knowledge of sensitivity and specificity permits one to predict the test result given a person’s true infection status. “These predictions are not directly relevant to risk assessment or clinical decisions, where one knows a test result and wants to predict whether a person has been infected. “Given estimates of sensitivity and specificity, PPV and NPV can be derived if one knows the prevalence of the disease, the rate of illness in the population. PPV increases with prevalence, and NPV decreases… [However] there is still considerable uncertainty about the prevalence of COVID-19”… “The FDA estimates of PPV-NPV assuming that the population infection rate is 0.05 [5% of the population]. However this estimate is not well grounded”… Manski “addresses the problem of inference on the PPV and NPV of FDA approved COVID-19 antibody tests given estimates of their sensitivity and specificity and credible bounds on prevalence.” Manski finds that the very wide bounds on various estimates of population prevalence (from 1.7% to 61.8%) have a substantial impact on PPV and NPV. He concludes that, “COVID-19 antibody tests have imperfect accuracy…Persons receiving negative test results can be reasonably confident that they do not have antibodies to COVID-19. In contrast, the estimated bounds on PPV have widths ranging from about 40% to 70%, with even wider confidence intervals. The upper bounds are all near 100%. “The problem for risk assessment is that the lower bounds are quite low in magnitude, being 60.4%, 28.9%, and 55.9%. The lower bounds of the confidence intervals are considerably lower still. Thus, persons receiving positive test results should not be confident that they have antibodies to COVID-19.” |
| “COVID-19: in the footsteps of Ernest Shackleton”, by Ing et al | SURPRISE This paper shows why, in the absence of much wider testing, the presence of a high percentage of asymptomatic people infected with COVID-19 leads to a high current level of uncertainty about its population prevalence. “We describe what we believe is the first instance of complete COVID-19 testing of all passengers and crew on an isolated cruise ship during the current COVID-19 pandemic. Of the 217 passengers and crew on board, 128 tested positive for COVID-19 (59%). “Of the COVID-19-positive patients, 19% (24) were symptomatic; 6.2% (8) required medical evacuation; 3.1% (4) were intubated and ventilated; and the mortality was 0.8% (1). “The majority of COVID-19-positive patients were asymptomatic (81%, 104 patients). We conclude that the prevalence of COVID-19 on affected cruise ships is likely to be significantly underestimated.” |
| “Estimating the overdispersion in COVID-19 transmission using outbreak sizes outside China”, by Endo et al | This paper finds that control of superspreading events – which has been the focus of Japan’s efforts to combat the virus -- is critical to reducing population transmission of COVID-19. “Not all symptomatic cases of COVID-19 cause a secondary transmission, which was also estimated to be the case for past coronavirus outbreaks (SARS/MERS). “Finding high individual-level variation (i.e. overdispersion) in the distribution of the number of secondary transmissions, which can lead to so-called superspreading events, is crucial information for epidemic control”… It “suggests that most cases do not contribute to the expansion of the epidemic, which means that containment efforts that can prevent superspreading events have a disproportionate effect on the reduction of transmission.” |
| “Estimating Probabilities of Success of Vaccine and Other Anti-Infective Therapeutic Development Programs”, by Lo et al | SUPRRISE This new paper provides valuable base rate data for use in forecasting the probability that an effective SARS-CoV2 vaccine will be developed. “A key driver in biopharmaceutical investment decisions is the probability of success of a drug development program. We estimate the probabilities of success (PoSs) of clinical trials for vaccines and other anti-infective therapeutics using 43,414 unique triplets of clinical trial, drug, and disease between January 1, 2000, and January 7, 2020, yielding 2,544 vaccine programs and 6,829 nonvaccine programs targeting infectious diseases”… “The overall estimated PoS for an industry-sponsored vaccine program is 39.6%, and 16.3% for an industry-sponsored anti- infective therapeutic” … “Viruses involved in recent outbreaks—Middle East respiratory syndrome (MERS), severe acute respiratory syndrome (SARS), Ebola, and Zika—have had a combined total of only 45 nonvaccine development programs initiated over the past two decades, and no approved therapy to date.” |
| “Revealed: The Long Term Severe Effects of COVID-19 that Could Go On for Months”, by Georgina Hayes in The Telegraph See also, “Grief, Lockdown, and Coronavirus: A Looming Mental Health Crisis” by Emma Jacobs in the Financial Times | SARS-CoV2 is a new coronavirus, and it is becoming clear that we still have much to learn about its long-term physical and psychological effects on people who have had COVID-19 and survived, and/or are grieving for people who have died from it. Increasingly, we see reports like these in the Telegraph and FT, which describe a wide range of physical and mental health symptoms that are appearing months after coming down with COVID-19. This represents a significant uncertainty in many areas, from healthcare costs to reopening and people’s ongoing employment prospects. |
| “A Deadly Mosquito-Borne Illness Is Brewing in the Northeast” by Oscar Schwartz | SURPRISE Eastern equine encephalitis (EEE) virus is transmitted by mosquito bites and causes severe brain infection. The case fatality rate is around 40%. While EEE cases are still rare, the 2019 outbreak of EEE in the Northeast United States was one of the most severe on record. The author concludes that the number of people contracting EEE may increase in the future, as “today, the Northeast is among the fastest-warming regions in the United States, its milder winters and intense summers ever more conducive to abundant mosquito populations.” |
| | |
| | |
| | |
| | |
| New Social Information: Indicators and Surprises | Why Is This Information Valuable? |
| “Tribalism Comes for Pandemic Science”, by Yuval Levin | Levin provides a painfully accurate description of how political polarization and increasing ideological rigidity in the United States has corrupted our national capacity for thinking and acting in the face the high and fast evolving uncertainty created by the COVID-19 pandemic. “In this century, we have become accustomed to heated political debates that somehow avoid contact with reality. They involve genuine and important problems, but they are fought largely as posturing contests. Some are arguments over projected medium-term crises (like the federal debt, or climate change) which one party laments and the other ignores or denies — allowing each to assert its moral superiority while treating the other with contempt without paying any immediate price. “Some are struggles over cultural or national identity (like the immigration or gun control debates) and so often aren’t really about what partisans argue on the surface. Many are fabricated outrages that serve as pure tests of tribal loyalty… “The Covid-19 pandemic has tested our society in countless ways. From the health system to the school system, the economy, government, and family life, we have confronted some enormous and unfamiliar challenges. But many of these stresses are united by the need to constantly adapt to new information and evidence and accept that any knowledge we might have is only provisional. “This demands a kind of humble restraint — on the part of public health experts, political leaders, and the public at large — that our society now finds very hard to muster. “The virus is novel, so our understanding of what responding to it might require of us has had to be built on the fly. But the polarized culture war that pervades so much of our national life has made this kind of learning very difficult. “Views developed in response to provisional assessments of incomplete evidence quickly rigidify as they are transformed into tribal markers and then cultural weapons. Soon there are left-wing and right-wing views on whether to wear masks, whether particular drugs are effective, or how to think about social distancing. “New evidence is taken as an assault on these tribal commitments, and policy adjustments in response are seen as forms of surrender to the enemy. Every new piece of information gets filtered through partisan sieves, implicitly examined to see whose interest it serves, and then embraced or rejected on that basis.” |
| There is accumulating evidence from many sources that both the health and economic impacts of COVID-19 have been unevenly distributed across different groups (e.g., based on age, income, race, and gender), and are worsening existing inequalities. | This will likely further raise frustration and anger among many segments of society, which will inevitably seek various forms of political expression. |
| “America’s Hungry Turn to Foodbanks as Unemployment Rises” by Courtney Weaver in the Financial Times | “America’s food banks — charities across the country that provide donated food for the hungry — are being pressed into service as never before as unemployment surges during the coronavirus crisis and many working-class and middle-class families seek help for the first time. “Feeding America, the largest US hunger relief organisation, representing 200 food banks across the country, said it had experienced a 70 per cent increase in those seeking food assistance since the crisis began. Roughly 40 per cent of the people wanting food are first time visitors, it said. In April alone, the group said it served 433m meals.” |
| Millions of Americans are losing employer provided health insurance as temporary job furloughs are converting to permanent layoffs as companies shrink or go out of business. | If people go onto Medicaid (assuming their income and assets are low enough), states will be forced to bear much higher costs at a time when their revenues are sharply falling. This will put further pressure on other parts of state budgets. People who remain uninsured and seek treatment will either generate substantial costs for hospitals for “uncompensated care” (for which they will seek reimbursement from state budgets) and/or an increasing number of personal bankruptcies caused by unpayable health care bills. As Marshall Toplansky notes in “Rethinking the Social Safety Net”, COVID-19 is causing a system that was already under increasing pressure to rupture at multiple points. Going forward leaders will be faced with much louder demands for a wide range of improvements, covering not just healthcare, but also food, housing, and income security, and, potentially, lifetime learning/retraining to improve employability in a rapidly changing economy. In turn, that will create new pressures on governments’ budgets and existing revenue sources. |
| “Modigliani Meets Minsky: Inequality, Debt, and Financial Fragility in America, 1950-2016” by Bartscher et al | “The rising indebtedness of U.S. households is a much-debated phenomenon. The numbers are eye-catching. Between 1950 and the 2008 financial crisis, American household debt has grown fourfold relative to income. In 2010, the household debt-to-income ratio peaked at close to 120%, up from 30% at the end of World War II” …The underlying drivers of the process, however, remain controversial” … This paper “studies the secular increase in U.S. household debt and its relation to growing income inequality and financial fragility. We exploit a new household-level data set that covers the joint distributions of debt, income, and wealth in the United States over the past seven decades. “The data show that increased borrowing by middle-class families with low income growth played a central role in rising indebtedness. Debt-to-income ratios have risen most dramatically for households between the 50th and 90th percentiles of the income distribution. “While their income growth was low, middle-class families borrowed against the sizable housing wealth gains from rising home prices. Home equity borrowing accounts for about half of the increase in U.S. housing debt between the 1980s and 2007. The resulting debt increase made balance sheets more sensitive to income and house price fluctuations and turned the American middle class into the epicenter of growing financial fragility.” |
| “The Tendency for Interpersonal Victimhood: The Personality Construct and Its Consequences” by Gabay et al | SUPRRISE The authors “introduce a conceptualization of the Tendency for Interpersonal Victimhood (TIV), which [they] define as an enduring feeling that the self is a victim across different kinds of interpersonal relationships…TIV has four dimensions: need for recognition, moral elitism, lack of empathy, and rumination (a focus of attention on the symptoms of one's distress, and its possible causes and consequences rather than its possible solutions)” … “People who have a higher tendency for interpersonal victimhood feel victimized more often, more intensely, and for longer durations in interpersonal relations than do those who have a lower such tendency”… In this paper, the authors report the results of a “comprehensive set of eight studies, which develop a measure for this novel personality trait and examine its correlates, as well as its affective, cognitive, and behavioral consequences.” |
| On May 25, 2020, George Floyd, a 46-year-old black man, was killed in Minneapolis, Minnesota during an arrest for allegedly using a counterfeit bill. The arrest was filmed, and clearly showed that Floyd died because the arresting police officer (who was himself later arrested) deliberately used excessive force. After the video went viral, demonstrations erupted across the US (and later in other countries). Many of these peaceful demonstrations later turned violent, with widespread destruction of property and looting. And unlike the 1960s riots (or the 1992 Rodney King riot in Los Angeles), the 2020 riots spread to cities’ affluent neighborhoods. | Both from personal observation and the observations of others, the same three groups appeared to be involved in multiple cities: (1) a large, diverse crowd of peaceful demonstrators; (2) a much less diverse (and more white) crowd of what some have called “ANTIFA-types” that, as darkness fell and peaceful demonstrators went home, proceeded to destroy property and fight with the police; and (3) organized looters who took advantage of the chaos. Unfortunately, given the polarization of America’s media today, few people saw this full story; too many viewers focused on only part of it, which very likely reinforced previously existing beliefs. There is, obviously, considerable uncertainty about the long-term impact of these riots. One baseline is the riots of the 1960s, which led to flight from and worsening conditions in many cities. In recent decades, cities fortunes have improved, but most now have a “barbell” class structure, with a very small middle class. The key question is the extent to which COVID-19 and urban riots will now cause a significant percentage of the upper class that is so critical to cities’ economic health to abandon them (which working from home is now making much easier). A related uncertainty is how the progressive political leadership of many of the hardest hit cities will respond to the aftermath of the riots, and whether that will serve to accelerate their cities’ decline (e.g., see, “Cheering for Chaos”, by Seth Barron). A final uncertainty is the extent to which the demonstrations and riots were about something beyond anti-racism, and also reflected the intensifying economic and social frustrations of classes below the top 10% -- what some have called America’s rapidly growing “precariat.” To the extent this is the case, these pressures will almost certainly affect the outcome of the November election, and the evolution of politics in the coming years. For example, in “The New Geography of America, Post-Corona Virus”, Joel Kotkin forecasts that, “The new America emerging from this crisis clearly will not be dominated by woke, super-dense cities filled with renters and singles. Nor will it reprise the narrow, culturally conformist past of suburban and small-town America. Instead the future will be shaped largely by people and families seeking a more affordable, safe, and healthy environment across a broad spectrum of American communities. “They will likely support those who support their aspirations rather than indulge a never ending environment of ceaseless, and often pointless, political warfare.” See also: “American Civilization and Its Discontents”, by Matthew Continetti; “Hub City Riot Ninjas” by Michael Lind; and “The Rebellion of America’s New Underclass” by Joel Kotkin. |
| | |
| | |
| | |
| | |
| | |
| | |
| New Political Information: Indicators and Surprises | Why Is This Information Valuable? |
| “Not Public-Spirited” by Daniel DiSalvo | Demonstrations and riots following the death of George Floyd triggered widespread calls for police reform, and criticisms of police unions for blocking it. However, this forced recognition that police unions are just one part of a much larger problem. DiSalvo notes that, “The deeper problem is that unionization and collective bargaining have made it almost impossible to bring about meaningful reform of state and local government, policing included. The consequences are huge, because the inability to reform government means that performance suffers and public trust in key institutions declines.” |
| “Is the Left Trying to Get Trump Reelected?” asked Daniel McCarthy in the National Interest | “The protesters want nothing more than to see Trump defeated, of course. But for the last 15 years, American politics has seen new social movements rise in response to a presidential administration they oppose and fade away once a new president is elected. “Remember the antiwar movement of 2006? It didn’t survive the Obama administration. The Tea Party movement and its calls for restraint on government spending haven’t been a force since the election of Donald Trump. “And if Joe Biden wins in November, what are the odds that woke young Democrats will be protesting outside his White House the next time a black man dies in police custody? … “The demands of current protesters are classic instances of idealistic overreach with the potential to create nightmarish results once implemented. Like the Tea Party and the antiwar movement, the movement for a crackdown on cops is only plausible so long as there is no need to take responsibility for the inevitably imperfect policy solution. The real politics of war, spending, police reform, or, say, healthcare reform is messier than the ideals of protesters can ever accommodate… “Thus, if the protests wind up helping Trump come November, the president’s re-election may paradoxically be a godsend to the activist left as well.” |
| Already under fire for his handling of the COVID-19 crisis, Donald Trump’s response to the riots pushed his approval rating further down. Perhaps more important, it drew public rebukes from two widely respected former Chairmen of the Joint Chiefs of Staff, Admiral Mike Mullen and General Jim Mattis, for his use of active duty troops to clear protesters from Lafayette Square across from the White House, and threats to send troops into more US cities to confront demonstrators he described as “terrorists.” | SURPRISE Mattis wrote that, “Donald Trump is the first president in my lifetime who does not try to unite the American people—does not even pretend to try. Instead, he tries to divide us. We are witnessing the consequences of three years of this deliberate effort. We are witnessing the consequences of three years without mature leadership. We can unite without him, drawing on the strengths inherent in our civil society. This will not be easy, as the past few days have shown, but we owe it to our fellow citizens; to past generations that bled to defend our promise; and to our children.” How these statements will affect support for Trump among his voting base (which is generally pro-military) remains to be seen. It is also uncertain how these high profile rebukes from senior military officers will affect other Republicans, both in Congress and the Administration. Another excellent article, “History Will Judge the Complict” by Anne Appleabaum, goes into great detail about the subtle and unsubtle ways many of them have compromised their previous values since Trump became president, and how they have remained painfully silent despite the growing chaos in the White House. As Applebaum writes, “at some point, after all, the calculus of conformism will begin to shift. It will become awkward and uncomfortable to continue supporting “Trump First,” especially as Americans suffer from the worst recession in living memory and die from the coronavirus in numbers higher than in much of the rest of the world.” |
| “Democracy on the Defensive in Trump’s America” by Mingels et al in Der Spiegel | SURPRISE Der Spiegel highlights growing authoritarian tendencies on the part of president Trump that represent another potential source of an uncertainty surprise over the coming months. “Coronavirus, economic collapse and now mass demonstrations for racial equality: The United States is facing a trio of deep crises. Instead of offering leadership, President Donald Trump is exacerbating divisions and showing authoritarian tendencies. “With the presidential election still several months away, the country's health is at stake… “Should we be worried about the United States? Is a fundamental shift taking place in a country that is synonymous with deeply rooted democracy? “The current chaos on the streets of America isn't just the product of the country’s economic and societal tensions. The president himself has repeatedly exacerbated those conflicts with his rhetoric. Trump, it seems, needs the chaos. He feeds off it. “Few other democratically elected leaders have as much power as the U.S. president, a reality that can lead to abuse. Trump has made personal loyalty the most important qualification for those with whom he surrounds himself. He harbors deep admiration for Russian President Vladimir Putin and once voiced his support for the violent crushing of the pro-democracy protests on Beijing's Tiananmen Square, saying it was a sign of strength… “The Russia investigation and his impeachment did not show him the limits of his power, and instead awakened in him a desire to hit back hard and to get rid of anyone within government who does not fulfill his every whim. In the waning months of his first term in office, just a few months before Election Day, he is increasingly putting his authoritarian tendencies on full display.” The Der Spiegel article concludes with a review of concern that Trump may either try to disrupt the November election, or, if he loses, won’t voluntarily concede defeat and vacate the presidency. As Ed Luce notes in the Financial Times, “Mr Trump has a burning desire to be re-elected. In his mind defeat would lead to the dismantlement of the Trump Organization and his prosecution and possible imprisonment. “Faced with a choice between sabotaging American democracy or a future spent in and out of courtrooms, I have no doubt where Mr. Trump’s instincts would lie. It would be up to others to stop him” (“How Things Could Go Very Wrong in America”). |
| | |
| | |
| | |
| | |
| | |
| | |
| | |
| | |
| | |
| New Financial Markets and Investor Behavior: Indicators and Surprises | Why Is This Information Valuable? |
| “An Inconvenient Fact: Private Equity Returns and the Billionaire Factors” by Ludovic Phalippou | SURPRISE In this explosive new paper, Phalippou painfully reminds readers about the critical difference between value creation and value capture. In doing so he also raises fundamental questions about whether the decades long growth in private equity investment is sustainable for much longer. “As of the end of 2019 (i.e., right before Covid-19), since at least 2006, net of fees performance of PE funds matched that of public equity markets.6 Despite this lack of clear outperformance, the fee structures are such that a few individuals shared a large performance-related bonus payment, known as Carry, which added up to $230bn for funds raised over the decade 2006-2015 (these are the most recently raised funds that terminated (or were close to terminating) their investment period as of 2019 year-end). “It is widely believed that the providers of capital should gladly pay Carry to fund managers because it means that returns have been good. A first caveat is that Carry works only in one direction. Hence, an investor may end up paying Carry to some managers even if its overall PE portfolio performed poorly. “Second, Carry is paid as a fraction of absolute performance, rather than relative performance. Hence, although the latest decade of funds that terminated their investment period (2006-2015 vintages) returned about the same as public equity benchmarks (about 11% p.a.), their managers still received $230bn of Carry, alongside a lot of other fees. “Most of this money went to a relatively few individuals, mostly founders of large PE firms. I find that the number of PE multibillionaires rose from 3 in 2005 to 22 in 2020, and are mostly affiliated to large PE firms… “Large pension funds have earned about $1.5 (net of fees) per $1 invested in PE funds (both since 2006, and since inception). At least since 2006, this return has been the same as what public equity has returned.” Phalippou notes that, “this wealth transfer might be one of the largest in the history of modern finance: from a few hundred million pension scheme members (plus Endowments, Sovereign Wealth Funds, Family offices, etc.) to a few thousand people working in private equity.” Pointedly, he asks, “How could this be an economic equilibrium?” “Why are trustees, investment teams, external managers, consultants, and others not seeing through this? Maybe because their livelihood depends on them not seeing it. Net-of-fee performance of PE funds being superior to that of public equity is the sine qua non condition for continued employment of at least 100,000 people. “The importance of this condition might explain why the mantra of ‘PE outperforms’ has for many people, who work in and around PE, become a quasi-religious article of faith. Merely to question it is considered heresy: either you believe and you are one of us, or you question the existence of outperformance and you are an enemy. The level of emotion generated by the mere questioning of PE outperformance is, in my experience, second to none in the financial industry. “In addition, many individuals want to avoid embarrassment; think of a pension fund board admitting paying billions of Carry in order to achieve the same returns as public equity markets.” |
| “Advisors Rank Almost As Low As Mechanics on Trustworthiness” by Asia Martin | “Investors trust financial advisors about as much as they trust mechanics, according to the CFA Institute’s annual report “Earning Investors’ Trust: How the Desire for Information, Innovation, and Influence Is Shaping Client Relationships.” “Advisors ranked fourth out of six types of professionals when investors were asked which they consider to be more trustworthy. “Nearly a third (32%) of investors ranked advisors last or second to last for trustworthiness; 46% placed advisors in the third or fourth spot; and just 23% put them at the top of their list. “Mechanics were ranked lower than advisors, but not by much. Politicians had the worst ranking, with 83% of investors giving them low trust scores.” “The study also found that nearly three out of four (73%) participants preferred human advisors over robos, which hasn’t changed since 2018.” |
| | |
| | |
| | |
| | |
| | |
| | |
System Tipping Points/Critical Threshold Analysis
Like Professors Andrew Lo, Doyne Farmer and others, we regard financial markets as a complex adaptive system (CAS), that exist as part of a larger macro system comprised of other CAS between which there are multiple feedback loops. These other systems include those that produce technology innovations, and economic, environmental, national security (including cyber), social, demographic, and political outcomes.
We also find that these systems tend to operate and generate effects in a rough chronological sequence, albeit with many feedback loops between them. The following chart highlights that the changes we observe in different areas at any point in time are actually part of a much more complex evolutionary process.
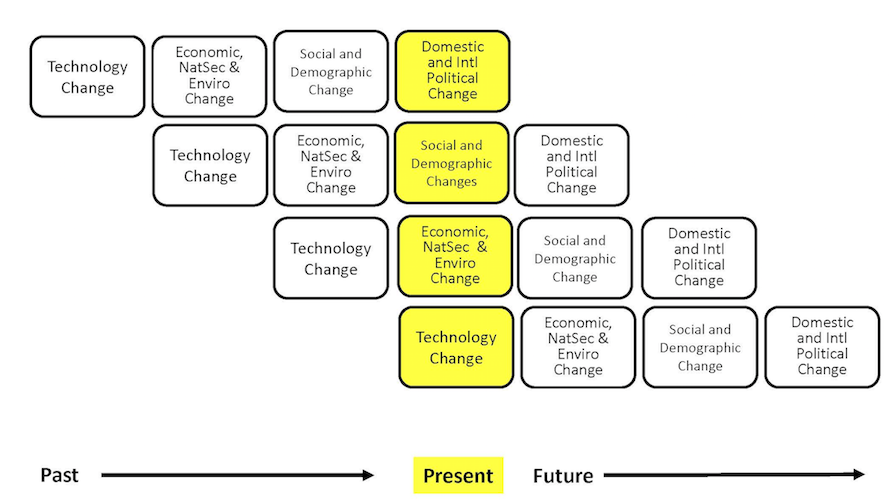
While most media coverage of these systems focused on flows (e.g., the size of the government deficit), rapid non-linear change in complex adaptive systems is often caused by a key stock (e.g., the amount of outstanding government debt) exceeding a critical threshold.
The next table highlights the key macro system stocks that we monitor.
In the next section, we will discuss information received over the past month that is related to these stocks, and which we believe is significant to our assessment of the probabilities that a critical threshold will be reached and a regime change will occur. We will conclude with our estimate, at the end of this month, of how close the macro system is to these critical thresholds, and the implications for financial market regime change probabilities.
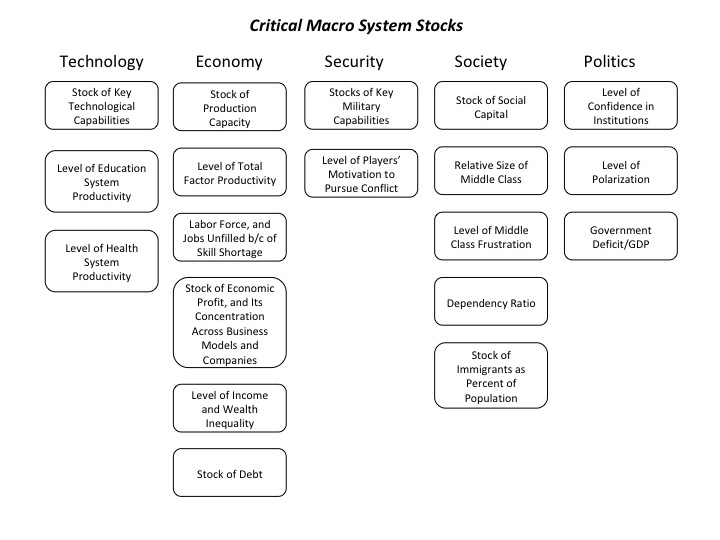
How Close is the Macro System to One or More Critical Thresholds?
As we have noted, the macro drivers of financial market regime changes typically follow a rough chronological sequence, from technology to economic, security, social, and political causes and effects. Yet there are many feedbacks loops between them, creating complex root causes for many of the critical thresholds we have identified.
Understanding the time dynamics in this complex system is critical to avoiding substantial downside investment risk.
We use the UK Met Office Warning Model to communicate our assessment of these time dynamics. We estimate the time remaining before a critical macro system threshold is reached that could trigger a regime change, which is usually accompanied by substantial changes in asset class valuations.
The model uses three increasingly serious levels of warning, from “Be Aware” (condition yellow), to “Be Prepared” (condition orange), to “Take Action” (condition red).
For our purposes, we denote as “Be Aware” (yellow) critical thresholds that we assess to be three or more years away. We estimate that “Be Prepared” (orange) thresholds could be reached within 1 to 3 years. “Take Action” thresholds are very likely to be reached within one year.
Given their nature, we also note that in our three “wildcard” areas (Environment and Energy related; Disease and Human Caused Bioevents; and Cyber and Electromagnetic Events), our forecasts have higher levels of uncertainty.
The following charts summarize our current estimate of the time remaining before different critical thresholds will be reached.
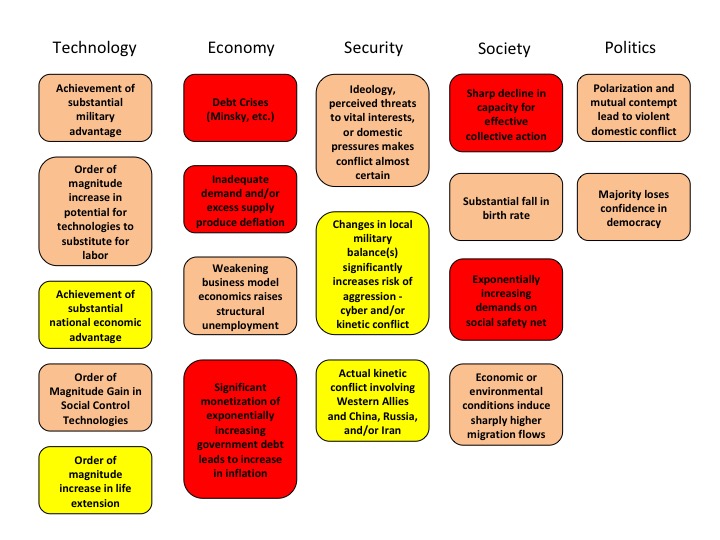
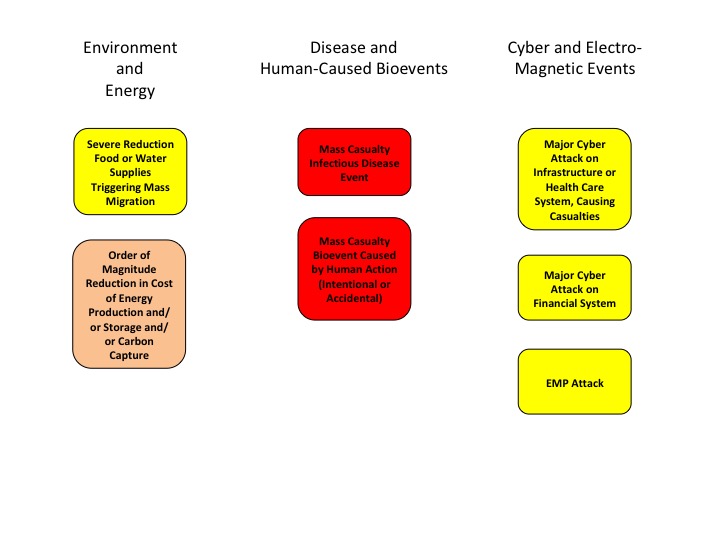
At the highest level, we believe the complex adaptive global macro system can be in one of four states, based on its degree of order versus disorder, and degree of social cooperation versus conflict. A very coarse-grained reading of history suggests that these states evolve in a predictable cycle, from ordered/cooperative, to disordered/cooperative, to disordered/conflicted, to ordered/conflicted.
We believe that the system is currently in its most uncertain state, characterized by high degrees of underlying disorder and social conflict, both domestically and internationally. Beyond some point, intensifying conflict eventually increases the degree of order in the system. That appears to be happening now, via the increasing conflict between China, Russia, and Iran and the United States and other Western nations.
If you have any questions about anything we have written in this issue, please don’t hesitate to get in touch, at contact@indexinvestor.com
Appendix: Anticipatory Thinking and Forecasting Methodologies
Our process is based on methods and tools developed over the past seven years at our affiliate, Britten Coyne Partners, which provides consulting services and education courses to executive teams and boards on strategic risk governance and management.
At The Index Investor, we engage in both anticipatory thinking to identify what could happen (e.g., different macro regimes and related events), and forecasting, to estimate the probability that events and regimes will happen, and the impact they will have if they do (e.g., on macro variables and broad asset class returns).
With respect to what could happen, we are acutely conscious of the conclusion reached by a 1983 CIA study of failed forecasts: "each involved historical discontinuity, and, in the early stages…unlikely outcomes. The basic problem was…situations in which trend continuity and precedent were of marginal, if not counterproductive value."
When it comes to forecasting, we know that in complex socio-technical systems that are constantly evolving, the accuracy of statistical or machine learning based forecasting methods declines exponentially as the time horizon lengthens, since the historical data set on which they were trained will (depending on the speed and effectiveness of any retraining cycle) bear less and less resemblance to the distribution of outcomes the system is likely to produce in the future.
Under these circumstances, forecast accuracy over longer time horizons depends on causal and counterfactual reasoning about the possible future effects of multiple interacting trends and uncertainties that are hard to quantify.
And we are acutely aware of the economist Rudi Dornbusch's famous warning: "Crises take a much longer time coming than you think, then happen much faster than you would have thought."
Our forecasting process also draws on lessons Tom Coyne learned from spending four years as a member of the Good Judgment Project team, which won the Intelligence Advanced Research Projects Activity’s forecasting tournament with forecast accuracy that was more than 50% better than the tournament's control groups (the team's experience is described in Professor Philip Tetlock's book, “Superforecasting").
Our analysis focuses on the probability of the global macro system being in four possible macro regimes 12 and 36 months from the date of our forecast: (1) Normal Times, where equity asset classes perform well; (2) a High Uncertainty regime that is usually short and transitory, where asset classes like short-term government bonds perform best and equities suffer significant declines; (3) High Inflation (which we deem 5% or more, year-on-year), where commercial property, real return bonds and other traditional hedges are favored; and (4) Persistent Deflation (a year-on-year decline in the US CPI), which up to now has only been seen in Japan, and in which the relative performance of different asset classes remains uncertain, but will likely favor high quality bonds and the consumer staples equity sector.
In response to subscriber requests, we have added a 36-month regime forecast to our existing 12 month forecast. The logic is that, in a complex evolving system like global macro, a longer forecast horizon gets beyond the “detection range” of algorithmic forecasting approaches, and therefore raises probability that a manager/investor can gain an edge in identifying emerging threats and opportunities.
That said, because evolving (i.e., “non-stationary”) complex systems populated by highly connected human agents are also capable of sudden non-linear changes (with which are hard for algorithmic approaches to predict), we are also keeping our 12 month forecast.
Our forecasting methodology starts with base rate/reference case data about the historical probability of large changes in equity and bond valuations. We then analyze the current situation from both a quantitative and qualitative perspective. In the latter, we focus on the key endogenous drivers of macro regime change, including technological, economic, national security, social, and political trends and uncertainties. We also focus on three potential sources of exogenous shocks that could also produce a macro regime change, caused by environmental, disease, and cyber related events.
While most of our attention typically focuses on various flows (e.g., economic growth, change in the price level, sales, earnings, job creation, etc.), endogenously caused regime changes result when those flows push key stocks beyond a critical threshold or tipping point, often setting off non-linear reactions across multiple areas. As noted by Hyman Minsky and others, a classic example is the steady accumulation of outstanding debt until it reaches the point where it can no longer be serviced and triggers a crisis.
Base Rate Data
Since the end of World War Two, there have been fifteen months where a downturn in the US equity market began that eventually reduced asset class value by 20% of more. That is a hazard rate of about 1.75% per month. Put differently, in any given month there is a 98.25% probability that a 20%+ downturn won’t occur, or, in a given year, an 81% probability.
However, as the time without a 20%+ downturn extends, the compound probability that one will not occur shrinks. At the end of August 2018, it is more than nine years since the last equity market decline of 20% or more. The probability of that happening is only 15%.
To estimate the base rate for a 20% fall in bond prices (which historically has been caused by a sharp increase in inflation, as we saw in the late 1970s and early 1980s), we analyzed monthly historical AAA bond yields since 1919. For consistency, we used them to calculate the price of a ten-year zero coupon bond. We then calculated the probability of a price decline of 20% or more over three different holding periods: 12, 18, and 24 months. In any month, the annualized probability of a decline of 20% or more over the subsequent 12 months is 12%; over 18 months, 20%, and over 24 months, 25%.
Market Stress Indicators Methodology
We view financial markets as a complex adaptive system. The size of changes generated by such a system follows a power law rather than a normal (Gaussian) distribution. The critical point is that large changes are much more common in complex adaptive systems than most people’s intuition leads them to believe.
While predicting the behavior of complex adaptive systems remains far more art than a science, various researchers have found that large changes in such systems are often preceded by subtle warning signs, as stress accumulates within them. While this research is not definitive, we believe that five warning signs are worth monitoring as potential indicators of growing stress within financial markets that could suddenly give rise to large changes in asset class valuations.
Our first indicator is the month-to-month autocorrelation of broad asset class returns (i.e., the relationship of this month’s returns to last month’s). A system under increasing stress loses resiliency, causing it to take longer to recover from perturbations; hence, autocorrelation increases as it approaches a critical transition (see, “Early Warning Signals for Critical Transitions” by Scheffer, et al).
The second market stress indicator we monitor is the Economic Policy Uncertainty Index published by the Federal Reserve Bank of St. Louis (via its FRED economic database), which is based on research by Baker, Bloom, and Davis (see their paper, “Measuring Economic Policy Uncertainty”). The index is based on automated text analysis of leading newspapers and magazine publications, to identify the frequency with which words and phrases are used that indicate uncertainty.
In humans’ evolutionary past, when uncertainty increased the probability of survival was enhanced by staying close to a group. All of us still have that instinct. Research has found that as uncertainty increases, we have an unconscious bias towards higher conformity of our own views with those of a larger group (i.e., reduction in cognitive diversity). Behaviorally, heightened uncertainty induces more “social copying” of others, likely due to both conformity bias and the rational belief that others may be acting on the basis of superior information. This increase in conformity and copying makes a social system more ordered as uncertainty increases, and also reduces its responsiveness to perturbations (i.e., increases autocorrelation) because of delays in the social copying process.
The key point is that increasing uncertainty induces more, not less order in social systems, and in so doing primes them for sudden non-linear change.
Our third market stress indicator is the spread between the yield on AAA rated bonds and the 10-year US Treasury. This is a proxy for the level of investor concern about financial system funding liquidity.
Our fourth market stress indicator is the yield spread between speculative BB rated bonds and the ten-year US Treasury. Throughout history, excessive credit growth has been a root cause of many financial crises. An indicator of such growth is falling credit spreads, particularly in the case of riskier borrowers. In contrast, rising BB spreads indicate growing investor concern about the consequences of such growth, and the financial distress lower rated companies could experience in an economic downturn.
Our fifth market stress indicator is what we term the “political risk premium” that is implicit in the price of gold. Our starting point for estimating this premium is the three different roles that gold plays. First, gold is a store of value in a world of fiat currencies. When the rate of money supply growth exceeds the growth of nominal GDP, gold’s price should increase to maintain its purchasing power. Between 2007 and 2017, the US money supply (M2) grew by about 86%, while nominal US GDP grew by 35%. The stock of gold grew by 18%, based on mine production over this period. We therefore infer that 33% of the increase in the price of gold represented the maximum potential gold price change that could be attributed to a desire to hedge inflation risk (86% less 35% less 18%).
Second, gold is a unit of account. We take this to mean that the annual change in GDP expressed in terms of physical gold (i.e., nominal GDP divided by the price of gold) should equal the change in real GDP calculated using the GDP price deflator to account for actual inflation over the period. A key challenge is the point at which to start this calculation.
We chose the price of gold in 1995/1996. In that period, the change in real global GDP measured using the IMF’s price deflator just about equaled the change in GDP measured in terms of physical gold. We interpret that coincidence as indicating that at that point in time, concerns about future inflation and political risk were minimal, and the change in the price of gold was mostly driven by its role as a unit of account. We calculated a subsequent series of gold prices that would produce the same change in “gold GDP” as the actual real GDP as calculated by the IMF. Between 2007 and 2017, “gold as a unit of account” warranted a 21% increase in its price.
Gold’s third role is as a hedge against inflation and what we term “political disaster” risk. We subtract the 21% estimated compensation for actual inflation from the 33% “gross” inflation risk hedge to derive an apparent 12% increase in the gold price that reflected the true risk premium to hedge against possible future inflation. However, between 2007 and 2017 the price of gold actually increased by 81%. This implies that 48% of this (81% less 21% less 12%) represented a premium for some other type of uncertainty at the end of 2017. The interesting question is the nature of the uncertainty for which gold is believed by some investors to be a superior hedge than traditional ports in a storm like short-term US government securities, or similar securities issued by other developed countries.
The logical inference is that the uncertainty in question must reflect a situation in which short term US Treasuries would be a less effective hedge than gold. This could be a world of widespread hyperinflation, capital controls, and/or radical changes in nations’ governments (of course, this would also imply a preference for investing in gold coins rather than bullion, as while the latter may be a store of value, it is far less convenient as a means of paying for transactions).
To put this in further perspective, this gold price “disaster risk” premium sharply increased from 2008 to 2012, then declined before sharply increasing again after 2016. Arguably, a significant part of the former increase reflects concerns about the potential inflationary consequences of dramatic quantitative easing by central banks. But this is not likely to be the case after 2016.