The Index Investor
January 2021
Recent Quantitative Indicators
Tactical Asset Allocation Implications of Our Forecasts
Forecast Pre-Mortem Analysis
Combining and Extremizing Forecasts to Improve Predictive Accuracy
Feature Article: Annual Update to Our Detailed Three Year Macro Regime Forecast (Downloadable Slide Deck)
High Value Information Observed Last Month:
- Technology
- Energy and Environment
- Health and Disease
- Economy
- National Security
- Society
- Politics
- Financial Markets and Investor Behavior
Critical System Thresholds/Tipping Points Analysis
Appendix: Anticipatory Thinking and Forecasting Methodologies
Current Macro Forecast
Sky-high valuations in many asset classes suggest two competing hypotheses. The first is that we are in the middle of, as Jeremy Grantham recently claimed, one of the greatest bubbles of the modern era (see his latest letter to GMO investors, “Waiting for the Last Dance”).
The second hypothesis is that we are heading into a new version of “the Roaring Twenties” (i.e., the Normal Macro Regime) that will justify today’s valuations.
In 1739, the British philosopher David Hume asserted what has subsequently become known as “the problem of induction” – no amount of evidence can ever prove that an inductive inference (i.e., a generalization from evidence) is true. However, in 1959 the philosopher of science Karl Popper published his doctrine of falsification, noting that while evidence cannot be used to prove a hypothesis is true, it can be used to prove that it is false.
It is in that spirit that we will present evidence that refutes the hypothesis that we are once again entering “the Roaring Twenties.”
Too many people seem to forget that the 1920s didn’t roar around the world. Rather, it was a particularly American phenomenon, and even there its benefits were unequally distributed. For examples, agriculture (which accounted for 18% of GDP at the start of the decade) struggled throughout the decade, as European agricultural production and global trade recovered after the Fist World War.
Following the end of the war, and during the last wave of the Spanish Flu pandemic, the US stock market had fallen by more than 32% in 1920, to a record low valuation at the start of the decade. The sharp growth in valuations that followed (which supported a consumption boom) was in no small part aided by a sharp expansion of in margin lending by stockbrokers.
Growth in US consumer spending during the 1920s also benefited from both substantial income tax cuts following the end of the war (the top income tax rate was reduced from 73% to 24%) and deflation (due to the substantial increase in productive capacity) – in 1920 the consumer price index began the decade at 20.0 and declined to 16.7 by 1930.
In Europe, the 1920s roared, alright, but not in a good way. In Russia, the 1917 Bolshevik Revolution was followed by civil war, famine, the death of Lenin in 1924 and then Stalin’s bloody rise to power. Germany was burdened by war reparations, which led to hyperinflation and increasing political conflicts between left and right wing forces as the Weimar Republic headed towards collapse. Italy saw the rise Benito Mussolini and his National Fascist Party. In the United Kingdom, return to the gold standard at too high an exchange rate led to weak growth, deflation, widespread strikes, and the Labour Party displacing the Liberal Party as the main opposition to the Conservatives.
Contrast the conditions described above to those prevailing at the alleged start of the new Roaring Twenties. Asset class valuations were already high in December 2019 before COVID arrived, and after a sharp downturn in March 2020 they had largely regained their December 2019 levels by July 2021. Moreover, for the most part this was due to sharp falls in interest rates due to banks’ aggressive monetary policies. A relatively small number of companies (primarily in the technology sector) saw substantial gains in revenues and free cash flow in 2020; as a result, the increase in overall equity market valuation was mostly driven by a small number of companies. Similar dynamics could be seen in credit markets, where new issues (apart from special government support programs) were limited to the largest companies.
In sum, it is easy to argue that today’s valuations fundamentally rest on the twin assumptions that interest rates will not increase, and that significant growth in cash flow (or at least the value of revenue growth options) lies ahead. Particularly the latter, as rates can’t go much deeper into negative territory without severely squeezing bank profits at a time when the size of the coming solvency crisis remains highly uncertain.
The problem is the number of substantial obstacles that must be overcome in order for the Normal Regime to return. To cite just a few:
* It is not clear how soon the COVID pandemic will be conquered, given slow vaccinations and the rate at which the SARS-CoV-2 virus continues to evolve. In the short-term, this substantially depressed demand. Even in the medium term, behavioral changes (e.g., reduced desire to travel, eat in restaurants, or go to large public entertainment events), and the long-term health effects of COVID may permanently depress consumption spending and raise precautionary savings.
* As people live longer but have fewer children, the working age population is declining, which weakens demand.
* Debt levels are high and constrain investment, particularly in the non-financial corporate sector, which weakens demand.
* Unfunded liabilities of public sector defined benefit plans are also at record levels ($4.5 trillion), even after the equity market boom. It is becoming increasingly clear that at some point they will have to be restructured, which, as we can see today in Illinois, will lead to higher levels of political conflict and uncertainty – both of which will depress demand.
* Improvements in education results have fallen behind the rate at which artificial intelligence and automation technologies are improving. As a result, there is a war for scarce talent that limits the rate at which companies can invest in new technologies. This holds down productivity growth, which is critical to offsetting the negative impact on demand from a shrinking workforce.
* The war for talent contributes to growing inequality, which weakens demand growth. So too does the financializatoin of the economy (which boosts financial sector incomes), use of regulation to boost profits in certain industries (e.g., healthcare), and winner-take-all economics in a growing number of other industries.
* Increasing uncertainty about information integrity and cybersecurity threats may slow the growth of the digital economy.
* Speeded up regulatory efforts to reduce the use of fossil fuels may raise household and corporate energy costs, and reduce spending in other areas.
* Worsening conflict with China will very likely disrupt supply chains and/or raise input costs, which will depress demand.
* Worsening social and political conflict will likely raise uncertainty, which will depress demand.
* It is one thing to claim that some of these obstacles will be overcome. Unfortunately, the Roaring Twenties hypothesis relies on most or all of them being overcome. And that seems very unlikely.
* A final obstacle that is not widely acknowledged, are the gender dynamics at work in a transforming economy. Consider the following table, which is based on selected recent data about the structure of the US economy:
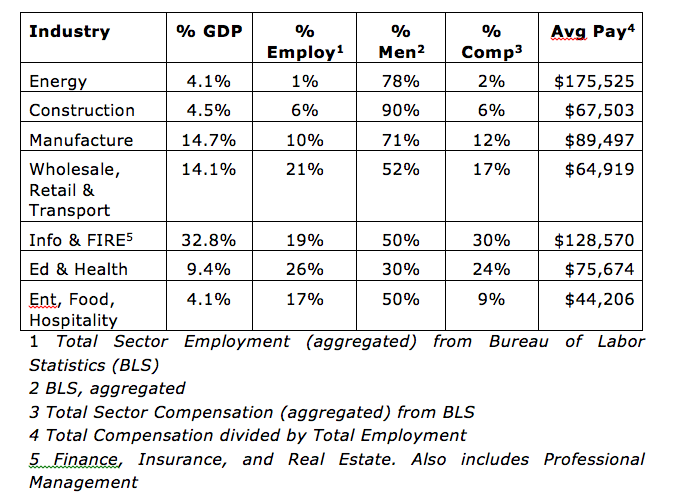
As you can see, the industry sectors most likely to lose employment as the structure of the economy changes are those where men represent a high share of total employment. In contrast, those sectors where demand is likely to grow in future years have historically had a high percentage of female employees.
On top of that, jobs in the sectors likely to lose employees have historically been better paid (on average) than those in the sectors where employment demand is likely to grow.
The information sector is an exception – however, it has significant knowledge and skill requirements. And there is little evidence that midlife reskilling has, up to now, facilitated smooth transitions from other sectors into the digital economy.
In sum, the accelerating transformation of the economy is unlikely to get smoother; rather, it will almost certainly worsen existing social and political conflicts. And this will almost certainly further worsen inequality, intensify social and political conflict, and raise uncertainty, all of which will further depress demand.
In sum, the weight of evidence almost certainly falsifies the hypothesis that current asset class valuations are solidly based on the coming return to a second “Roaring Twenties” economy. Instead, Jeremy Grantham is almost certainly right – we are in the middle of very large set of interrelated and interacting bubbles that will eventually deflate – probably suddenly and violently.
When this correction will occur and what will trigger it are both impossible to predict. When stresses on a complex adaptive system are high, relatively small changes can and often produced extremely non-linear effects.
This Month’s Regime Forecasts
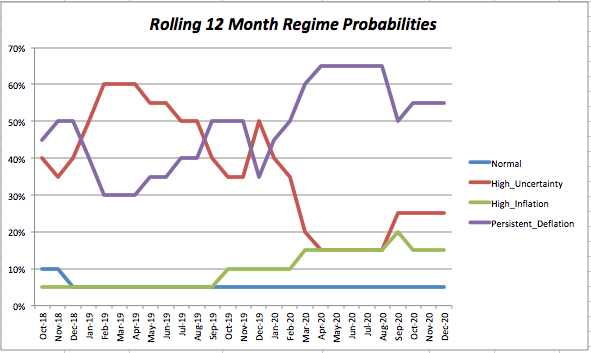
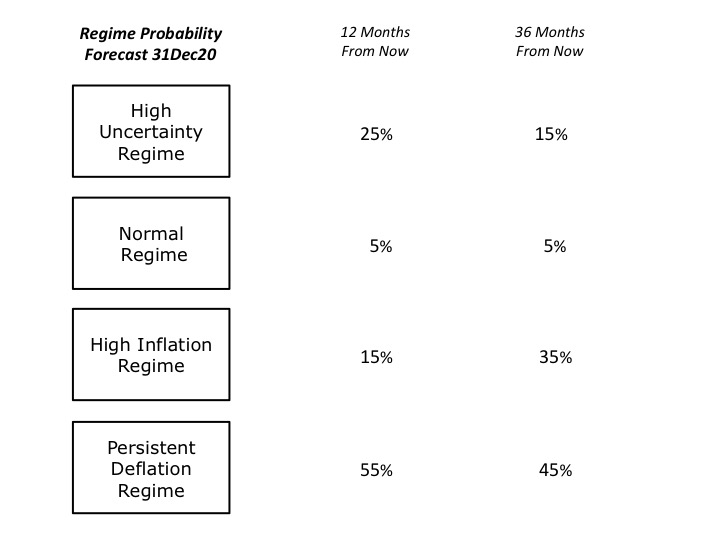
Our 12-month regime forecast probabilities did not change this month. The estimated probability of the Persistent Deflation Regime is still 55%. The probability of being in the High Uncertainty Regime remained at 25%. The probability of the High Inflation Regime is 15%. And the estimated probability of being in the Normal Regime remained unchanged at 5%.
The only change to our 36-month time horizon forecast is an increase in the probability of the High Inflation Regime from 30% to 35%, and a decrease in the probability of the Persistent Deflation Regime from 50% to 45%. The probability of being in the High Uncertainty Regime remains 15%, and the probability of being in the Normal Regime remains 5%.
To be sure, there were new pieces of high value evidence and surprises this month. But they tended to offset each other. For example, new and much more transmissible variants of the SARS-CoV-2 virus continued to spread; however vaccination rates also increased, and there were early indications that current vaccines still provided protection against the virus.
Similarly, while the attack on the US Capitol was a surprise that highlighted the depth of alienation, social conflict, and political polarization in the United States, by disgracing right wing populists it (along with the election of two Democratic senators in the Georgia special election) arguably strengthened centrists, which could lead to enactment of policies that address the root causes of left and right populism.
In assessing the current situation, we again emphasize that uncertainty remains very high. Under these conditions, people rely more heavily on social learning and copying what others are doing than they do on their own private information and views.
This not only slows the diffusion of new information throughout social systems like economies and financial markets, but also causes these systems to coalesce around a small number of narratives. However, as tension increases on various fault lines in the system, the dominant narrative or narrative grows increasingly fragile.
Under these conditions, rapid, non-linear changes are very likely to occur, that are out of proportion to the apparent trigger that sets them off.
Forecast Logic: Quantitative Indicators
Implications of the Most Recent Three Month Asset Class Returns
Our forecasting methodology also includes quantitative analyses of asset class valuations, market stress indicators, and the level and change in three-month returns, over the most recent and previous three-month periods, for those asset classes, which should perform best under different regimes (in this sense, our regimes can be regarded as macro factors).
We assume that that the rolling three month returns reflect investors’ views regarding the relative probability that a given macro regime will develop in the future.
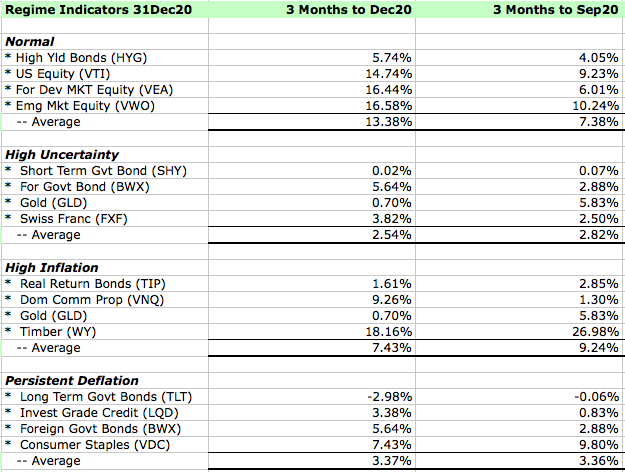
At the end of last month, rolling three-month returns on different asset classes implied that the dominant investor narrative has shifted away from reflation, and to the return of the Normal Regime. As noted above, we very strongly disagree with this view.
Asset Class Valuation and Momentum Indicators (@31Dec20)
| Asset Class (ETF) | Valuation | 1 Month Return | Conclusion |
| US Real Return Govt Bond (TIP) | Almost Certainly Overpriced* | 1.10% | Increasing Overvaluation |
| US Nom Return Govt Bond (GOVT) | Likely Overpriced* | (0.78%) | Decreasing Overvaluation |
| US Investment Grade Credit (LQD) | Within Fairly Priced Range* | 0.15% | Fairly Valued |
| US High Yield Credit (HYG) | Almost Certainly Overpriced* | 1.95% | Increasing Overvaluation |
| US Commercial Property (VNQ) | Within Fairly Priced Range* | 2.70% | Fairly Valued |
| US Equity (VTI) | Almost Certainly Overpriced* | 4.67% | Increasing Overvaluation |
| Foreign Devel Mkt Equity (VEA) | Likely Overpriced* | 5.62% | Increasing Overvaluation |
| Emerging Markets Equity (VWO) | Almost Certainly Overpriced* | 5.99% | Increasing Overvaluation |
| Timber (WY) | Top of Fairly Priced Range | 16.05% | Fairly Valued |
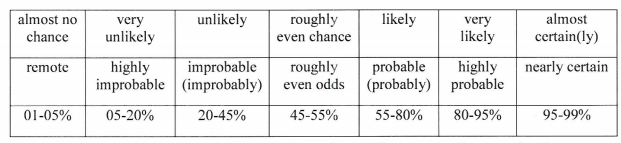
Note: The language we use to describe our estimated likelihood of asset class over or undervaluation is based on US Intelligence Community Directive 203 on Analytic Standards, which includes the following table:
Market Stress Indicators (@31Dec20)
| Market Stress Indicator | This Month vs Last Month |
| Asset Class Returns Autocorrelation (this month versus last month). Higher autocorrelation is an indicator of more tightly coupled and fragile markets. | .30 versus .54 the previous month. This indicates a decrease in the level of market stress. |
| Economic Policy Uncertainty Index (how many days over the last 30 was index in top quartile of values since 1985?). A higher number equals more market stress. | On 29 days last month the index was in the top quartile of daily values since 1985 (the 99th percentile of all rolling 30-day periods), the same as last month. |
| AAA Rated Bonds Spread over 10 Year Treasury Yield (month end). Higher spreads indicate rising concern about market liquidity. | 1.30% (51st percentile since 1983), versus 1.34% (55th) at the end of the previous month, indicating a decreasing level of market stress. |
| BB Rated Bonds Spread over 10 Year Treasury Yield (month end). High spreads indicate increasing credit risk. | 2.79%, (37thth percentile) down from 3.08% (45th) last month, indicating a decreasing level of stress. Given our Regime forecast, this is almost certainly inadequate compensation for the risk being taken with BB rated bonds. |
| Gold Price per Ounce in US Dollars (month end). Rising gold prices are an indicator of increasing market uncertainty and stress. | $1,891 versus $1,772, up 6.7%from the previous month. At the end of 2017, we estimated the “disaster premium” in the gold price was 47% (see our methodology in the Appendix). At the end of last month it was 93%, up from 84% the previous month. |
Portfolio Allocation Implications of Our Forecast
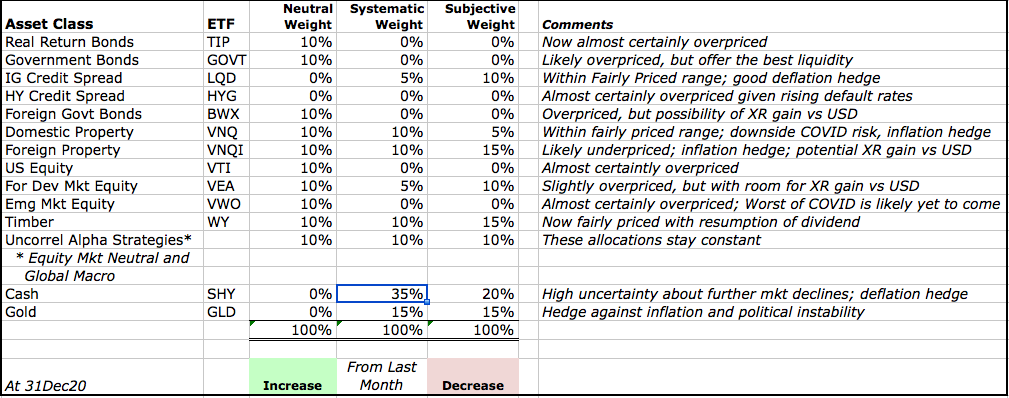
We take two approaches to deriving the tactical asset allocation implications from our analyses (i.e., deviations from our "neutral" or base case model portfolio).
The first takes a systematic approach, and is based on relative asset class valuations. Our starting point is our neutral model portfolio, which is equally weighted across nine broad asset classes, and also includes 5% allocations to alpha strategies (equity market neutral and global macro) that are designed to have a low correlation to returns on broad asset classes.
Based on asset class valuations, we systematically vary the asset class weights (but not the active strategy weight), increasing from 10% to 15% when an asset class is likely undervalued, and 15% when it is very likely undervalued. In the case of overvaluations, we go to 5% and then into cash, if there are no undervalued asset classes with room for an increase. In effect, this replicates the systematic rebalancing strategy we used for 15 years in our previous model portfolios.Based on subscriber requests, this month we are re-introducing a feature from the previous version of The Index Investor: Tactical Asset Allocation Implications from our analyses.
The second tactical approach is based on our subjective view not only of current asset class valuations, but also of the implications of the broader macro trends and uncertainties that we analyze each month. Importantly, this subjective view reflects our primary goal of avoiding large downside losses, rather than seeking large upside gains.
Three final notes: First, with respect to US fixed income, we include credit products (investment grade and high yield) in the same asset class as government debt, and will shift into the former when their valuations become attractive.
Second, we regard gold not as a separate asset class to be held long-term, but rather as a complement to cash, into which we shift in periods of substantial overvaluation across multiple asset classes.
Third, we continue to be deeply concerned by the distortion in asset class valuations that have been created by negative real interest rates on sovereign bonds, which are the foundation of most asset pricing models. In August, we decided to address this distortion by using in our asset class valuation models our estimate of the economically logical real yield on inflation protected US government bonds (TIPs). This brings our quantitative valuation conclusions much closer to those based on our qualitative analysis.
More information about our investment beliefs, including our core philosophy, approach to asset allocation (including our model portfolios and their long-term track record), and views on various approaches to active and passive management can all be found here.
Here is our latest asset allocation view:
Pre-Mortem Analysis
One of the most important forecasting disciplines is to ask yourself why your forecast could be wrong. Dr. Gary Klein’s research has shown that a very powerful and insightful way to do this is via a “pre-mortem analysis.” This method asks you to assume that it is a point in the future, and your forecast has been proven wrong (or your strategy or company has failed). You are then asked to look backward from this imagined point in the future, to explain why you failed, what you missed, and what you could have done differently to avoid your fate.
The pre-mortem method takes advantage of the fact that humans reason much more concretely and in more detail when explaining the past than they do when trying to forecast the future.
So let us assume that it is one year from now, and our current forecast has turned out to be wrong.
How did this happen? What developments did we fail to anticipate?
- A number of world leaders – Xi Jinping and to a lesser extent Vladimir Putin and Ali Khamenei are all facing sharply weakened economies and declining political popularity. History teaches us that this can lead to increased “foreign adventurism” to distract the public from worsening domestic conditions, as a nation rallies around its leader in a period of heightened external conflict. Should a “kinetic” conflict develop between China and the United States, or Iran and Israel, Saudi Arabia, and/ or the US, or between Russia and one or more European countries (e.g., due to a Russian incursion into the Baltics), it would generate a very sharp increase in uncertainty that would likely accelerate the already sharp COVID-19 economic slowdown. Given given high debt levels, this would very likely accelerate the arrival of the Persistent Deflation Regime.
- On the other hand, following the election of Joe Biden, the removal from office Xi Jinping could lead to a reduction in the dangerously growing conflict between the US and China. The impact of this surprise seems uncertain. To the extent that reduced external threat reduces the perceived urgency of implementing structural reforms in the US, it would increase the probability of the High Inflation Regime. Yet at the same time, it could accelerate economic and political reforms in China, which would increase economic growth there, creating a more dangerous medium term situation for the United States.
- A supply side shock of some type – beyond the disruption of global supply chains caused by COVID-19 -- could produce a sudden increase in inflation. The most likely scenario is a reduction in oil supplies due to a prolonged kinetic conflict between Iran and the US. An unlikely scenario could be major crop failures associated with the next solar cycle, which NASA forecasts will be the weakest in 200 years. McKinsey recently concluded that the probability of such a failure has increased due to changes in the environment, and now stands at about 10% over the next five years ("Will the World’s Breadbaskets Become Less Reliable?”).
Note: Combining Our Forecasts with Others From Other Sources and Extremizing the Result Should Increase Your Predictive Accuracy
Research has found that three steps can improve forecast accuracy. The first is seeking forecasts based on different forecasting methodologies, or prepared by forecasters with significantly different backgrounds (as a proxy for different mental models and information). The second is combining those forecasts (using a simple average if few are included, or the median if many are). The final step, which significantly improved the performance of the Good Judgment Project team in the IARPA forecasting tournament, is to “extremize” the average (mean) or median forecast by moving it closer to 0% or 100%.
Forecasts for binary events (e.g., the probability an event will or will not happen within a given time frame) are most useful to decision makers when they are closer to 0% or 100% than the uninformative “coin toss” 50%. As described by Baron et al in “Two Reasons to Make Aggregated Probability Forecasts More Extreme”, forecasters will often shrink their probability estimates towards 50% to take into account their subjective belief about the extent of potentially useful information that they are missing.
When you average multiple forecasters’ estimates, you are including more information, which should increase forecast confidence and push the mean estimate closer to 0% or 100%. However, this doesn’t happen when you use simple averaging. For this reason, forecast accuracy is increased when you employ a structured “extremizing” technique to move the mean estimate closer to 0% or 100%.
You can download an extremizing model from our website to use when combining the forecasts you use in your decision process.
The extremizing factors in our model are those that the Good Judgment Project found maximized the accuracy of combined forecasts. Note that the extremizing factor is lower when average forecaster expertise is higher. This is based on the assumption that a group of expert forecasters will incorporate more of the full amount of potentially useful information than will novice forecasters.
Feature Article: Annual Update of our Detailed Three Year Macro Regime Forecast
High Value Information Observed In December 2020
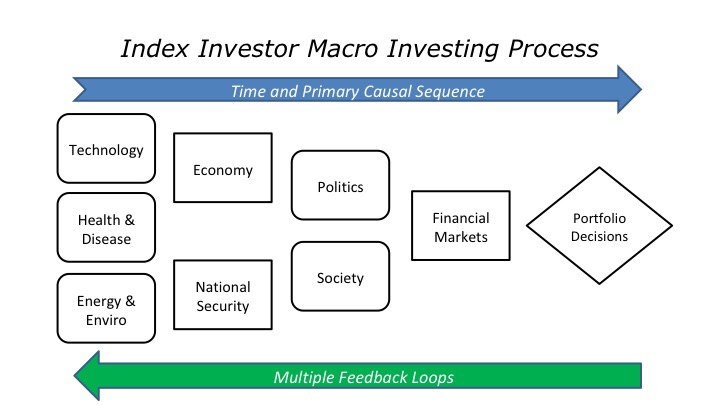
In our model of the complex global macro system, change drivers are arrayed across a roughly chronological process (albeit one with many feedback loops), in which technological, health, and environmental changes precede changes in the economy and national security, which in turn lead to changes in society and politics, all of which produce (albeit with multiple feedback loops) the effects we observe in investor behavior and financial market valuations and returns.
To generate alternative future scenarios and critical forecasting questions, we use this framework to identify multiple paths across these issue areas, including alternative outcomes for critical uncertainties.
In our methodology, we take a Bayesian approach, and classify new information as significant and highly valuable if either it (1) is an “indicator”, which reduces our uncertainty about the value of a parameter in our mental model for making sense of the dynamic macro system, or (2) it is a “surprise” which increases our uncertainty about either the range of potential values for a parameter or the structure of our model.
With respect to indicators, the higher our priori probability is for a regime, the more we look for indicators that it will not occur, and the lower our prior probability for a regime, the more we look for indicators that it will occur. Put differently, try to systematically search for high value indicators that disconfirm our prior views.
| New Technology Information: Indicators and Surprises | Why Is This Information Valuable? |
| “Human Vs. Supervised Machine Learning: Who Learns Patterns Faster?” by Kuhl et al | We continue to focus on indicators and surprises related to the critical uncertainties surrounding rate at which AI technologies are being developed and deployed. This paper is closely related to another new analysis, on “Artificial Intelligence In War: Human Judgment as an Organizational Strength and a Strategic Liability”, by Goldfarb and Lindsay from the Brookings Institution. Their core contention is that as AI improves, human decision makers will be confronted with an exponentially large number of automated predictions they can choose from to inform and support their decision. Effectively, this is just taking “information overload” to a new level. The authors’ key claim is that this will now exponentially increase demand for people with good judgment skills, who can integration multiple AI-generated prediction when making critical decisions under time pressure. Kuhl et al complement this view with their finding that, when it comes to recognizing patterns (and making predictions based on them), when information is scarce, AI/machine learning still lags behind human beings. They note that, “supervised machine learning (SML), with its capabilities to support, or even replace, human workers in their daily tasks, is omnipresent in current discussions…tasks where machine learning models outperform humans are increasing… “But can this development be observed across all tasks? Current examples of (supervised) machine learning models outperforming humans are mainly present in areas where a high amount of training data is available, for example billions of played Go games or millions of labeled images… “In real life, however, often only limited training" data is available, sometimes just a single instance In this article, we are especially interested in learning patterns by humans and machines in data with only a few instances on a given task…“Empirical work in the comparison to human learning is still rare… The investigation of the learning curves, meaning the relation of required training samples and the resulting performance of humans in comparison to SML models, is a topic that has not yet been investigated.” The authors focus on this question: “How does the learning performance of humans and supervised machine learning models differ with limited training data?” They find that, “human performance shows two key characteristics across all four rules to be learned: High accuracy when labeling the first five instances (no accuracy below 60%, which outperforms the supervised machine learning models of three of the four rules) and only small performance improvements after learning with 20 or more training instances… “An explanation for the first observation is grounded in the concept of one-shot learning. Besides incremental learning, where humans learn step-by-step through trial and error, a human is also capable of one-shot learning, which is a technique to learn from a single instance. When a child touches a hot stove plate, he/she will immediately learn not to do it again… “Our interpretation of the data suggests that 20 training instances are the limit for humans' working memory, with more training instances only leading to cognitive overload and not to improved performance… “There are two general findings regarding the machine learning models across all four models: First, The performance after five training instances is similar or lower compared to the human performance and the machine learning models' performance correlates negatively with the complexity of the individual rules. “The second finding relates to one-shot learning. In contrast to humans, all three machine learning models can only do incremental learning. |
| “On the Binding Problem in Artificial Neural Networks”, by Greff et al | “Existing neural networks fall short of human-level generalization. They require large amounts of data, struggle with transfer to novel tasks, and are fragile under distributional shift. “However, under the right conditions, they have shown a remarkable capacity for learning and modeling complex statistical structure in real-world data. One explanation for this discrepancy is that neural networks mostly learn about surface statistics in place of the underlying concepts, which prevents them from generalizing systematically. “However, despite considerable effort to address this issue, human-level generalization remains a major open problem. “In this paper, we will view the inability of contemporary neural networks to effectively form, represent, and relate symbol-like entities, as the root cause of this problem. “Contemporary neural networks still fall short of human-level generalization, which extends far beyond our direct experiences. In this paper, we argue that the underlying cause for this shortcoming is their inability to dynamically and flexibly bind information that is distributed throughout the network. “This "binding problem" affects their capacity to acquire a compositional understanding of the world in terms of symbol-like entities (like objects), which is crucial for generalizing in predictable and systematic ways. To address this issue, we propose a unifying framework that revolves around forming meaningful entities from unstructured sensory inputs (segregation), maintaining this separation of information at a representational level (representation), and using these entities to construct new inferences, predictions, and behaviors (composition). “Our analysis draws inspiration from a wealth of research in neuroscience and cognitive psychology, and surveys relevant mechanisms from the machine learning literature, to help identify a combination of inductive biases that allow symbolic information processing to emerge naturally in neural networks. We believe that a compositional approach to AI, in terms of grounded symbol-like representations, is o fundamental importance for realizing human-level generalization.” |
| “A Review of Uncertainty Quantification in Deep Learning: Techniques, Applications and Challenges”, by Adbar, et al | Uncertainty Quantification (UQ) is critically important in both optimization and decision processes. As Yakov Ben-Haim and Francois Hemez demonstrated in 2012, “Robustness to Uncertainty” is one of the three unavoidable dimensions that must be traded off in predictive modeling (along with Fidelity to Historical Data and Confidence Across Multiple Models). Unfortunately, many modelers don’t even realize these tradeoffs exist. (See Ben-Haim and Hemez’ paper, “Robustness, Fidelity and Prediction-Looseness of Models”). This new paper is very thorough overview how Uncertainty Quantification applies to Deep Learning. |
| “Canaries in Technology Mines: Warning Signs of Transformative Progress in AI”, by Cremer and Whittlestone | SURPRISE “In this paper we introduce a methodology for identifying early warning signs of transformative progress in AI, to aid anticipatory governance and research prioritization… "We call these key milestones ‘canaries’ based on the colloquial phrase ‘canary in a coal mine’ to describe advance warning of an extreme event: in this case, advance warning of transformative AI. “We present results from an initial implementation to identify canaries for progress towards high-level machine intelligence (HLMI).” The authors highlight many warning signs and how they are related to each other. Many of these “canaries” are linked to the development of two critical capabilities: “Symbol-like representations: the ability to construct abstract, discrete and disentangled representations of inputs, to allow for efficiency and variable-binding. We hypothesise that this capability underpins several others, including grammar, mathematical reasoning, concept formation, and flexible memory. “Flexible memory: the ability to store, recognise, and re-use knowledge. We hypothesise that this ability would unlock many others, including the ability to learn from dynamic data, the ability to learn in a continual fashion, and the ability to learn how to learn.” |
| The Second Montreal Debate on the Future of AI was held on December 23, 2020. It attracted multiple leaders who shared their views about the biggest challenges facing the field. | Highlights included the following: “Big data and deep learning alone won’t be enough to get to Artificial General Intelligence.” “The original and fundamental function of the human nervous system is to link perception to action. Intelligence emerges from active perception and interaction with the external environment. The next AI Northstar is how to apply evolutionary processes.” Multiple speakers agreed that causal and counterfactual reasoning are critically important and as yet unmet challenges. “We need to solve the binding problem” – see earlier Evidence Note. “Curiosity is still a big unsolved AI problem.” “How to reduce dependence on large training data and lots of compute to do deep learning?” “Transfer learning is still an unmet challenge.” “As a science, AI is still in the phenomenology and engineering phase; we have only begun the search for AI laws and physics.” |
| “Advanced Technologies Adoption and Use By U.S. Firms: Evidence From The Annual Business Survey” by Zolas et al “AI and Jobs: Evidence from Online Vacancies”, by Acemoglu, Autor, et al “Artificial Intelligence In War: Human Judgment As An Organizational Strength And A Strategic Liability”, by Goldfarb and Lindsay from Brookings | Zolas et al find that, “advanced technology adoption is rare and generally skewed towards larger and older firms. Adoption patterns are consistent with a hierarchy of increasing technological sophistication, in which most firms that adopt AI or other advanced business technologies also use the other, more widely diffused technologies. Finally, while few firms are at the technology frontier, they tend to be large so technology exposure of the average worker is significantly higher.” Acemoglu, Autor et al “study the impact of AI on labor markets, using establishment level data on vacancies with detailed occupational information comprising the near-universe of online vacancies in the US from 2010 onwards. We classify establishments as "AI exposed" when their workers engage in tasks that are compatible with current AI capabilities.” They “document rapid growth in AI related vacancies over 2010-2018 that is not limited to the Professional and Business Services and Information Technology sectors and is significantly greater in AI-exposed establishments. AI exposed establishments are differentially eliminating vacancy postings that list a range of previously-posted skills while simultaneously posting skill requirements that were not previously listed. “Establishment-level estimates suggest that AI-exposed establishments are reducing hiring in non-AI positions as they expand AI hiring. However, we find no discernible relationship between AI exposure and employment or wage growth at the occupation or industry level, implying that AI is currently substituting for humans in a subset of tasks but it is not yet having detectable aggregate labor market consequences.” Goldfarb and Lindsay highlight the increasing importance (and growing shortage) of people with outstanding judgment skills as improvements in AI increase the volume of automated predictions they will confront when making decisions in increasingly high-velocity environments. |
| “Capitol Hill — The 9/11 Moment Of Social Media” by Thierry Breton, European Commissioner for the Internal Market | SURPRISE The reaction of major tech companies to the January 6th attack on the US Capitol is likely to shift US opinion towards the emerging European approach to regulating the industry. “Just as 9/11 marked a paradigm shift for global security, 20 years later we are witnessing a before-and-after in the role of digital platforms in our democracy. “Social media companies have blocked U.S. President Donald Trump’s accounts on the grounds that his messages threatened democracy and incited hatred and violence. In doing so, they have recognized their responsibility, duty and means to prevent the spread of illegal viral content. They can no longer hide their responsibility toward society by arguing that they merely provide hosting services. “The dogma anchored in section 230 — the U.S. legislation that provides social media companies with immunity from civil liability for content posted by their users — has collapsed. “If there was anyone out there who still doubted that online platforms have become systemic actors in our societies and democracies, last week’s events on Capitol Hill is their answer. What happens online doesn’t just stay online: It has — and even exacerbates — consequences “in real life” too. “The unprecedented reactions of online platforms in response to the riots have left us wondering: Why did they fail to prevent the fake news and hate speech leading to the attack on Wednesday in the first place? “Regardless of whether silencing a standing president was the right thing to do, should that decision be in the hands of a tech company with no democratic legitimacy or oversight? Can these platforms still argue that they have no say over what their users are posting?” “Last week’s insurrection marked the culminating point of years of hate speech, incitement to violence, disinformation and destabilization strategies that were allowed to spread without restraint over well-known social networks. The unrest in Washington is proof that a powerful yet unregulated digital space — reminiscent of the Wild West — has a profound impact on the very foundations of our modern democracies. “The fact that a CEO can pull the plug on POTUS’s loudspeaker without any checks and balances is perplexing. It is not only confirmation of the power of these platforms, but it also displays deep weaknesses in the way our society is organized in the digital space.” |
| | |
| | |
| | |
| | |
| | |
| | |
| New Energy and Environment Information: Indicators and Surprises | Why Is This Information Valuable? |
| “Extreme Weather Causes Surge In Solar Power Insurance Costs”, by Gregory Meyer in the Financial Times | SURPRISE “Solar power is crucial to addressing climate change, but extreme weather is making solar power projects more costly, damaging solar panels and driving up insurance premiums as much as fivefold over the past two years. “Hailstorms, wildfires and tornadoes have caused underwriters to restrict terms for renewable project owners, according to industry executives, following an above $70m payout for a Texas solar farm smashed by hail in 2019 and large claims on three sola farms scorched by record blazes in California this year… “We have seen projects that were achieving their expected returns no longer able to do that, as a result of the change in the cost of insurance,” said Michael Kolodner, US power and renewable practice leader at Marsh, an insurance broker.” |
| “Fossil Electricity Retirement Deadlines For A Just Transition”, by Emily Grubert | SURPRISE Stranded assets are defined by the International Energy Agency as “investments which have already been made but which, at some time prior to the end of their economic life, are no longer able to earn an economic return.” “Decarbonizing the electricity sector is critical for addressing climate change, particularly given the expected role of an expanded clean electricity system for home heating, transportation, and industry. This will require vast investment in new infrastructure such as renewable-energy power plants and batteries. Absent major investment in carbon-capture equipment or fuel switching, it will also require the retirement of carbon-based power plants… “Determining which assets are “stranded,” or required to close earlier than expected absent policy, is vital for managing compensation for remaining debt and/or lost revenue… “In the United States, a 2035 electricity decarbonization deadline, as proposed by President-elect Biden would strand only about 15% of fossil capacity-years and 20% of job-years… “A key finding of this research is that a 2035 deadline for completely retiring fossil based electricity generators would strand only about 15% (1700 GW-years) of fossil fuel–fired capacity life, alongside about 20% (380,000 job-years) of direct power plant and fuel extraction jobs remaining as of 2018.” The paper doesn't mention the political consequences of losing 20% of high paying electric generating jobs… |
| “Decarbonisation Goals Require Huge Commitment to Critical Metals”, by John Dizard in the Financial Times | SURPRISE “Copper, nickel, cobalt, chromium and other critical minerals will be required in much larger quantities for decarbonisation… “Political debates and investor allocations have been neglecting the long lead times required for the metals and metallurgical techniques needed for electric or hydrogen economies. “Any decarbonisation goals must take into account the minimum of seven to 10 years required for developing the new mines we will need… “There is a great deal of attention devoted to the increased efficiency of solar panels and wind turbines. Mine productivity, though, is steadily going down as ore grades decline for critical metals such as copper and nickel. “The economic effect of lower ore grades has been offset for the past couple of decades by a few innovations such as much larger mining trucks, but productivity improvements in mining are petering out. There are fewer new, rich metals deposits being discovered, and those that are found tend to be in politically and socially unstable places… “There is a lot of political support for the hydrogen economy. This enthusiasm has, generally, not been accompanied by an appreciation of how much new, and highly engineered, metal it would require. Hydrogen is not just a non-polluting gas that leaves only water vapour in its wake. It is a hard-to-handle molecule that is not very forgiving of the weaknesses of our legacy metal infrastructure… “Whether zero net carbon is set for 2035, 2050, or some other ambitious goal, the PowerPoint assumptions that the metal needed will be available when required are not based in reality” |
| “What Matters for Electrification? Evidence from 70 Years of U.S. Home Heating Choices” by Lucas Davis | “The percentage of U.S. homes heated with electricity has increased steadily from 1% in 1950, to 8% in 1970, to 26% in 1990, to 39% in 2018. This paper investigates the key determinants of this increase in electrification using data on heating choices from millions of U.S. households over a 70-year period… “Households in warm states are close to indifferent between electric and natural gas heating, so would be made worse off by less than $500 annually… “Household in cold states, however, tend to strongly prefer natural gas so would be made worse off by $3000+ annually”. Once again — can you imagine the political consequences of forcing a $3,000 increase in their energy bill on millions of households? |
| “Renewable Energy and Infrastructure Policy Scenario Analysis”, by the American Clean Power Association and Wood Mackenzie | SURPRISE “Transmission-focused policies will be critical to unlocking renewable potential… Required transmission expansion to accommodate increased renewables represents over 70 new or upgraded transmission lines, representing over 10,000 miles and $70 billion in capital investment.” Another new study, “Net Zero America” by Larson et al from Princeton University, projects that substantially higher transmission investments will be required. Anyone familiar with the regulatory and political challenges of building long-distance, high voltage transmission lines knows that building 10,000 miles of new transmission lines will almost certainly face very substantial obstacles. |
| “Food price rally sparks warnings of pressure on developing countries”, by Emiko Terazono in the Financial Times | “A sharp rebound in food prices is stirring concerns over inflation and potential unrest in some developing countries. “Stockpiling, logistical bottlenecks and dry weather have pushed wheat, soyabeans, rice, and corn markets higher… “In 2007-08, severe droughts drove up prices, triggering food riots in some African countries. A wheat export ban by Russia in 2010 also led to a surge in food prices in the Middle East, contributing to the Arab uprising. “Some are now concerned about a “COVID shock” hitting some of the more vulnerable countries. “The real impact is the access to food. People have lost their income. There are a lot of unhappy people and this is a recipe for social unrest,” said Abdolreza Abbassian, senior economist at the FAO. “The issue is not a food shortage at this point — grains and oilseeds have had bumper crops over the past few years, leading to higher inventories. But analysts worry that higher prices at a time of economic stress bodes badly, especially for poorer countries, particularly while an economic rebound in Asia is bumping up demand for grains and soyabeans. “Food inflation is the last thing governments need right now,” said Carlos Mera, analyst at Rabobank.” |
| | |
| | |
| | |
| | |
| | |
| | |
| | |
| New Economic Information: Indicators and Surprises | Why Is This Information Valuable? |
| “Zombies at Large? Corporate Debt Overhang and the Macroeconomy”, by Jorda et al from the Federal Reserve Bank of New York “Jenga-Like Structure Builds In Credit Markets”, by Joe Rennison in the Financial Times | Jorda et al find, “With business leverage at record levels, the effects of corporate debt overhang on growth and investment have become a prominent concern. In this paper, we study the effects of corporate debt overhang based on long-run cross-country data covering the near-universe of modern business cycles. We show that business credit booms typically do not leave a lasting imprint on the macroeconomy. Local projections indicate that business credit booms do not affect the economy’s tail risks either. “Yet in line with theory, we find that the economic costs of corporate debt booms rise when inefficient debt restructuring and liquidation impede the resolution of corporate financial distress and make it more likely that corporate zombies creep along.” Regarding that all-important last paragraph, Rennison reports that, “corporate bond market are starting to look unnerving. Matt Mish, who heads up UBS’s credit strategy team, likens the current state of the market to a tower of Jenga blocks. At the moment, crucial support is being provided by central bank buying across the globe, holding borrowing costs low and providing a backstop if investor demand falls. As that support is removed piece by piece, the tower could begin to wobble.” In contrast to the US, the UK has squarely faced the challenge to demand recovery posed by high levels of debt that small and medium enterprises (SMEs) have taken on to survive the COVID downturn. In many countries the bankruptcy system forces such companies into liquidation, with debt restructuring and conversion to equity usually open only to large companies. Hence a report from TheCityUK recommends that the government launch new programs to recapitalize such businesses, for example via SME debt forgiveness, a new government entity that could purchase SME loans from lenders and convert them to equity, or by issuing grants and/or making new equity investments (“Supporting Uk Economic Recovery Recapitalising Businesses Post Covid-19”). |
| “Swaths Of European Firms Risk Collapse Despite Subsidies, ECB Warns”, by Martin Arnold in the Financial Times | “Companies at risk of collapse are defined as having negative working capital and high debt levels” … “Fourteen percent of Spanish workers are in businesses at risk of collapse, according to new research by the European Central Bank, excluding those who work for financial companies…This is the highest rate of all large Eurozone economies, and comes despite the country’s national furlough scheme. “It compares with about 8 per cent of employees in Germany and France and 10 per cent in Italy, also taking into account the use of subsidies to keep people in work, the ECB found. |
| “Stress Testing U.S. Leveraged Corporates in a COVID-19 World”, by Caceres et al from the IMF | This paper analyzes a group of 755 firms, with aggregate indebtedness of US$6.2 trillion, to assess the solvency risks and liquidity needs facing the U.S. corporate sector based on projections of net income, availability and cost of funding, and debt servicing flows under different stress test scenarios. The paper finds that “leveraged corporates account for most of the potential losses arising from the macroeconomic stresses associated with the COVID-19 crisis, with a concentration of these losses in the oil and gas, auto, and capital and durable goods manufacturing sectors. “However, potential losses from corporate debt write-downs appear to be a fraction of banks’ capital buffers and, given the size of the leveraged segment and the relatively long duration of that sector’s debt, the near-term liquidity needs of these corporates appear modest. “Corporate stresses could, however, amplify the current economic downturn—as firms cut investment spending and reduce employment—potentially giving rise to significant indirect losses for the financial system”. |
| “Digital Capital and Superstar Firms”, by Tambe et al | SURPRISE This paper provides further evidence of how talent shortages (caused by AI and other technologies improving faster than the education and reskilling systems are producing graduates who can use them) is reinforcing the “superstar firm” effect, and in so doing contributing to rising income inequality. “General purpose technologies like information technology typically require complementary firm specific investments [e.g. in new organizational processes, systems, and skills] to create value. These complementary investments produce a form of capital, which is typically intangible and which we call digital capital.” “We create an extended firm-level panel on IT labor investments (1990-2016) using data from LinkedIn… “We find that 1) digital capital prices vary significantly over time, peaking around the dot-com boom in 2000; 2) significant digital capital quantities have accumulated since the 1990s, with digital capital accounting for at least 25% of firms’ assets by the end of our panel; 3) that digital capital has disproportionately accumulated in a small subset of “superstar” firms and its concentration is much greater than the concentration of other assets; and 4) that digital capital accumulation predicts firm-level productivity about three years in the future”… “Moreover, per-capita digital capital stocks are substantially greater in firms with more educated workers. These findings are consistent with the emphasis that technology-intensive firms place on making investments in training and skills”… “Inequality in digital capital among firms is growing as the top firms pull further away from the rest.” |
| “Impact of COVID-19 on Productivity”, by Bloom et al | Given a declining working age population, this paper's conclusion — that COVID will reduce productivity growth — implies lower medium term economic growth rates, which will worsen debt servicing problems, and make it more difficult to reduce inequality. If these conditions prevail, the net result is very likely to be an increase in social and political conflict and uncertainty. “We analyze the impact of Covid-19 on productivity in the United Kingdom using data derived from a large monthly firm panel survey. Our estimates suggest that Covid-19 will reduce Total Factor Productivity in the private sector by up to 5% in 2020 Q4, falling back to a 1% reduction in the medium term. “Firms anticipate a large reduction in ‘within-firm’ productivity, primarily because measures to contain Covid-19 are expected to increase intermediate costs. The negative ‘within-firm’ effect is partially offset by a positive ‘between-firm’ effect as low productivity sectors, and the least productive firms among them, are disproportionately affected by Covid-19 and consequently make a smaller contribution to the economy”. “In the longer run, productivity growth is likely to be reduced by diminished R&D expenditure and diverted senior management time spent on dealing with the pandemic.” |
| “A Reconsideration of Fiscal Policy in the Era of Low Interest Rates”, by Furman and Summers | SURPRISE In this important paper, the authors argue that, “while the future is unknowable and the precise reasons for the decline in real interest rates are not entirely clear, declining real rates reflect structural changes in the economy that require changes in thinking about fiscal policy and macroeconomic policy more generally that are as profound as those that occurred in the wake of the inflation of the 1970s”… “We note that with massive increases in budget deficits and government debt, expansions in social insurance, and sharp reductions in capital tax rates, one would have expected to see increasing real rates if private sector behavior had remained constant. We suggest that changes in the supply of saving associated with lengthening life expectancy, rising uncertainty and increased inequality along with reductions in the demand for capital associated with demographic changes, demassification of the economy, and perhaps changes in corporate behavior have driven real interest rates down” … “We discuss three implications for fiscal policy that follow from low interest rates: “First, fiscal policy must play a crucial role in stabilization policy in a world where monetary policy can counteract financial instability but otherwise is largely “pushing on a string” when it comes to accelerating economic growth…. “Second, we reconsider traditional views about the dangers of debt and deficits. We note that in a world of unused capacity and very low interest rates and costs of capital, concerns about crowding out of desirable private investment that were warranted a generation ago have much less force today. “We argue that debt-to-GDP ratios are a misleading metric of fiscal sustainability that do not reflect the fact that both the present value of GDP has risen and debt service costs have fallen as interest rates have fallen. Instead we propose that it is more appropriate to compare interest rate flows with GDP flows… “Third, we consider the issue of borrowing in the context of how the borrowed funds are used. “We highlight that traditional notions of financial responsibility for households and businesses hold that borrowing in order to invest in assets that have a return well in excess of the cost of borrowing increases creditworthiness and benefits future stakeholders…We argue that borrowing to finance appropriate categories of Federal expenditure pays for itself in Federal budgetary terms on reasonable assumptions… “We conclude with thoughts on appropriate guidelines for U.S. fiscal policy. We reject traditional ideas of a cyclically balanced budget on the grounds that it would likely lead to inadequate growth and excessive financial instability. “We set the goal that fiscal policy should advance economic growth and financial stability. Achieving this goal depends on both improving responses to downturns and expanding and improving public investment. As a new guidepost, we propose that fiscal policy focus on supporting economic growth while preventing real debt service from being projected to rise quickly or to rise above 2 percent of GDP over the forthcoming decade.” |
| “Global Economic Prospects”, World Bank Report | “Although the global economy is emerging from the collapse triggered by the pandemic, the recovery is projected to be subdued. Global economic output is expected to expand 4 percent in 2021 but still remain more than 5 percent below its pre-pandemic trend. “Moreover, there is a material risk that setbacks in containing the pandemic or other adverse events derail the recovery… “The pandemic has exacerbated the risks associated with a decade-long wave of global debt accumulation. Debt levels have reached historic highs, making the global economy particularly vulnerable to financial market stress… “With weak fiscal positions severely constraining government support measures in many countries, an emphasis on ambitious reforms is needed to rekindle robust, sustainable and equitable growth.” |
| | |
| | |
| | |
| | |
| | |
| | |
| | |
| | |
| | |
| | |
| | |
| | |
| New National Security Information: Indicators and Surprises | Why Is This Information Valuable? |
| The US announced detection of a widespread penetration of US government information systems, via a common network management software program purchased from a company called Solar Winds. The Financial Times reported that, “US cyber officials warned that the massive espionage campaign unearthed this week posed a “grave risk” to the government, critical infrastructure and private sector.” The FT also noted that, “The massive hack has shone a light on the vulnerability of US government agencies and many of the world’s biggest companies to cyber intrusions via the long tail of vendors they rely on for IT services. SolarWinds is one of hundreds of relatively unknown companies that provide software to governments and business for their networks.” Later reports said that the Russian government was behind the hack. | SURPRISE As Rob Knake noted in Foreign Affairs, one reason for the success of the attack was that, “The U.S. Failed to Execute Its Cyberstrategy — and Russia Pounced”. Knakes went on to observe that, “for more than two decades, U.S. cyberstrategy has been predicated on the need for government and private enterprise to work together to counter threats. No federal agency has the ability to detect and deter all foreign adversaries in cyberspace, so the public and private sectors must cooperate. “Yet the United States has never built the structures or capabilities needed to fully implement such a joint effort. Instead, every four to eight years, the president or Congress has assembled a different group of experts to hash out a new approach—as the Center for Strategic and International Studies’ Commission on Cybersecurity for the 44th President did in 2008, the White House Commission on Enhancing National Cybersecurity did in 2016, and the U.S. Cyberspace Solarium Commission did last year.” “Each of these commissions had a broad mandate to rethink U.S. cyberstrategy, and each concluded the same thing: that a public-private partnership is the only viable approach. The commissions each recommended long lists of means for forging such a partnership, including by strengthening the mechanisms and procedures by which federal agencies collaborate and share information, both among themselves and with the private sector. Unfortunately, most of these recommendations were either only partially implemented or ignored.” |
| China has taken a number of actions against domestic private sector companies and their leaders, apparently with the intention of making it clear to all that they are subservient to the Chinese Communist Party | As Nikkei Asia noted, “After years of bounding growth and shopping sprees for new assets, China’s biggest internet conglomerates extend into most sectors of the economy, from transportation to finance. But while they used to enjoy a free pass on regulatory issues, they are now under unprecedented scrutiny, and the state is asserting its dominance once again” (“China Rethinks the Jack Ma Model”). The interesting question is why this is happening now. One theory is that the CCP worries that by building large customer bases and amassing massive amounts of data on them, Chinese internet companies have acquired the power to sway public opinion (e.g., by using AI to customize the content and messages recommended and delivered to individual customers), which could be used to achieve political not just commercial goals Another theory is the CCP’s increasing concern that China’s fast growing fintech sector could eventually cause serious instabilities in its already highly leveraged and fragile financial system. |
| “The Bill Is Coming Due for China’s Capitalist’ Experiment”, by Michael Hochberg and Leonard Hochberg | “The Chinese Communist Party (CCP) has re-awoken to a profound truth: Rich, secure capitalists are the natural enemies of authoritarian regimes. In a hybrid autocratic-capitalist model, capitalism is the means to generate wealth, but power is the end goal. “Successful capitalists naturally begin to demand that their personal and property rights be protected from authoritarian fiat. Capital in the hands of entrepreneurs is a political resource; it poses a threat to the implementation of centralized plans. “Realizing this, the CCP has begun to assert control over the private sector by installing Party officials inside private firms and having state-backed firms invest in private enterprises. “In the absence of civil rights or an independent judiciary, “private” companies have no real independence from the government in China. Dissent and demands for civil rights are a threat to the regime and will be crushed… “A number of Chinese state-backed companies, including some in strategically important industries, have begun to default on their debt obligations. “Will international creditors be allowed to claim the assets? Will the equity holders— in many cases the CCP or regional and local governments in China — be wiped out? “If these companies are bailed out by the government, will domestic and foreign debt-holders be treated equally? Or will foreign creditors find their assets wiped out, while these companies continue operating under nominally new ownership and perhaps a new corporate brand? “It seems a safe bet that foreign debts will be repudiated, either explicitly or implicitly. What was previously commercial debt now has the risks that are typically associated with sovereign debt, which can be canceled by government fiat. “In short, a wave of write-downs is coming for Western businesses invested in China.” |
| Crackdowns in Hong Kong continued, with 53 more democracy activists arrested. The BBC noted that, “the crackdown appeared to confirm the fears of many who warned about the reach of the law, with Amnesty International saying the arrests are "the starkest demonstration yet of how the national security law has been weaponised to punish anyone who dares to challenge the establishment". | SURPRISE This is aggressive move against Hong Democracy activists surprised many observers. However, it is consistent with Xi Jinping’s past behavior, as we noted in our October 2020 feature analysis (“Will Xi Jinping Launch a Surprise Attack on Taiwan Before the 20th Party Congress of the CCP in November 2022? And What Happens if He Does?”). Along with the crackdown on China’s fintech industry and the private sector more broadly, this new evidence is consistent with increasing domestic stresses within China, as well as the Beckley and Brands analysis noted below. As Bethany Allen-Ebrahimian headlined her story on the arrests in Axios, “With Hong Kong arrests, China outlaws democracy itself.” The Financial Times observed that, “The 53 were not rabble-rousers but moderates. They were detained for involvement in a primary run-off last year to determine which opposition figures would run in Legislative Council elections that were later postponed due to Covid-19. That this is now said to constitute “subversion” highlights the draconian nature of the national security law China imposed last year… The clampdown is further proof of the extent to which the confrontation between Beijing and the West is one of values. Xi Jinping’s China sees itself as engaged in an ideological struggle with what president Xi has called the “extremely malicious” ideas of liberalism and democracy” (“The Crushing Of Hong Kong’s Opposition”). Among those arrested was John Clancy, a US resident and Hong Kong based attorney. The BBC reported that, “Antony Blinken, President-elect Joe Biden's pick as next US Secretary of State, said the arrests were an "assault on those bravely advocating for universal rights… The Biden-Harris administration will stand with the people of Hong Kong and against Beijing's crackdown on democracy." |
| The Financial Times broke a story that China’s “Xinjiang [surveillance] data platform deems people suspicious by association”. | SURPRISE This story provides further indicators of how far “Techno-Authoritarianism” and “the surveillance state” have advanced in China, and given rise to an Orwellian version of “cancel culture.” “A big data platform helped Chinese authorities in Xinjiang to identify individuals deemed suspicious by association that facilitated mass detention of Muslims in the region, a leaked government document has shown. “Over the past four years, more than 1m Uighurs, Kazakhs and other mostly Muslim peoples in the far western region have been detained in extrajudicial camps where they are subject to political “re-education.” See also, “‘Because There Were Cameras, I Didn’t Ask Any Questions’ Chinese Government Documents Provide New Details on a Small Xinjiang Town’s Extensive System of Surveillance” by Darren Byler |
| “Competition With China Could Be Short and Sharp: The Risk of War Is Greatest in the Next Decade”, by Beckley and Brands | SURPRISE This new analysis reaches similar conclusions to the analysis we presented in our October 2020 issue (“Will Xi Jinping Launch a Surprise Attack on Taiwan Before the 20th Party Congress of the CCP in November 2022? And What Happens if He Does?”). “In foreign policy circles, it has become conventional wisdom that the United States and China are running a “superpower marathon” that may last a century. But the sharpest phase of that competition will be a decade long sprint. The Sino-American contest for supremacy won’t be settled anytime soon. “Yet history and China’s recent trajectory suggest that the moment of maximum danger is just a few years away. “China has entered a particularly perilous period as a rising power: it has gained the capability to disrupt the existing order, but its window to act may be narrowing. “The balance of power has been shifting in Beijing’s favor in important areas of U.S.-Chinese competition, such as the Taiwan Strait and the struggle over global telecommunications networks. Yet China is also facing a pronounced economic slowdown and a growing international backlash. “The good news for the United States is that over the long term, competition with China may prove more manageable than many pessimists believe. Americans may one day look back on China the way they now view the Soviet Union—as a dangerous rival whose evident strengths concealed stagnation and vulnerability. “The bad news is that over the next five to ten years, the pace of Sino-American rivalry will be torrid, and the prospect of war frighteningly real, as Beijing becomes tempted to lunge for geopolitical gain. “The United States still needs a long-term strategy for protracted competition. But first it needs a near-term strategy for navigating the danger zone.” |
| | |
| | |
| | |
| | |
| | |
| | |
| | |
| | |
| New Health and Disease Information: Indicators and Surprises | Why Is This Information Valuable? |
| “The Lab-Leak Hypothesis”, by Nichoslson Baker in New York Magazine | SURPRISE In this exhaustive analysis (which builds on reports in our previous Evidence Files), Baker concludes that, “What happened was fairly simple, I’ve come to believe. It was an accident. A virus spent some time in a laboratory, and eventually it got out. SARS-CoV-2, the virus that causes COVID-19, began its existence inside a bat, then it learned how to infect people in a claustrophobic mine shaft, and then it was made more infectious in one or more laboratories, perhaps as part of a scientist’s well-intentioned but risky effort to create a broad-spectrum vaccine. SARS-2 was not designed as a biological weapon. But it was, I think, designed.” Note also that the Chinese government has denied the WHO team investigating the origins of SARS-CoV-2 access to the suspect Wuhan virology lab and its staff. |
| “Assessment Of The Risks Of Viral Transmission In Non-Confined Crowds”, by Garcia et al | “This work aims to assess the risks of Covid-19 disease spread in diverse daily-life situations (referred to as scenarios) involving crowds of unmasked pedestrians, mostly outdoors… “Street cafés present the largest average rate of new infections caused by an attendant, followed by busy outdoor markets, and then metro and train stations, whereas the risks incurred while walking on fairly busy streets are comparatively quite low. “Street cafés present the largest average rate of new infections caused by an attendant, followed by busy outdoor markets, and then metro and train stations, whereas the risks incurred while walking on fairly busy streets are comparatively quite low.” |
| “Epidemiology Of Post-COVID Syndrome Following Hospitalisation With Coronavirus: A Retrospective Cohort Study”, by Ayoubkhani et al from the UK Office of National Statistics | SURPRISE There have been plenty of anecdotal reports about the long term mental and physical health effects of COVID, and the future additional costs they will impose on a healthcare system already facing a substantial increase in the number of elderly patients due to population aging. The authors note that, “the epidemiology of post-COVID syndrome (PCS) is currently undefined.” Based on a study of 47,780 COVID patients, they “quantified rates of organ-specific impairment following recovery from COVID-19 hospitalisation compared with those in a matched control group”… “Mean follow-up time was 140 days for COVID-19 cases and 153 days for controls. 766 (95% confidence interval: 753 to 779) readmissions and 320 (312 to 328) deaths per 1,000 person-years were observed in COVID-19 cases, 3.5 (3.4 to 3.6) and 7.7 (7.2 to 8.3) times greater, respectively, than in controls. Rates of respiratory, diabetes and cardiovascular events were also significantly elevated in COVID-19 cases, at 770 (758 to 783), 127 (122 to 132) and 126 (121 to 131) events per 1,000 person-years, respectively” … The authors’ conclusion suggests that long-term costs to the healthcare system will be high, although more research is still needed. “Conclusions: Individuals discharged from hospital following COVID-19 face elevated rates of multi-organ dysfunction compared with background levels, and the increase in risk is neither confined to the elderly nor uniform across ethnicities. The diagnosis, treatment and prevention of PCS require integrated rather than organ- or disease-specific approaches. Urgent research is required to establish risk factors for PCS.” |
| With new highly transmissible SARS-CoV-2 variants now appearing in the US (including those first identified in the UK, South Africa, Brazil, and now one in Ohio) we are in a deadly race. If we can exponentially increase the number of people vaccinated, we may be able to limit the exponential increase in the number of people who will otherwise suffer COVID inflection, and eventually overwhelm hospital capacity without severe lockdowns, as we now see in Europe. Unfortunately, the evidence to date has shown that US vaccinations have been increasing at a slow rate. For example, between 20Dec and 15Jan, the percent of the US population that had been vaccinated increased from 0.17% to 3.71%. In Israel, it went from 0.07% to 25.34%. While the Biden administration promises to speed up vaccinations in the US, based on the rates at which infections by the new variants have grown in the UK, EU, South Africa, and Brazil, it seems very likely (80% probability) that more severe lockdowns and economic losses lie ahead. If this forecast turns out to be wrong, it will be because of a dramatic improvement in the US vaccination rate over the next month. | SURPRISE Adam Kurcarski, a London-based epidemiologist, posted this twitter thread explaining (mathematically) the risk posed by the more transmissible (i.e., infectious) new variants: “Why a SARS-CoV-2 variant that's 50% more transmissible would in general be a much bigger problem than a variant that's 50% more deadly. “As an example, suppose current R=1.1, infection fatality risk is 0.8%, generation time is 6 days, and 10k people infected (plausible for many European cities recently). So we'd expect 10000 x 1.1^5 x 0.8% = 129 eventual new fatalities after a month of spread. “What happens if fatality risk increases by 50%? By above, we'd expect 10000 x 1.1^5 x (0.8% x 1.5) = 193 new fatalities. “Now suppose transmissibility increases by 50%. By above, we'd expect 10000 x (1.1 x 1.5)^5 x 0.8% = 978 eventual new fatalities after a month of spread. “The above is just an illustrative example, but the key message: an increase in something that grows exponentially (i.e. transmission) can have far more effect than the same proportional increase in something that just [linearly] scales an outcome.” |
| “Estimated Transmissibility And Severity Of Novel SARS-Cov-2 Variant Of Concern 202012/01 In England”, by Davies et al | SURPRISE Further evidence about the increased transmissibility of the new SARS-CoV-2 strain in the UK. “We estimate that [new variant of concern] VOC 202012/01 is 56% more transmissible (95% credible interval across three regions 50% -74%) than preexisting variants of SARS-CoV-2. We were unable to find clear evidence that VOC 202012/01 results in greater or lesser severity of disease than preexisting variants. “Nevertheless, the increase in transmissibility is likely to lead to a large increase in incidence, with COVID-19 hospitalisations and deaths projected to reach higher levels in 2021 than were observed in 2020, even if regional tiered restrictions implemented before 19 December are maintained. “Our estimates suggest that control measures of a similar stringency to the national lockdown implemented in England in November 2020 are unlikely to reduce the effective reproduction number R to less than 1, unless primary schools, secondary schools, and universities are also closed. “We project that large resurgences of the virus are likely to occur following easing of control measures. It may be necessary to greatly accelerate vaccine roll-out to have an appreciable impact in suppressing the resulting disease burden.” |
| “Emergence and Rapid Spread Of A New Severe Acute Respiratory Syndrome-Related Coronavirus 2 (SARS-Cov-2) Lineage With Multiple Spike Mutations In South Africa”, by Tegally et al | SURPRISE Evidence about the new South African SARS-CoV-2 strain. “Continued uncontrolled transmission of the severe acute respiratory syndrome-related coronavirus 2 (SARS-CoV-2) in many parts of the world is creating the conditions for significant virus evolution. Here, we describe a new SARS-CoV-2 lineage (501Y.V2) characterised by eight lineage-defining mutations in the spike protein, including three at important residues in the receptor-binding domain (K417N, E484K and N501Y) that may have functional significance. “This lineage emerged in South Africa after the first epidemic wave…[and] spread rapidly, becoming within weeks the dominant lineage in the Eastern Cape and Western Cape Provinces. “Whilst the full significance of the mutations is yet to be determined, the genomic data, showing the rapid displacement of other lineages, suggest that this lineage may be associated with increased transmissibility.” |
| “Comprehensive Mapping Of Mutations To The SARS-Cov-2 Receptor-Binding Domain That Affect Recognition By Polyclonal Human Serum Antibodies”, by Greaney et al | SURPRISE This paper finds that infection with previous strains of COVID is likely to provide less antibody-based immunity against the new South African and Brazilian variants of SARS-CoV-2. However, two caveats are in order. First, it says nothing about immunity provided by T and B cells. Second, it says nothing about reduced severity of disease after reinfection. And third, it is possible to modify vaccines so that they are more effective against new variants of SARS-CoV-2, as we routinely do with seasonal influenza vaccines. The authors note that, “the evolution of SARS-CoV-2 could impair recognition of the virus by human antibody-mediated immunity. To facilitate prospective surveillance for such evolution, we map how convalescent serum antibodies are impacted by all mutations to the spike’s receptor-binding domain (RBD), the main target of serum neutralizing activity. Binding by polyclonal serum antibodies is affected by mutations in three main epitopes in the RBD, but there is substantial variation in the impact of mutations both among individuals and within the same individual over time. “Despite this inter- and intra-person heterogeneity, the mutations that most reduce antibody binding usually occur at just a few sites in the RBD’s receptor binding motif. The most important site is E484, where neutralization by some sera is reduced >10-fold by several mutations, including one in emerging viral lineages in South Africa and Brazil.” |
| “Vaccine Skepticism Among Medics Sparks Alarm In Europe And US”, in the Financial Times | SUPRPRISE Given the expected increase in the prevalence of more transmissible variants of SARS-CoV-2, refusal of people to be vaccinated raises the probability of the health care system being overwhelmed in the absent of another strict lockdown, with its attendant negative impact on the economy. “Signs that a relatively high number of healthcare workers are unwilling to receive the coronavirus vaccine in some parts of Europe and the US have alarmed politicians and health experts, as countries struggle to contain a surge in infections and carry out mass vaccination.” |
| “Incidence and Secondary Transmission of SARS-CoV-2 Infections in Schools”, by Zimmerman et al in the Journal of the American Academy of Pediatrics | SURPRISE Learning losses caused by the closure of schools and shift to less effective remote learning will very likely have a negative long-term impact on productivity growth unless such losses are avoided or recovered. To enable schools to reopen and/or stay open, it is therefore critical to better understand how to measure, mitigate, and manage the risk of COVID infection in schools. This study provides critical new evidence about this issue. “Despite widely varying indoor air quality parameters, this large study found no child to adult transmission of the SARS-CoV-2 virus in schools. The risk of inflection could almost certainly be further reduced by improving indoor air quality in some schools. “In an effort to mitigate the spread of severe acute respiratory syndrome coronavirus 2 (SARS-CoV-2), North Carolina (NC) closed its K–12 public schools to in-person instruction on 03/14/2020. “On 07/15/2020, NC’s governor announced schools could open via remote learning or a “hybrid” model that combined in-person and remote instruction. In August 2020, 56 of 115 NC school districts joined the ABC Science Collaborative to implement public health measures to prevent SARS-CoV-2 transmission and share lessons learned. “Over 9 weeks, 11 participating school districts had more than 90,000 students and staff attend school in-person; of these, there were 773 community-acquired SARS-CoV-2 infections documented by molecular testing. “Through contact tracing, NC health department staff determined an additional 32 infections were acquired within schools. No instances of child-to-adult transmission of SARS-CoV-2 were reported within schools.” Note that the data used in this study was collected before the emergence of more transmissible variants of SARS-CoV-2. Note also that this study did not control for indoor air quality and HVAC conditions in school classrooms. The extent to which masking, distancing, and high quality school HVAC systems can control infections caused by the new variants remains uncertain. |
| “Immunological Characteristics Govern the Transition Of COVID-19 To Endemicity”, by Lavine et a | SURPRISE “We are currently faced with the question of how the SARS-CoV-2 severity may change in the years ahead. “CoV-2 is an emerging virus that causes COVID. The virus has a high basic reproductive number (R0) and which is transmissible during the asymptomatic phase of infection, both of which make it hard to control. “However, there are four human coronaviruses (HCoVs) that circulate endemically around the globe; they cause only mild symptoms and are not a significant public health burden… “Our analysis of immunological and epidemiological data on endemic human coronaviruses (HCoVs) shows that infection-blocking immunity wanes rapidly, but disease-reducing immunity is long-lived [i.e., if you are infected, your sickness will be less severe]. “Our model, incorporating these components of immunity, recapitulates both the current severity of CoV-2 and the benign nature of (HCoVs), suggesting that once the endemic phase is reached and primary exposure is in childhood, CoV-2 may be no more virulent than the common cold.” |
| | |
| New Social Information: Indicators and Surprises | Why Is This Information Valuable? |
| “Anger Increases Susceptibility to Misinformation”, by Greenstein and Franklin | SURRPISE This paper provides additional support for the theory that increasing feelings of uncertainty and associated fears (due to multiple root causes) have also increased feelings of anger (a protective reaction against fear), which in turn have made people more susceptible to misinformation. “Anger did not affect either recognition or source accuracy for true details about the initial event, but suggestibility for false details increased with anger. In spite of this increase in source errors (i.e., misinformation acceptance), both confidence in the accuracy of source attributions and decision speed for incorrect judgments also increased with anger. See also: “Perceived Social Presence Reduces Fact Checking”, by Jun et al |
| “A Vicious Cycle: How Pandemics Lead to Economic Despair and Social Unrest”, by Saadi Sedik and Xu from the IMF | SURPRISE “In this paper we analyze the dynamics among past major pandemics, economic growth, inequality, and social unrest. We provide evidence that past major pandemics, even though much smaller in scale than COVID-19, have led to a significant increase in social unrest by reducing output and increasing inequality. “We also find that higher social unrest, in turn, is associated with lower output and higher inequality, pointing to a vicious cycle.” “Our results suggest that without policy measures, the COVID-19 pandemic will likely increase inequality, trigger social unrest, and lower future output in the years to come.” This raised the critical question about what those policy measures must be in order to avoid the vicious cycle the authors describe. At the “zero lower bound”, monetary policy is far less effective than it was when interest rates were higher and their reduction had a strong impact on demand. Monetary policy has been further weakened by high levels of private sector debt. As Furman and Summers note, this makes fiscal policy much more important. But the nature of that policy, not just the size of government deficits that support it, is also critical. Specifically, they point to the importance of using fiscal policy to fund investments that will increase long-term growth, and not just use it to fund transfer payments that support consumption in the short-term. However, few appreciate the obstacles that must be overcome to achieve this result. Larry Summers himself has written about the obstacles encountered by many infrastructure projects (e.g., see “A Lesson on Infrastructure from the Anderson Bridge Fiasco”). Similar problems will almost certainly be encountered by the very large investment in new electricity transmission lines that will be needed to implement the Green New Deal. More broadly, serious attempts to increase productivity and economic growth will inevitably confront the obstacles that have long bedeviled structural policy, not the least in the healthcare and education sectors that account for a substantial portion of US GDP. Whether the Biden administration will be willing to spend the substantial political capital required to overcome these obstacles remains to be seen. |
| “Middle-Class Redistribution: Tax and Transfer Policy for Most Americans”, by Looney et al | SURPRISE A frequently recounted summary of the past 40 years says that the political consequences of the relatively slow growth in US middle class incomes was partially offset by falling prices for many goods and services, made possible by offshoring and automation of production. The glaring exception to this was exponential growth in the cost of housing, education, and healthcare, which led to growing middle class frustration and anger (which has increasingly been targeted at the nation’s elites, whose income has grown much faster). This paper makes clear that the above story leaves out an important factor: How tax and transfer policies have been used (with much less public visibility) to prevent the middle class’s relative standard of living from falling even faster. Critically, the authors argue that this cannot continue. In turn, this puts even more pressure on the Biden administration address the structural obstacles to faster economic growth and more equal distribution of its benefits. “The “middle class” has benefitted from government redistribution in recent decades. For individuals in non-elderly households in the middle three income quintiles (the middle class), the share of federal taxes decreased, and the share of transfers increased. “Between 1979 and 2016, market income per person increased 39 percent. But when accounting for taxes and transfers income increased 57 percent. “Middle class income support, however, is a recent phenomenon. Before 2000, market income and income after taxes and transfers grew together. Since 2000, middle-class income after taxes and transfers grew three times faster than market income… “While these changes were effective in boosting the after-tax, after-transfer income of non-elderly middle-class households, we are less optimistic they will be sources of future growth for middle-income households. “Tailwinds from the “peace dividend” and increasing deficits have largely run their course. Even if deficits could remain at high levels, they cannot grow at high rates. “Additionally, the aging of the population and the retirement of the Baby Boomer generation results in a headwind against the further expansion of benefits for the non-elderly middle-class. “While increases in redistribution through the tax and transfer system are possible, raising the after-tax, after-transfer incomes of the middle class by the magnitudes achieved over the last two decades and financing it by increasing taxes only on top income households would require unprecedented tax rates.” |
| “Signaling Virtuous Victimhood as Indicators of Dark Triad Personalities”, by Ok et al | SURPRISE The authors find that, “individuals with Dark Triad traits — Machiavellianism, Narcissism, Psychopathy — more frequently signal virtuous victimhood, controlling for demographic and socioeconomic variables that are commonly associated with victimization in Western societies.” |
| “Is Marriage Becoming Irrelevant?” by Gallup | SURPRISE “Americans are less inclined now than in recent years to see marriage as critical for couples who have children together or for couples who plan to spend the rest of their lives together. “Fewer U.S. adults now than in past years believe it is "very important" for couples who have children together to be married. “Currently, 29% say it is very important that such a couple legally marry, down from 38% who held this view in 2013 and 49% in 2006. Another 31% of U.S. adults currently say it is "somewhat important" for couples with children to be married, bringing the total to 60% who consider it important to some degree. “Meanwhile, four in 10 say it is not too (18%) or not at all (22%) important. “In 2006, Americans were more than twice as likely to say it is very important (49%) for couples with children to wed as to say it is not important (23%).” |
| “The Long-Term Impact of the COVID-19 Unemployment Shock on Life Expectancy and Mortality Rates”, by Bianchini et al | SURPRISE This paper provides further evidence that the long-term economic, social, and political costs of COVID are very likely underestimated at this point. “We adopt a time series approach to investigate the historical relation between unemployment, life expectancy, and mortality rates… “We find that shocks to unemployment are followed by statistically significant increases in mortality rates and declines in life expectancy. “We use our results to assess the long-run effects of the COVID-19 economic recession on mortality and life expectancy. We estimate the size of the COVID-19-related unemployment to be between 2 and 5 times larger than the typical unemployment shock, depending on race/gender, resulting in a 3.0% increase in mortality rate and a 0.5% drop in life expectancy over the next 15 years for the over-all American population. “We also predict that the shock will disproportionately affect African-Americans and women, over a short horizon, while white men might suffer large consequences over longer horizons. “These figures translate in a staggering 0.89 million additional deaths over the next 15 years.” |
| “Deaths of Despair and the Incidence of Excess Mortality in 2020”, by Casey Mulligan | SUPRRISE More evidence of the long-term costs of COVID. “Weekly mortality through October 3 is partitioned into normal deaths, COVID, and non-COVID excess deaths (NCEDs). “Before March, the excess is negative for the elderly, likely due to the mild flu season. From March onward, excess deaths are approximately 250,000, of which about 17,000 appear to be a COVID undercount and 30,000 non-COVID. “Deaths of despair (drug overdose, suicide, alcohol) in 2017 and 2018 are good predictors of the demographic groups with NCEDs in 2020. “The NCEDs are disproportionately experienced by men aged 15-55, including men aged 15-25. Local data on opioid overdoses further support the hypothesis that the pandemic and recession were associated with a 10 to 60 percent increase in deaths of despair above already high pre-pandemic levels.” |
| 2021 Edelman Trust Barometer. This analysis of public trust in various institutions is published annually ahead of the World Economic Forum. | January to May saw significant increase in trust in government across developed nations. However all governments lost between May and Jan21. Both US and Chinese national governments suffered substantial falls in public trusts. In many countries, business os now more trusted that government, media, and NGOs. Trust in all information sources now at record lows (search engines, traditional media, social media). |
| | |
| | |
| | |
| | |
| | |
| New Political Information: Indicators and Surprises | Why Is This Information Valuable? |
| After months of telling his supporters that the election was going to be stolen, and then claiming it was after he lost, on 6Jan21 Donald Trump urged his followers to come to a rally in Washington to protest. There he gave a speech that many claimed incited them to march to the Capitol, where they violently overcame relatively light police protection and entered the building intent on disrupting the Congressional certification of the Electoral College’s results, which would formally make Joe Biden the next president. Less than a week later, Trump was impeached for the second time on the charge of inciting insurrection. Unlike Trump’s first bill of impeachment, this time a number House Republicans voted for it. | SUPRRISE Much has and will be written about how the United States got to this point, and what the consequences will be going forward. From a political perspective, our initial reaction is that, assuming the populist right is discredited by the sacking of the Capitol, this will likely strengthen the political center (i.e., moderate left traditional Democrats and moderate right Republicans) and enable it to more easily resist pressure from both populist extremes. |
| Earlier on 6Jan, final results showed that Democrats had picked up both Senate seats in Georgia’s runoff election. The US Senate will now be evenly balanced between Democrats and Republicans, with Vice President Kamala Harris having the tie-breaking vote. | SURPRISE While not stated in the US Constitution (and still subject to a court challenge), the Senate’s filibuster rule requires a supermajority of 60 Senators to end debate on a bill, and move it to a vote. This would require 10 Republicans to side with the Democrats, assuming all 50 support a bill. Whether there are 10 votes remains to be seen. However, the result of the Georgia election will not give control of the Senate agenda to Democrats, but will also strengthen the relative power of Senate centrists, assuming the filibuster rule remains. On balance, this is a positive development, previous uses of unilateral presidential power (i.e., executive orders) to implement controversial policy changes (e.g., Obamacare) rather than bipartisan legislation (e.g., Civil Rights reforms) has had two negative effects. First, it has increased partisan polarization. Second, it has made US policy more volatile, as with a stroke of a pen a new president can undo substantially more policy than in the past. |
| “The Five Crises of the American Regime” by Michael Lind | “In the past eight months, two capitol hills have fallen. Two sacking events symbolize the abdication of authority by America’s ruling class, an abdication that has led to what can be described, not without exaggeration, as the slow-motion disintegration of the United States of America in its present form. “The first occurred on June 8, 2020, when the Seattle police evacuated their East Precinct building in the city's Capitol Hill neighborhood. Left-wing rioters stormed the police headquarters and looted it. For 24 days, Seattle’s government allowed would-be revolutionaries to create an anarchist commune, acting out the fantasy of “abolishing the police” embraced by much of the American left as well as liberals who should have known better. “This anarchist commune, created in the midst of nationwide protests against the death on May 25 of a Black Minnesotan, George Floyd, in police custody, was the scene of the fatal shootings of two Black men before the police finally shut it down on July 1. On Jan. 6, 2021, America’s elite abandoned another Capitol Hill to rioters. After President Donald Trump stirred them up in an incendiary address in which he claimed that Joe Biden had stolen the presidency from him, a mob of right-wing radicals broke into the United States Capitol, where the certification of the results of last November’s election results was taking place. Like the leaders of Seattle in June, America’s congressional leaders fled… “As in Seattle’s Capitol Hill, so in America’s: The forces of legitimate authority and coercive order for a period were nowhere to be seen. “What is the meaning of these dystopian scenes? Many Democrats claim that Republicans are destroying the republic. Many Republicans claim the reverse. They are both correct… “The political crisis is the centralization of power in a small number of ambitious elite factions and coteries… “Neither America’s partisan leaders nor their militant followers are any longer restrained by a common sense of cross-party solidarity and shared American patriotism… “The leaders of both parties have weaponized anarchic mobs against their rivals … Combine the rise of social anomie with social (actually antisocial) media, and our warring political factions can summon mobs of alienated, mostly young militants anywhere in the country on short notice, overtly like Trump or discreetly from behind the scenes, like Democratic donors and politicians through the local NGOs they fund. The flash mob, originally used for fun, has now been weaponized for street warfare by Democratic and Republican party leaders… “The rise of unmarried and childless young Americans in their 20s and 30s who can be mobilized by left and right for unrestricted partisan warfare is part of a larger demographic crisis… “Most of the jobs that the U.S. economy has created for the past few decades have been poorly paying. That isn’t going to change soon… Remember the predictions in the 1990s that those who lost well-paid unionized jobs in the manufacturing sector would mostly get new, better-paying jobs in the “knowledge economy”? Didn’t work out” … “In many different societies, at all stages of development, there tends to be a correlation between political violence and the share of the population made up of unemployed or underemployed young men." |
| Motivated, perhaps, by a growing sense of foreboding, a number of recent analyses and essays have explored the deep roots of the worsening political conflict in the United States and other nations. | |
| “America Is Exceptional In The Nature Of Its Political Divide”, by Pew Research | “Supporters of Biden and Donald Trump believe the differences between them are about more than just politics and policies. A month before the election, roughly eight-in-ten registered voters in both camps said their differences with the other side were about core American values, and roughly nine-in-ten – again in both camps – worried that a victory by the other would lead to “lasting harm” to the United States… “The U.S. is hardly the only country wrestling with deepening political fissures. Brexit has polarized British politics, the rise of populist parties has disrupted party systems across Europe, and cultural conflict and economic anxieties have intensified old cleavages and created new ones in many advanced democracies. “America and other advanced economies face many common strains over how opportunity is distributed in a global economy and how our culture adapts to growing diversity in an interconnected world. “But the 2020 pandemic has revealed how pervasive the divide in American politics is relative to other nations. Over the summer, 76% of Republicans (including independents who lean to the party) felt the U.S. had done a good job dealing with the coronavirus outbreak, compared with just 29% of those who do not identify with the Republican Party. This 47% gap was the largest gap found between those who support the governing party and those who do not across 14 nations surveyed. “Moreover, 77% of Americans said the country was now more divided than before the outbreak, as compared with a median of 47% in the 13 other nations surveyed.” |
| “America Has Serious Problems. It’s Time to Stop Blaming Them on Trumpism”, by Quillette Magazine | “Quillette is not an American media outlet. Insofar as we’ve offered commentary on Donald Trump and the 2020 election, our editorial focus has been aimed at the social, cultural, technological, and academic factors that lie upstream from electoral politics more generally. “To the extent our writers embrace any political agenda, they typically have opposed the centrifugal forces that are acting on western democracies—including both crude populism on the Right, and anti-liberal doctrines of race and gender on the Left. “What we have observed, time and again, is that these two forces feed off each other. And to the extent anything called “Trumpism” actually exists, it will only be nourished by liberals’ insistence that the president’s appeal is rooted solely, or even primarily, in “white supremacy” … “Astonishingly, Trump earned a larger share of non-white voters than any Republican presidential candidate of the last 60 years. Only a true political cultist could imagine that allof these people are “white supremacists” … “The main reason Trump lost this election is that his support plummeted markedly—an 18 point drop, if exit polls are to be believed—among white men. All in all, the United States just observed a 16 percent decrease in the racial voting gap, as compared to 2016… “Trump rose to power on the idea that the “elites” despise the values and concerns of ordinary citizens. Even as his presidency enters its twilight, those same elites seem intent on vindicating his thesis." |
| “How Late Liberalism Undermines Itself”, by Nick Timothy | “Just as surely as the French Revolution devoured its children, modern-day liberalism is eating itself, and destroying with it all the norms and institutions that help complex societies to mediate differences. “As liberalism grows illiberal, as it turns its back on pluralism, its universalism gives way to relativism, and its belief in the inevitability of progress is contradicted by live events; its contradictions and failures mount. “Just like other tired ideologies and struggling regimes, it sinks into a state of conflict with the people it claims to understand and does what declining systems of government always do: it bestows privilege and prizes upon its favorites, while disregarding the suffering and needs of those it does not favor… “Identity-obsessed liberalism ends up causing tensions and rivalries between the groups it is supposed to support. But this is nothing compared to what it does to attitudes towards the majority group. Militant identity politics requires continuous evidence not only of disadvantage but discrimination and the oppression of identity-based groups by society in general and white people in particular. “Discrimination and disparities in the experiences of people from different ethnic backgrounds undoubtedly continue. But we cannot hope to build a tolerant, trusting society capable of overcoming differences in values and interests without customs and institutions that help to forge shared identities and a peaceful common life. “Militant identity politics attacks these very things. It undermines trust in civic, legal, and democratic institutions. It can be repressive for individuals, who are expected to conform by expressing their views only through the prism of their group identity. “And it can undermine people’s affiliation with other, vital identities, such as their attachment to their immediate locality, region and nation. The culmination of this cultural liberalism, in Jonathan Haidt’s words, is no longer the politics of our common humanity, but the politics of the common enemy… “Herein lies the explanation of how liberalism brought about the West’s division, disorder, and decline. Like all other ideologists, liberals are engaged in a rebellion against human nature. "They want to make the world something it is not, and something it can never be. They want to force people to conform to the expectations of their theories. And they hate the people — and the communities, traditions, and institutions they hold dear — when they fail to conform. "They are, as Burke said of Rousseau, lovers of their kind, but haters of their kindred. Their liberal utopia, like all utopias, is proving to be unavoidably oppressive. Those who challenge the liberal version of progress are deemed irrational, nefarious, or bigoted. And the wanton destruction of unifying traditions and institutions makes the mediation of clashes in values and interests impossible. The result is social breakdown, violent disorder, and a state that can no longer even keep the peace.” |
| “Despised: Why the Modern Left Loathes the Working Class”, by Paul Embery | As Henry George notes in his review of this book about UK politics, “In the book’s opening chapter, entitled “The Gathering Storm,” Embery sifts through the rubble of 2019, a blasted landscape of shattered Labour hopes in which the working-class have been cleaved from their old tribal loyalties. "Given his repeated warnings that something like this would happen, his bitterness is understandable. But his anger is matched by affection for the people and places that made him who he is. “Of his old home in the London borough of Barking and Dagenham, he writes: “We were rooted. We were parochial. We were among family and friends. People looked out for each other, and there was a tangible social solidarity.” "Economics isn’t everything, however, because people pursue lives of purpose and meaning as well as economic growth and innovation. Elite “economism” ignores “the reality that most workers didn’t see themselves merely as some kind of stage army in a war against capitalism. They were social and parochial beings for whom a sense of cultural attachment — around such things as tradition, custom, language, and religion — meant much.” "As such, Embery argues that mass immigration has been profoundly unsettling to a place like Dagenham and its people. In 2001, just over 80 percent of residents in the borough were “white British.” A decade later this was a minority, a phenomenon repeated in cities across the country. “It wasn’t a sense of race that was violated, Embery argues, but a sense of order. As a result of Labour’s indifference to their own voters’ concerns, these same voters elected the far-Right British National Party to the local council. “As the full impact of the new global market began to take hold,” he writes, “and as their lives and community were subjected to rapid and unprecedented economic and demographic change, their expressions of anxiety and discontent fell on deaf ears. They soon came to realise that not only was much of the liberal establishment impervious to their plight, it actively despised them.” “This value clash is epitomised by Labour’s increasing investment in both state-led multiculturalism and progressive identity politics… “Embery pushes beyond the tired complaints about “wokeness” to attack this pseudoradicalism as the latest solvent on both class and community solidarity. “Splitting people into mutually exclusive groups defined by immutable characteristics destroys any possibility of class radicalism. Of course, prejudice and bigotry against minorities are reprehensible, but as Embery points out, “The sheer venom that is often directed at people for simply holding a belief that until fairly recently was regarded as the conventional wisdom” is the sign of a new orthodoxy that brooks no ideological heresy.” |
| “A Loss of Direction and the Rise of Populism”, by Juhasz and Toth | “There are two competing populisms, both of which condemn the prevailing neoliberal order. “Right-wing populists claim they ventriloquize the concerns of a religious, moral, and hardworking but silent majority. They are perceived by the political center as the primitive ghosts from an unenlightened past. “Left-wing populists demand more progressive welfare oriented policies, total “equality” and an end to “repression” under the label of democratic socialism. The political center views left wing populism as a mortal danger to the delicate mixed economy. “These two populisms are engaged in a bitter struggle, and both battle the mainstream moderate Left and Right. “For many people, this configuration is horrifyingly reminiscent of the fatal internecine struggles of the interwar years. But we are not witnessing a simple resurrection of the radicalization of the interwar years… “Things are not the same. The slogans of the new populists are reminiscent of the historical Left and the radical Right, but to a large extent they have switched positions. The Left became the voice of the educated progressive urban upper middle classes. The populist Right became radical—if not revolutionary—against the straitjacket of the progressive and secular order… “Fear, anger, rage, hatred, and fury are turning to wrath, and the demonization of opponents. Political crisis is palpable.” |
| | |
| | |
| | |
| | |
| New Financial Markets and Investor Behavior: Indicators and Surprises | Why Is This Information Valuable? |
| “Waiting For The Last Dance The Hazards Of Asset Allocation In A Late-Stage Major Bubble”, by legendary investor Jeremy Grantham | Grantham makes two key points. The first is about the present state of various asset classes: “The long, long bull market since 2009 has finally matured into a fully-fledged epic bubble. Featuring extreme overvaluation, explosive price increases, frenzied issuance, and hysterically speculative investor behavior, I believe this event will be recorded as one of the great bubbles of financial history, right along with the South Sea bubble, 1929, and 2000.” Grantham’s second, and equally important one, is about why warnings to investors about downside risks are still all-too-rare. "The combination of timing uncertainty and rapidly accelerating regret on the part of clients means that the career and business risk of fighting bubbles is too great for large commercial enterprises… “Their best policy is clear and simple: always be extremely bullish. It is good for business and intellectually undemanding. It is appealing to most investors who much prefer optimism to realistic appraisal, as witnessed so vividly with COVID. And when it all ends, you will as a persistent bull have overwhelming company. This is why you have always had bullish advice in bubbles and always will." |
| “Global Markets Are Partying Like It Is 2008 (But a Crash Is Coming)”, by Desmond Lachman from AEI | “In late 2008, at a meeting with academics at the London School of Economics, Queen Elizabeth II asked why no one seemed to have anticipated the world’s worst financial crisis in the postwar period. “The so-called Great Economic Recession which had begun in late 2008and would run until mid-2009, was set off by the sudden collapse of sky-high prices for housing and other assets —something that is obvious in retrospect but that, nevertheless, no one seemed to see coming. “It would seem all too likely that now we are about to make the same mistake by being too sanguine about today’s asset and credit market bubbles. “Certainly, the U.S. and global economies have snapped back well from the depths of the coronavirus economic recession “It is also beyond doubt that effective vaccines have been developed and are now being distributed. However, as the Bank for International Settlements keeps warning us, global asset and credit market prices have once again risen well above their underlying value — in other words, they are in bubble territory. “In addition, as our health experts keep warning us, we still have to get through a dark coronavirus winter before a sufficient part of the population has been vaccinated to allow a return to economic normality. “Considering the virtual silence among economists about the danger today’s bubbles pose and about the risk of another leg down in the global economy, one has to wonder whether in a year or two, when the bubbles eventually do burst, the queen will not be asking the same sort of question.” |
| “How Selling To Yourself Became Private Equity’s Go-To Deal”, by Kaye Wiggins in the Financial Times | Like sky-high valuations and a new profusion of SPAC listings, PE firms selling their portfolio companies to themselves is almost certainly still another bubble indicator. “Private equity firms have a new set of buyers for their portfolio companies: themselves. “Blackstone, EQT, BC Partners and Hellman & Friedman are among the buyout groups to have sold companies to funds that they control this year, or made plans to do so. “Although the model emerged before the pandemic, its use has been ignited by it. Lazard estimates that the value of such deals will hit $35bn this year, up from $7bn just four years ago. “With the crisis leaving corporate boards warier of doing deals, the private equity industry has found it harder to keep its simple promise to investors of selling portfolio companies to outside buyers after a set period of ownership… “The immediate post-Covid recession caused declines in M&A markets and in the ability of [private equity firms] to exit those businesses by selling them or taking them public,” said Holcombe Green, global head of private capital at Lazard. “When traditional routes to exit are reduced, the owners start to look for an alternative.” “These transactions allow firms to hang on to good companies — an attractive prospect as the industry’s $2.5tn pile of unspent money drives up the competition for new acquisitions. “They also provide a solution if a buyout fund nears the end of its ten-year life but has not yet sold its portfolio companies. “To execute [these sales], a private equity firm creates a so-called continuation fund, finds investors to back it and then uses it to buy a portfolio company already owned by one of its other funds.” |
| “Scams In Modern Societies: How Does China Differ From The World?” by Jeff Yan | If you spend enough years working in business and finance in countries around the world, you become a connoisseur of scams and corruption. The creativity displayed is often impressive. More than once, I’ve found myself thinking that the perpetrators could have been very legitimately successful if only they’d applied their obvious talent to honest pursuits, say at a private equity firm… So it was with that background I read this paper and found it fascinating. |
| | |
| | |
| | |
| | |
System Tipping Points/Critical Threshold Analysis
Like Professors Andrew Lo, Doyne Farmer and others, we regard financial markets as a complex adaptive system (CAS), that exist as part of a larger macro system comprised of other CAS between which there are multiple feedback loops. These other systems include those that produce technology innovations, and economic, environmental, national security (including cyber), social, demographic, and political outcomes.
We also find that these systems tend to operate and generate effects in a rough chronological sequence, albeit with many feedback loops between them. The following chart highlights that the changes we observe in different areas at any point in time are actually part of a much more complex evolutionary process.
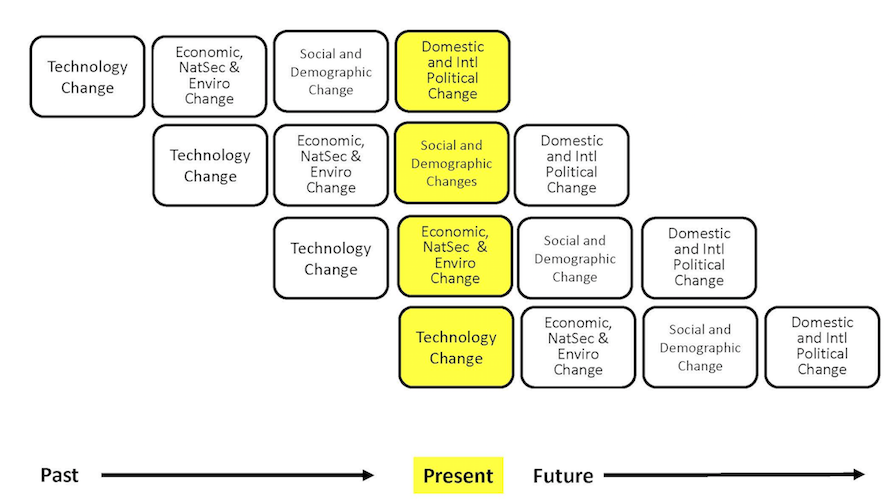
While most media coverage of these systems focused on flows (e.g., the size of the government deficit), rapid non-linear change in complex adaptive systems is often caused by a key stock (e.g., the amount of outstanding government debt) exceeding a critical threshold.
The next table highlights the key macro system stocks that we monitor.
In the next section, we will discuss information received over the past month that is related to these stocks, and which we believe is significant to our assessment of the probabilities that a critical threshold will be reached and a regime change will occur. We will conclude with our estimate, at the end of this month, of how close the macro system is to these critical thresholds, and the implications for financial market regime change probabilities.
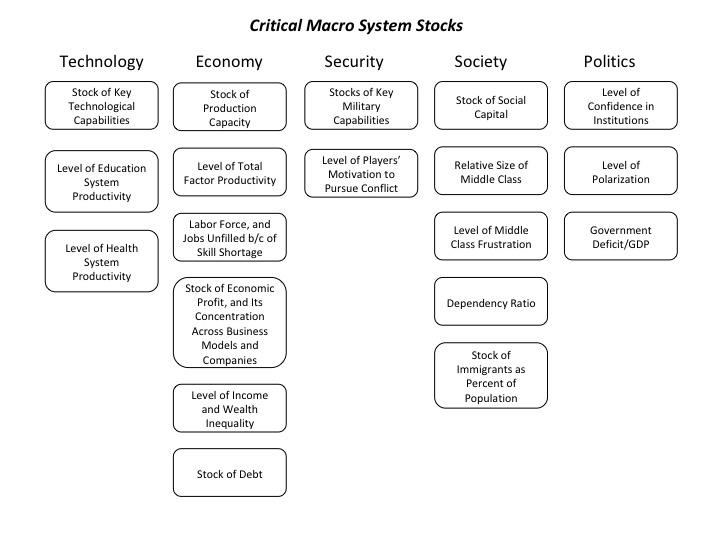
How Close is the Macro System to One or More Critical Thresholds?
As we have noted, the macro drivers of financial market regime changes typically follow a rough chronological sequence, from technology to economic, security, social, and political causes and effects. Yet there are many feedbacks loops between them, creating complex root causes for many of the critical thresholds we have identified.
Understanding the time dynamics in this complex system is critical to avoiding substantial downside investment risk.
We use the UK Met Office Warning Model to communicate our assessment of these time dynamics. We estimate the time remaining before a critical macro system threshold is reached that could trigger a regime change, which is usually accompanied by substantial changes in asset class valuations.
The model uses three increasingly serious levels of warning, from “Be Aware” (condition yellow), to “Be Prepared” (condition orange), to “Take Action” (condition red).
For our purposes, we denote as “Be Aware” (yellow) critical thresholds that we assess to be three or more years away. We estimate that “Be Prepared” (orange) thresholds could be reached within 1 to 3 years. “Take Action” thresholds are very likely to be reached within one year.
Given their nature, we also note that in our three “wildcard” areas (Environment and Energy related; Disease and Human Caused Bioevents; and Cyber and Electromagnetic Events), our forecasts have higher levels of uncertainty.
The following charts summarize our current estimate of the time remaining before different critical thresholds will be reached.
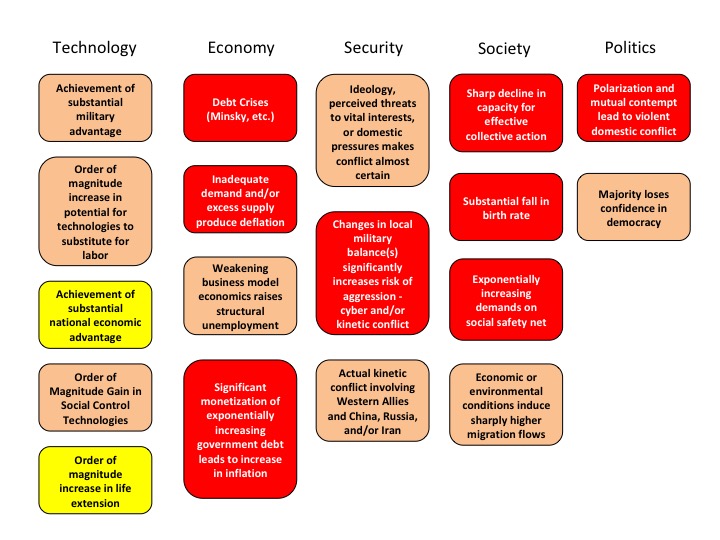
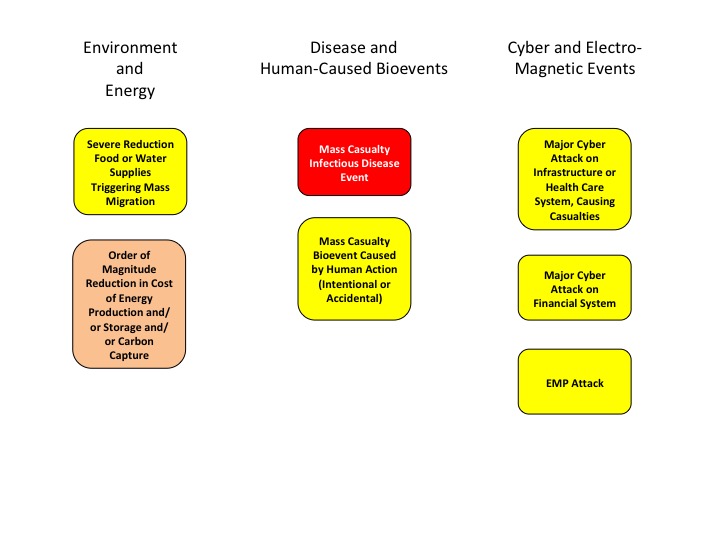
At the highest level, we believe the complex adaptive global macro system can be in one of four states, based on its degree of order versus disorder, and degree of social cooperation versus conflict. A very coarse-grained reading of history suggests that these states evolve in a predictable cycle, from ordered/cooperative, to disordered/cooperative, to disordered/conflicted, to ordered/conflicted.
We believe that the system is currently in its most uncertain state, characterized by high degrees of underlying disorder and social conflict, both domestically and internationally. Beyond some point, intensifying conflict eventually increases the degree of order in the system. That appears to be happening now, via the increasing conflict between China, Russia, and Iran and the United States and other Western nations.
If you have any questions about anything we have written in this issue, please don’t hesitate to get in touch, at contact@indexinvestor.com
Appendix: Anticipatory Thinking and Forecasting Methodologies
Our process is based on methods and tools developed over the past seven years at our affiliate, Britten Coyne Partners, which provides consulting services and education courses to executive teams and boards on strategic risk governance and management.
At The Index Investor, we engage in both anticipatory thinking to identify what could happen (e.g., different macro regimes and related events), and forecasting, to estimate the probability that events and regimes will happen, and the impact they will have if they do (e.g., on macro variables and broad asset class returns).
With respect to what could happen, we are acutely conscious of the conclusion reached by a 1983 CIA study of failed forecasts: "each involved historical discontinuity, and, in the early stages…unlikely outcomes. The basic problem was…situations in which trend continuity and precedent were of marginal, if not counterproductive value."
When it comes to forecasting, we know that in complex socio-technical systems that are constantly evolving, the accuracy of statistical or machine learning based forecasting methods declines exponentially as the time horizon lengthens, since the historical data set on which they were trained will (depending on the speed and effectiveness of any retraining cycle) bear less and less resemblance to the distribution of outcomes the system is likely to produce in the future.
Under these circumstances, forecast accuracy over longer time horizons depends on causal and counterfactual reasoning about the possible future effects of multiple interacting trends and uncertainties that are hard to quantify.
And we are acutely aware of the economist Rudi Dornbusch's famous warning: "Crises take a much longer time coming than you think, then happen much faster than you would have thought."
Our forecasting process also draws on lessons Tom Coyne learned from spending four years as a member of the Good Judgment Project team, which won the Intelligence Advanced Research Projects Activity’s forecasting tournament with forecast accuracy that was more than 50% better than the tournament's control groups (the team's experience is described in Professor Philip Tetlock's book, “Superforecasting").
Our analysis focuses on the probability of the global macro system being in four possible macro regimes 12 and 36 months from the date of our forecast: (1) Normal Times, where equity asset classes perform well; (2) a High Uncertainty regime that is usually short and transitory, where asset classes like short-term government bonds perform best and equities suffer significant declines; (3) High Inflation (which we deem 5% or more, year-on-year), where commercial property, real return bonds and other traditional hedges are favored; and (4) Persistent Deflation (a year-on-year decline in the US CPI), which up to now has only been seen in Japan, and in which the relative performance of different asset classes remains uncertain, but will likely favor high quality bonds and the consumer staples equity sector.
In response to subscriber requests, we have added a 36-month regime forecast to our existing 12 month forecast. The logic is that, in a complex evolving system like global macro, a longer forecast horizon gets beyond the “detection range” of algorithmic forecasting approaches, and therefore raises probability that a manager/investor can gain an edge in identifying emerging threats and opportunities.
That said, because evolving (i.e., “non-stationary”) complex systems populated by highly connected human agents are also capable of sudden non-linear changes (with which are hard for algorithmic approaches to predict), we are also keeping our 12 month forecast.
Our forecasting methodology starts with base rate/reference case data about the historical probability of large changes in equity and bond valuations. We then analyze the current situation from both a quantitative and qualitative perspective. In the latter, we focus on the key endogenous drivers of macro regime change, including technological, economic, national security, social, and political trends and uncertainties. We also focus on three potential sources of exogenous shocks that could also produce a macro regime change, caused by environmental, disease, and cyber related events.
While most of our attention typically focuses on various flows (e.g., economic growth, change in the price level, sales, earnings, job creation, etc.), endogenously caused regime changes result when those flows push key stocks beyond a critical threshold or tipping point, often setting off non-linear reactions across multiple areas. As noted by Hyman Minsky and others, a classic example is the steady accumulation of outstanding debt until it reaches the point where it can no longer be serviced and triggers a crisis.
Base Rate Data
Since the end of World War Two, there have been fifteen months where a downturn in the US equity market began that eventually reduced asset class value by 20% of more. That is a hazard rate of about 1.75% per month. Put differently, in any given month there is a 98.25% probability that a 20%+ downturn won’t occur, or, in a given year, an 81% probability.
However, as the time without a 20%+ downturn extends, the compound probability that one will not occur shrinks. At the end of August 2018, it is more than nine years since the last equity market decline of 20% or more. The probability of that happening is only 15%.
To estimate the base rate for a 20% fall in bond prices (which historically has been caused by a sharp increase in inflation, as we saw in the late 1970s and early 1980s), we analyzed monthly historical AAA bond yields since 1919. For consistency, we used them to calculate the price of a ten-year zero coupon bond. We then calculated the probability of a price decline of 20% or more over three different holding periods: 12, 18, and 24 months. In any month, the annualized probability of a decline of 20% or more over the subsequent 12 months is 12%; over 18 months, 20%, and over 24 months, 25%.
Market Stress Indicators Methodology
We view financial markets as a complex adaptive system. The size of changes generated by such a system follows a power law rather than a normal (Gaussian) distribution. The critical point is that large changes are much more common in complex adaptive systems than most people’s intuition leads them to believe.
While predicting the behavior of complex adaptive systems remains far more art than a science, various researchers have found that large changes in such systems are often preceded by subtle warning signs, as stress accumulates within them. While this research is not definitive, we believe that five warning signs are worth monitoring as potential indicators of growing stress within financial markets that could suddenly give rise to large changes in asset class valuations.
Our first indicator is the month-to-month autocorrelation of broad asset class returns (i.e., the relationship of this month’s returns to last month’s). A system under increasing stress loses resiliency, causing it to take longer to recover from perturbations; hence, autocorrelation increases as it approaches a critical transition (see, “Early Warning Signals for Critical Transitions” by Scheffer, et al).
The second market stress indicator we monitor is the Economic Policy Uncertainty Index published by the Federal Reserve Bank of St. Louis (via its FRED economic database), which is based on research by Baker, Bloom, and Davis (see their paper, “Measuring Economic Policy Uncertainty”). The index is based on automated text analysis of leading newspapers and magazine publications, to identify the frequency with which words and phrases are used that indicate uncertainty.
In humans’ evolutionary past, when uncertainty increased the probability of survival was enhanced by staying close to a group. All of us still have that instinct. Research has found that as uncertainty increases, we have an unconscious bias towards higher conformity of our own views with those of a larger group (i.e., reduction in cognitive diversity). Behaviorally, heightened uncertainty induces more “social copying” of others, likely due to both conformity bias and the rational belief that others may be acting on the basis of superior information. This increase in conformity and copying makes a social system more ordered as uncertainty increases, and also reduces its responsiveness to perturbations (i.e., increases autocorrelation) because of delays in the social copying process.
The key point is that increasing uncertainty induces more, not less order in social systems, and in so doing primes them for sudden non-linear change.
Our third market stress indicator is the spread between the yield on AAA rated bonds and the 10-year US Treasury. This is a proxy for the level of investor concern about financial system funding liquidity.
Our fourth market stress indicator is the yield spread between speculative BB rated bonds and the ten-year US Treasury. Throughout history, excessive credit growth has been a root cause of many financial crises. An indicator of such growth is falling credit spreads, particularly in the case of riskier borrowers. In contrast, rising BB spreads indicate growing investor concern about the consequences of such growth, and the financial distress lower rated companies could experience in an economic downturn.
Our fifth market stress indicator is what we term the “political risk premium” that is implicit in the price of gold. Our starting point for estimating this premium is the three different roles that gold plays. First, gold is a store of value in a world of fiat currencies. When the rate of money supply growth exceeds the growth of nominal GDP, gold’s price should increase to maintain its purchasing power. Between 2007 and 2017, the US money supply (M2) grew by about 86%, while nominal US GDP grew by 35%. The stock of gold grew by 18%, based on mine production over this period. We therefore infer that 33% of the increase in the price of gold represented the maximum potential gold price change that could be attributed to a desire to hedge inflation risk (86% less 35% less 18%).
Second, gold is a unit of account. We take this to mean that the annual change in GDP expressed in terms of physical gold (i.e., nominal GDP divided by the price of gold) should equal the change in real GDP calculated using the GDP price deflator to account for actual inflation over the period. A key challenge is the point at which to start this calculation.
We chose the price of gold in 1995/1996. In that period, the change in real global GDP measured using the IMF’s price deflator just about equaled the change in GDP measured in terms of physical gold. We interpret that coincidence as indicating that at that point in time, concerns about future inflation and political risk were minimal, and the change in the price of gold was mostly driven by its role as a unit of account. We calculated a subsequent series of gold prices that would produce the same change in “gold GDP” as the actual real GDP as calculated by the IMF. Between 2007 and 2017, “gold as a unit of account” warranted a 21% increase in its price.
Gold’s third role is as a hedge against inflation and what we term “political disaster” risk. We subtract the 21% estimated compensation for actual inflation from the 33% “gross” inflation risk hedge to derive an apparent 12% increase in the gold price that reflected the true risk premium to hedge against possible future inflation. However, between 2007 and 2017 the price of gold actually increased by 81%. This implies that 48% of this (81% less 21% less 12%) represented a premium for some other type of uncertainty at the end of 2017. The interesting question is the nature of the uncertainty for which gold is believed by some investors to be a superior hedge than traditional ports in a storm like short-term US government securities, or similar securities issued by other developed countries.
The logical inference is that the uncertainty in question must reflect a situation in which short term US Treasuries would be a less effective hedge than gold. This could be a world of widespread hyperinflation, capital controls, and/or radical changes in nations’ governments (of course, this would also imply a preference for investing in gold coins rather than bullion, as while the latter may be a store of value, it is far less convenient as a means of paying for transactions).
To put this in further perspective, this gold price “disaster risk” premium sharply increased from 2008 to 2012, then declined before sharply increasing again after 2016. Arguably, a significant part of the former increase reflects concerns about the potential inflationary consequences of dramatic quantitative easing by central banks. But this is not likely to be the case after 2016.