The Index Investor
January 2020
Tactical Asset Allocation Implications of Our Forecasts
Forecast Logic
Combining and Extremizing Forecasts to Improve Predictive Accuracy
Forecast Pre-Mortem Analysis
Feature Article: Global Macro Risk Dynamics in the 2020s and Beyond
High Value Information Observed Last Month
Critical System Thresholds/Tipping Points Analysis
Appendix: Anticipatory Thinking and Forecasting Methodologies
Current Macro Forecast
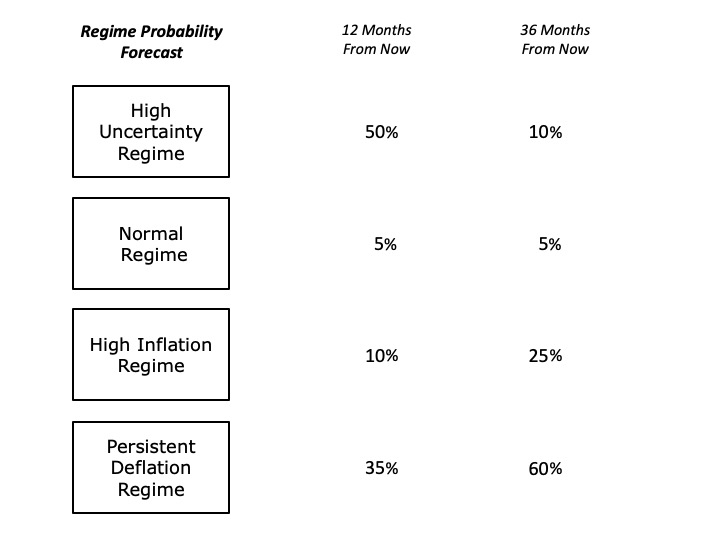
We conclude that 36 months from now we are most likely to be in the Persistent Deflation regime because of multiple factors weighing on aggregate demand, including population aging, weak productivity growth, high levels of both inequality and debt, and the threat of job displacement as increasingly capable automation and artificial intelligence technologies are deployed. At the same time, supply capacity in many sectors has increased (e.g., because of automation). In the United States, increases in the Consumer Price Index have been driven by rising prices for healthcare, education, and housing – not goods and other services. However, the drivers of price increases in all three of these sectors are weakening.
At this time, we view the High Inflation scenario as less likely than Persistent Deflation. An increase in US inflation caused by investor abandonment of US assets presupposes that other markets are deep and liquid enough to absorb large inflows, and are perceived as less risky than the United States. Both of these are very unlikely at this time. That said, a collapse in investor confidence in all fiat currencies (perhaps as a result of substantial and prolonged central bank money creation to finance increasing government fiscal deficits) would certainly lead to an increase in the price of gold and other hard assets (e.g., property and timber). However, absent a major change in relative exchange rates, it would not automatically drive up inflation. What could do this would be a sharp reduction in the supply of goods and services, either because of an external shock (e.g., as happened in the case of the 1973 oil price shock) or an internal shock (e.g., as we have seen in developing countries that mandated increased worker wages while raising taxes on companies to the point they were forced to close down).
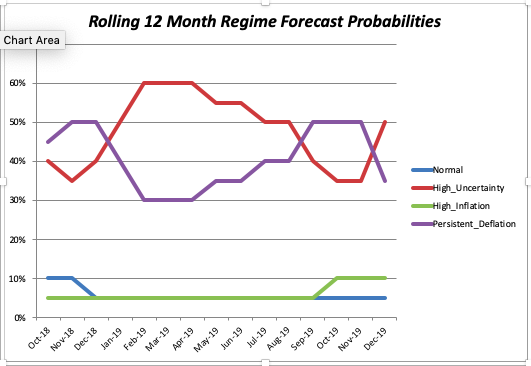
Over the next 12 months, we conclude that the High Uncertainty Regime is likely to prevail, with central banks increasing money supply in an effort to avoid a fall into prolonged Japan-style deflation (and in the US, to avoid charges that the Federal Reserve was trying to influence the outcome of the November election by raising interest rates and triggering an economic downturn).
Finally, with equity valuation metrics at or near record highs, while spreads on low quality credits are at or near record lows (especially after a ten year expansion) we believe the least likely outcome is a return to the Normal Regime, over either the next 12 or 36 months.
Portfolio Allocation Implications of Our Forecast
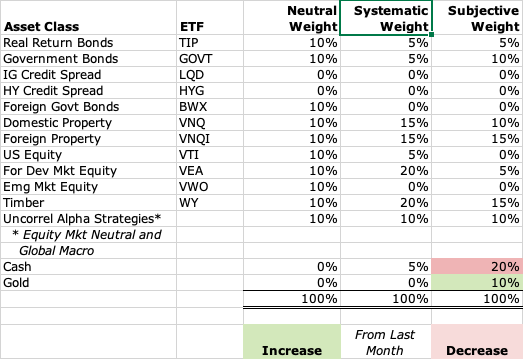
We take two approaches to deriving the tactical asset allocation implications from our analyses. The first takes a systematic approach, and is based on relative asset class valuations. Our starting point is our “neutral” model portfolio, which is equally weighted across nine broad asset classes, and also includes a 10% allocation to alpha strategies (equity market neutral and global macro) that are designed to have a low correlation to returns on broad asset classes. Based on asset class valuations, we systematically vary the asset class weights (but not the active strategy weight), increasing from 10% to 15% when an asset class is likely undervalued, and 15% when it is very likely undervalued. In the case of overvaluations, we go to 5% and then into cash, if there are no undervalued asset classes with room for an increase. In effect, this replicates the systematic rebalancing strategy we used for 15 years in our previous model portfolios.Based on subscriber requests, this month we are re-introducing a feature from the previous version of The Index Investor: Tactical Asset Allocation Implications from our analyses.
The second tactical approach is based on our subjective view not only of current asset class valuations, but also of the implications of the broader macro trends and uncertainties that we analyze each month. Importantly, this subjective view reflects our primary goal of avoiding large downside losses, rather than seeking large upside gains.
Two final notes: First, with respect to US fixed income, we include credit products (investment grade and high yield) in the same asset class as government debt, and will shift into the former when their valuations become attractive. Second, we regard gold not as a separate asset class to be held long-term, but rather as a complement to cash, into which we shift in periods of substantial overvaluation across multiple asset classes.
More information about our investment beliefs, including our core philosophy, approach to asset allocation (including our model portfolios and their long-term track record), and views on various approaches to active and passive management can all be found here.
Here is our tactical portfolio allocation view for January:
Forecast Logic: Quantitative Indicators
Implications of the Most Recent Three Month Asset Class Returns
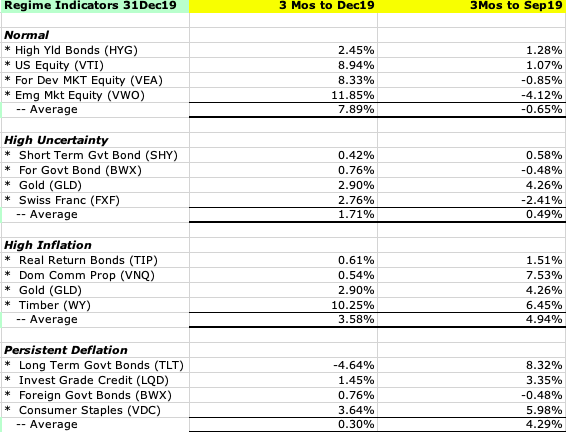
Our quantitative forecast methodology focuses on the level and change in three-month returns, over the most recent and previous three-month periods, for those asset classes, which should perform best under different regimes (in this sense, our regimes can be regarded as macro factors). We assume that relatively higher returns are associated with more widely held investor beliefs in the probability that a given macro regimes will develop in the future.
Over the last three months, there has been a relative strengthening of investors’ belief that the normal times regime lies ahead.
Asset Class Valuation and Momentum Indicators (@31Dec19)
| Asset Class (ETF) | Valuation | 1 Month Return | Conclusion |
| US Real Return Govt Bond (TIP) | Likely Overvalued* | 0.35% | Increasing Overvaluation |
| US Nom Return Govt Bond (GOVT) | Likely Overvalued* | (0.57)% | Decreasing Overvaluation |
| US Investment Grade Credit (LQD) | Likely Overvalued* | 0.47% | Increasing Overvaluation |
| US High Yield Credit (HYG) | Almost Certainly Overvalued* | 0.53% | Increasing Overvaluation |
| US Commercial Property (VNQ) | Likely Undervalued* | 0.73% | Decreasing Undervaluation |
| US Equity (VTI) | Likely Overvalued* | 2.80% | Increasing Overvaluation |
| Foreign Devel Mkt Equity (VEA) | Very Likely Undervalued* | 3.56% | Decreasing Undervaluation |
| Emerging Markets Equity (VWO) | Very Likely Overvalued* | 7.06% | Increasing Overvaluation |
| Timber (WY) | Almost Certainly Undervalued* | 3.49% | Decreasing Undervaluation |
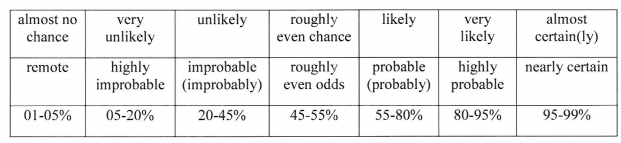
Note: The language we use to describe our estimated likelihood of asset class over or undervaluation is based on US Intelligence Community Directive 203 on Analytic Standards, which includes the following table:
Market Stress Indicators (@31Dec19)
| Market Stress Indicator | This Month vs Last Month |
| Asset Class Returns Autocorrelation (this month versus last month). Higher autocorrelation is an indicator of higher market stress. | .12 vs .12 last month. This indicates a low level of market stress. |
| Economic Policy Uncertainty Index (how many days over the last 30 was index in top quartile of values since 1985?) | On 12 days last month the index was in the top quartile of daily values since 1985 (the 76th percentile of all rolling 30-day periods). This is a substantial increase from 2 last month. |
| AAA Rated Bonds Spread over 10 Year Treasury Yield (month end). Higher spreads indicate rising concern about market liquidity. | 1.12% (43rd percentile since 1983), vs 1.30% at the end of Dec18. |
| BB Rated Bonds Spread over 10 Year Treasury Yield (month end). High spreads indicate increasing credit risk. | 2.02%, (11th percentile) down from 2.38% last month and 3.60% at the end of Dec18. Extremely low after ten years without a recession. |
| Gold Price per Ounce in US Dollars (month end). Rising gold prices are an indicator of increasing market uncertainty and stress. | $1,523 vs $1,456, up 4.6% from last month. At the end of 2017, we estimated the “disaster premium” in the gold price was 47% (see our methodology in the Appendix). At the end of last month it was 65%. (see our methodology in the Appendix). |
New Qualitative Evidence
Based on our qualitative analysis of accumulated and new evidence, we are considerably more pessimistic about the future than those investors whose trades have driven the returns on different asset classes. We continue to believe that three years from now the most likely outcome is that the global macro system will be in the persistent deflation regime.
In our forecasting approach, technology and environmental developments tend to precede economic and national security changes, which in turn precede social and political trends and events, whose effects then become visible in financial markets. As covered in more detail in this month’s Evidence File (see below), here are the most important new indicators and surprises that influenced this month’s changes to our regime probability forecasts:
Technology:
- The latest release of the Artificial Intelligence Index shows that, based on multiple metrics, the rate at which AI is developing continues to accelerate.
- There were also two very interesting new papers describing how agent-based modeling had been combined with deep learning methods to produce quite stunning new insights about the behavior of complex adaptive systems, including financial markets. This suggests that more knowledge workers than previously thought could be exposed to “technology substitution” risk sooner than expected.
Environment:
- New research highlighted the grid control and storage challenges involved in a fast transition to solar power generation. Another paper made it clear that widespread deployment of cost-effective decarbonization technologies seems far off.
- These are some of the reasons why another paper concluded that “the world is on a path to warm to around 3 degrees Celsius above pre-industrial levels by 2100.
Economy:
- France saw a worsening of strikes over President Macron’s proposed changes to public sector pensions that would reduce their underfunding. This could well be a preview of what will happen in other countries when they try to address the same problem.
- An article in the Financial Times noted that in Germany, business leaders and politicians are warning that “the pervasive lack of skilled labor poses a mounting risk to the country’s economy.” Improved education and training are clearly critical to meeting the equally critical challenge of increasing productivity growth when demographic changes are causing the size of the labor force to shrink in many countries. Yet in most nations, the education sector continues to resist needed reforms, which does not bode well for future economic growth.
- Central banks have been applying more monetary stimulus to the economy. In the US, president Trump will likely keep pressure on the Fed to continue this stimulus through the November election.
National Security:
- Along with a further tightening of economic sanctions, the United States’ assassination of Quasem Soleimani, a senior officer in the Iranian Revolutionary Guards Corps and architect of its use of proxy forces throughout the Middle East sharply increased uncertainty about how Iran will respond. At the same time, the Iranian regime’s attempted coverup of its downing of a Ukranian airliner further inflamed domestic opposition to its 40 year long rule.
- There were more articles and papers describing rising problems in China, which increases uncertainty about the durability of Xi Jinping’s hold on power and what could happen if he feels in imminent danger of losing it (e.g., more aggressive external action).
Society:
- There was more evidence about the United States’ increasing regional inequalities, and the rising frustration among many voters with the state of the economy, despite the apparently low unemployment rate (while the reported U3 measure of unemployment was at 3.5% in December, the broader and much less reported U6 measure was at 6.7%).
- In his article “The Real Class War”, American Affairs founder Julius Krein convincingly argued that status conflicts and resentment within the top 10% of US incomes (particularly between those dependent on labor income versus those whose income is based on capital returns) are having a much larger impact on US society and politics than most people realize, including providing the impetus for the “woke progressive” movement among affluent whites.
Politics:
- A number of new articles have argued that even if economic inequality is better addressed, cultural gaps between elites and the masses (like woke progressives’ focus on identity politics and restricting speech not deemed politically correct) will prove more durable and continue to sustain high levels of political polarization (and populism) in the years ahead.
- The New America foundation published a report on “Building U.S. Resilience to Political Violence.” The very fact that a respected think tank felt the need to do this is an important indicator of the state of political tensions in the US even before president Trump’s impeachment trial and the first primaries of the 2020 election begin.
Financial Markets:
- Multiple articles predict a decade of low returns in the 2020s, and question how long the high valuations in many asset classes can last.
- As levels of uncertainty rise and are expected to remain elevated for a significant period of time, fund flows into global macro strategies are increasing.
Note: Combining Our Forecasts with Others From Other Sources and Extremizing the Result Should Increase Your Predictive Accuracy
Research has found that three steps can improve forecast accuracy. The first is seeking forecasts based on different forecasting methodologies, or prepared by forecasters with significantly different backgrounds (as a proxy for different mental models and information). The second is combining those forecasts (using a simple average if few are included, or the median if many are). The final step, which significantly improved the performance of the Good Judgment Project team in the IARPA forecasting tournament, is to “extremize” the average (mean) or median forecast by moving it closer to 0% or 100%.
Forecasts for binary events (e.g., the probability an event will or will not happen within a given time frame) are most useful to decision makers when they are closer to 0% or 100% than the uninformative “coin toss” 50%. As described by Baron et al in “Two Reasons to Make Aggregated Probability Forecasts More Extreme”, forecasters will often shrink their probability estimates towards 50% to take into account their subjective belief about the extent of potentially useful information that they are missing.
When you average multiple forecasters’ estimates, you are including more information, which should increase forecast confidence and push the mean estimate closer to 0% or 100%. However, this doesn’t happen when you use simple averaging. For this reason, forecast accuracy is increased when you employ a structured “extremizing” technique to move the mean estimate closer to 0% or 100%.
You can download an extremizing model from our website to use when combining the forecasts you use in your decision process.
The extremizing factors in our model are those that the Good Judgment Project found maximized the accuracy of combined forecasts. Note that the extremizing factor is lower when average forecaster expertise is higher. This is based on the assumption that a group of expert forecasters will incorporate more of the full amount of potentially useful information than will novice forecasters.
Pre-Mortem Analysis
One of the most important forecasting disciplines is to ask yourself why your forecast could be wrong. Dr. Gary Klein’s research has shown that a very powerful and insightful way to do this is via a “pre-mortem analysis.” This method asks you to assume that it is a point in the future, and your forecast has been proven wrong (or your strategy or company has failed). You are then asked to look backward from this imagined point in the future, to explain why you failed, what you missed, and what you could have done differently to avoid your fate.
The pre-mortem method takes advantage of the fact that humans reason much more concretely and in more detail when explaining the past than they do when trying to forecast the future.
So let us assume that it is one year from now, and our current forecast has turned out to be wrong.
How did this happen? What developments did we fail to anticipate? Here are three possibilities:
- The leaders of the world’s three major powers – Xi Jinping, Donald Trump, and Vladimir Putin are all facing weakening economies and declining political popularity. History teaches us that this can lead to increased “foreign adventurism” to distract the public from worsening domestic conditions, as a nation rallies around its leader in a period of heightened external conflict. Should a “kinetic” conflict develop between China and the United States, or between Russia and one or more European countries (e.g., due to a Russian incursion into the Baltics), it would generate a very sharp increase in uncertainty that would likely cause an equally sharp economic slowdown which, given high debt levels, would speed the arrival of the Persistent Deflation Regime.
- While the probability is remote, a supply side shock of some type could produce a sudden increase in inflation – the most likely scenario being a reduction in oil supplies due to a prolonged kinetic conflict between Iran and the US that produced a extended disruption in global oil supplies, or, less likely, an infectious disease pandemic or major crop failures (e.g., due to climate change and/or agricultural disease).
- Another route to the high inflation regime (repeatedly noted by Bridgewater’s Ray Dalio) would be a sudden loss of confidence in the US dollar relative to other currencies (driving up import prices), perhaps because of deficit monetization and policy paralysis as a severe downturn continues. However, this would also require that there was relatively more confidence in another currency, with the Euro being the most likely candidate. This currently seems unlikely, given both the Eurozone’s economic and political situation, and the prospect of an intensifying conflict between the West and China. However, if confidence collapsed in all major currencies, a sharp increase in inflation would lead to a dramatic rise in the price of gold.
- Though we believe it is still unlikely, it is becoming easier envision a scenario in which both Xi Jinping and Donald Trump leave their current roles, and are replaced by leaders who are more committed to lessening the intensifying conflict between China and other nations. This would likely provide a strong boost to confidence (and thus lead to an equally strong reduction in uncertainty). However, a reduction in perceived external threats might also intensify already substantial internal divisions and conflicts in China and the United States, which could, ironically, also lead to the deflation regime.
Feature Article: Global Macro Risk Dynamics in the 2020s and Beyond
As I learned during the four years I spent as part of the Good Judgment Project, forecasting the behavior of complex adaptive systems like the global political economy and financial markets is actually not, as it often seems, an exercise in futility.
To be sure, it is extremely challenging, with the accuracy of even the best performers not much better than chance, particularly as the breadth of forecasting questions widens and the time horizon lengthens. Yet even a slight advantage in forecast accuracy can produce substantial benefits (e.g., see, “How Much Can Firms Know?” By Ormerod and Roswell, or “The Fundamental Law of Active Management”, by Grinold and Kahn).
It is with these lessons in mind that The Index Investor has prepared this forecast of critical global macro risk dynamics in the decade that lies ahead. Our goal is not to give readers yet another point forecast for one or more outcomes in either 2020 or later in the decade. There are plenty of those already.
Rather, our goal is to describe a methodology for thinking about the critical drivers and dynamics that will produce those outcomes, and thus a means for gaining a forecasting edge by being better able to identify and apply the high value information signals that are too often missed in the noise of the daily data overload we all confront.
Specifically, as we have often described in The Index Investor, our approach to global macro forecasting assumes that the changes we eventually observe in asset class valuations and returns are the end result of a roughly chronological process. At the earliest stage there are changes in technology and in the area of energy and the environment. These have a significant impact on changes in the economy and national security, which in turn affect change in the social and political spheres. In taking this approach, our goal is to better capture the roles of time and speed, and to make second and third order consequences more visible.
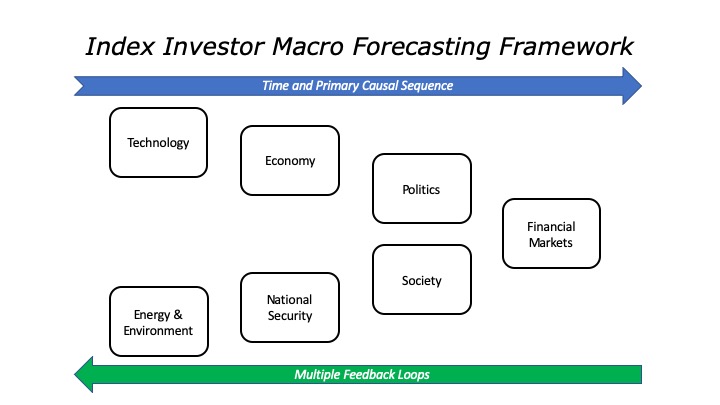
This chronological approach also contains multiple feedback loops, which drive the emergence of non-linearities and discontinuities that are usually hard to predict. However, by making explicit both causal drivers and time, it becomes easier to understand some, if certainly not all of the ways they could occur.
Before looking forward to the 2020s, let’s begin our forecasting exercise by looking back at the 2010s, specifically at key trends in each issue area that are almost certain to in some way affect outcomes in the decade ahead. As such exercises can easily generate long lists that become cognitively overwhelming, I’ll limit myself to just one driving trend in each area that I consider to have been the most important:
Technology: In the 2010s, we became a hyperconnected society, due to the rise of mobile, cloud, and social media technologies. Among many other effects, this made social learning and social copying much easier, which in turn made the population of public and investor opinions both much less diverse (particularly when uncertainty is high) and subject to much faster change than in the past.
Environment: While people may argue about the underlying causes, the data show the global ecosystem was becoming warmer, at an accelerating rate.
Economy: As evidenced by falling risk-free interest rates, aggregate demand remained weak in the aftermath of 2008’s global financial crisis, and continued to substantially depend on strong monetary policy stimulus and rising levels of debt.
National Security: Cyber (and its disruptive progeny, speed and autonomy) emerged as a critical domain for strategy, as well as offensive and defensive operations and tactics.
Society: In many nations, populations became older on average, as both birth and death rates decreased. Given historically low rates of productivity improvement, this put downward pressure on demand growth and upward pressure on government costs.
Politics: In many countries, centrist parties weakened as growing frustration (particularly among the middle class) with the inability (or perceived unwillingness) of government to address problems that have significantly worsened their quality of life drove more voters to more populist leaders and political parties at different ideological extremes.
In the 2020s, these trends will interact with the outcomes of critical uncertainties in different issue areas. These complex interactions will produce the emergent outcomes we will observe in financial markets.
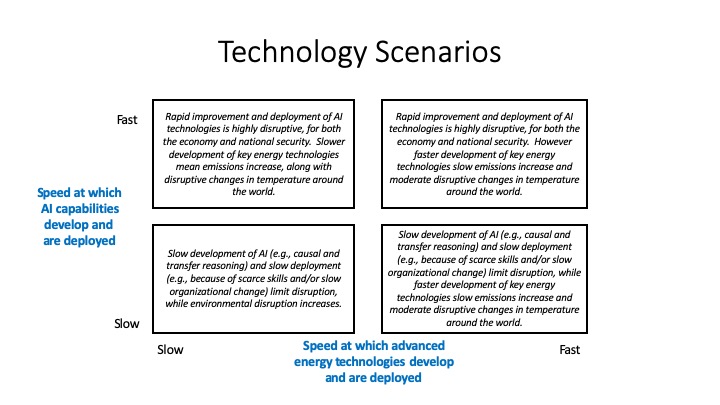
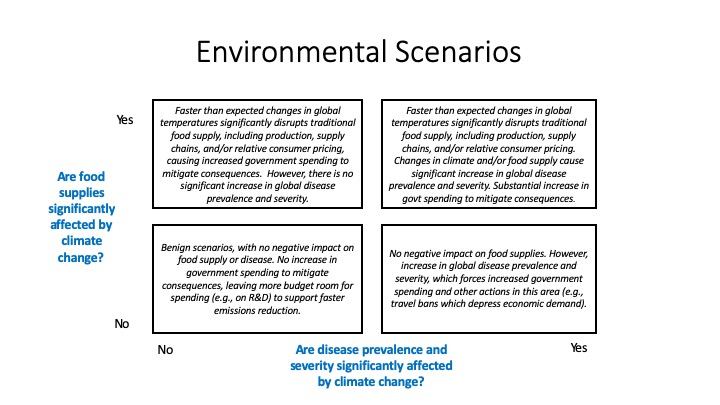
To make this forecasting problem tractable, our process begins by focusing on the interaction of two critical uncertainties in each issue area, as shown in the following six charts:
Technology
The two uncertainties driving these scenarios are: (1) The speed at which artificial intelligence capabilities (possibly enhanced by quantum computing technologies) develop and are deployed (e.g., their deployment will increase the speed at which many activities and processes are carried out, and may also, depending on the rate at which education systems improve, require fewer human workers), and (2) The speed at which advanced energy technologies (e.g., batteries and other energy storage, grid control, solar, and carbon capture) are developed and reach a level of cost effectiveness that allows them to be effectively deployed at scale without sharply increasing consumer energy prices.
The two uncertainties driving these scenarios are: (1) Whether food supplies are significantly affected by climate change, and (2) Whether infectious disease prevalence and severity are significantly affected by climate change.
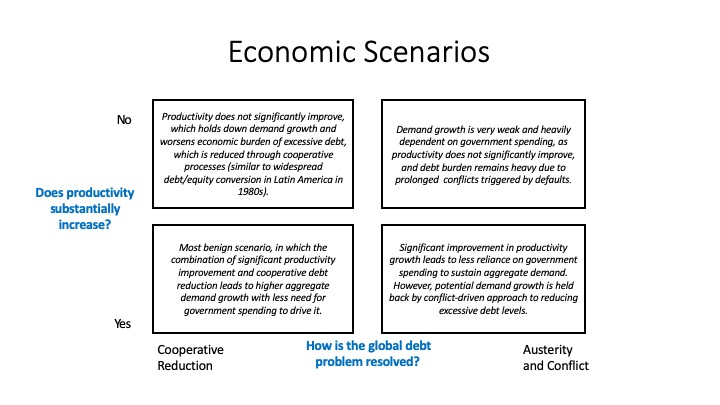
The two uncertainties driving these scenarios are: (1) Whether and to what extent average productivity increases, and (2) How the global debt problem (including governments’ off balance sheet liabilities for future pension and healthcare costs) is resolved.
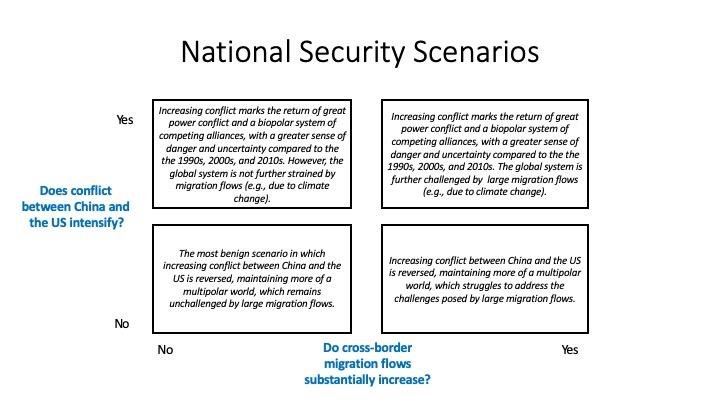
The two uncertainties driving these scenarios are: (2) Whether the China-US conflict intensifies, and (2) Whether cross-border migration flows substantially increase.
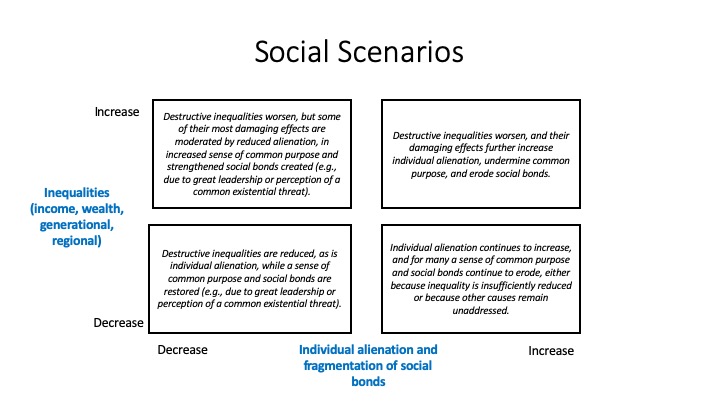
The two uncertainties driving these scenarios are: (1) Whether income, wealth, generational, and regional inequalities decrease or increase, and (2) Whether the level of individual alienation fragmentation of social bonds and cohesion decreases or increases.
The two uncertainties driving these scenarios are (1) Whether political polarization increases or decreases, and (2) Whether national capacity for taking collective action to address critical issues increases or decreases.
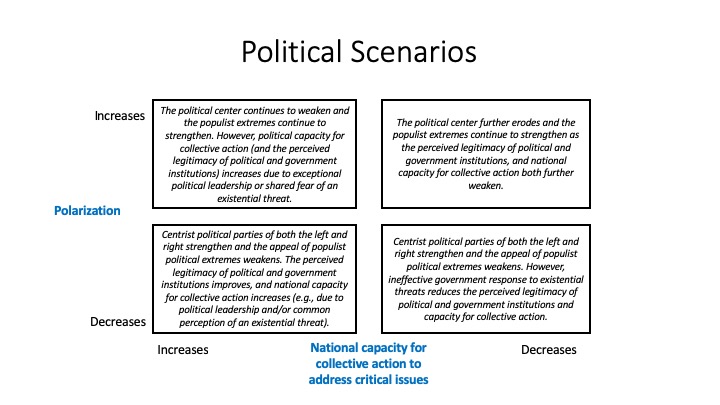
As you can see, these scenarios are consistently presented, so that the most benign outcome is in the lower left quadrant, and the most challenging is in the upper right quadrant.
Even after using this approach to reduce the dimensionality and complexity of our global macro forecasting challenge, we are still left with a seemingly unwieldy 4,096 (4 to the 6th power) scenarios, if we assume all combinations could occur. However, that is very likely not the case, because developments early in our chronological causal chain tend to drive or constrain developments later on.
For this reason, we use these scenarios as tools for reasoning both forward and backward in time to better understand the dynamics that could produce different financial market outcomes, and to identify potential sources of future non-linearities and discontinuities.
This method also makes it much easier to gain an edge by developing early warning indicators and more efficiently sifting through the daily data deluge to identify high value information that is much more likely to be observed (or not observed) if a particular outcome for a critical uncertainty is developing.
Both individually and in combination, these scenarios make it painfully clear that very substantial challenges lie ahead in the 2020s, which will create far higher levels of individual and collective uncertainty than a majority of people alive today have ever experienced.
Yet in the course of history, we have been here many times before.
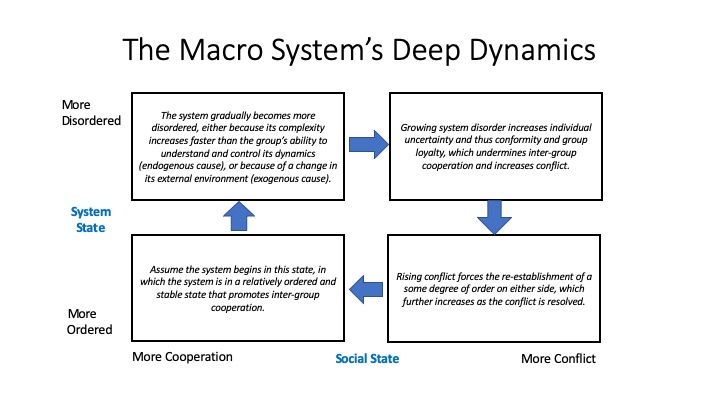
Beneath the drivers and uncertainties in different issue areas, our reading of history and complex adaptive systems theory suggests that there are even deeper dynamics at work, which are driven by interacting degrees of system order/disorder and social cooperation/conflict.
The chart below sums up our understanding of these dynamics:
For example, it is often said that the 60s really began with John F. Kennedy’s assassination in November 1963, and ended with Richard Nixon’s resignation in August 1974 (or when the US suspended the exchange of US dollars for gold at a fixed exchange rate in August 1971 – take your pick). To cite a second example, the period from 1910 to 1919 clearly included two very different historical periods, one leading up to August 1914, and the other by World War 1 and its aftermath.
The limitation of decadal analyses is equally when applying my macro system’s deep dynamic model. However, even with that caveat you can still see how the growing disorder and conflict of the 1930s gave way to the more ordered by still conflict ridden 1940s (which produced the collapse of Germany and Japan, and of democracy in Eastern Europe and China), which in turn evolved into the relatively more ordered and cooperative 1950s.
These then gave way to the increasingly disordered, but still cooperative 1960s, and then the disordered and relatively conflict ridden 1970s. The system became more ordered again as conflict intensified in 1980s, which ended with the fall of the Berlin Wall and dissolution of the Soviet Union. This was followed by the more ordered and cooperative 1990s.
Yet once again disorder increased during the 2000s, and in the just ended 2010s it grew worse and cooperation gave way to much higher levels of domestic and international conflict.
Assuming my model of macro dynamics has some predictive validity, in the 2020s I expect that conflict will increase in the 2020s. However, that should also drive the system into a more ordered state (e.g., due to heightened fear of new existential threats, such as an aggressive China, or Chinese-Russian alliance, and/or the worsening effects of continued global warming).
If the dynamic cycle continues function, then, roughly speaking, in the 2030s the global macro system will once again be characterized by relatively high levels of order and cooperation.
However, happy outcomes in history are far from ordained. The challenges our leaders and institutions will face in the 2020s will very likely test them to their limits, and possibly beyond them.
We are moving into a very dangerous decade for investors, for whom prudence should be the order of the day, with a primary focus on avoiding deep losses rather than realizing large gains.
Years ago I took a class taught by Henry Kissinger right after he left government. I still have a handout he had us read, of an interview he gave to the New York Times in 1974. It says in part:
“I think of myself as a historian more than a statesman. As a historian, you have to be conscious of the fact that every civilization that has ever existed has ultimately collapsed. History is a tale of efforts that failed, of aspirations that weren’t realized, of wishes that were fulfilled and then turned out to be different from what one expected. So as a historian, one has to live with a sense of inevitable tragedy. [But] as a statesman one has to act on the assumption that problems must be solved.”
High Value Information Observed In December 2019
In our model of the complex global macro system, change drivers are arrayed across a roughly chronological process (albeit one with many feedback loops), in which technological and environmental changes precede changes in the economy and national security, which in turn lead to changes in society and politics, all of which produce the effects we observe in investor behavior and financial market valuations and returns.
In our methodology, we classify new information as significant and highly valuable if either it (1) is an “indicator”, which reduces our uncertainty about the value of a parameter in our mental model for making sense of the dynamic macro system, or (2) it is a “surprise” which increases our uncertainty about either the range of potential values for a parameter or the structure of our model. With respect to indicators, the higher our priori probability is for a regime, the more we look for indicators that it will not occur, and the lower our prior probability for a regime, the more we look for indicators that it will occur. Put differently, we tend to look for high value indicators that disconfirm our prior views.
| New Technology Information: Indicators and Surprises | Why Is This Information Valuable? |
| Hearing of the US House of Representatives Committee on Financial Services Task Force on Artificial Intelligence on the Impact of AI on Capital Markets and Jobs in the Financial Services Industry | In his testimony, Dr. Marcos Lopez de Prado from Cornell University began by noting that, “as a consequence of recent advances in pattern recognition, big data and supercomputing, ML can today accomplish tasks that until recently only expert humans could perform… “ML algorithms are particularly powerful at modeling complex non-linear interactions between variables…According to studies, more that 34% of the total hedge fund assets under management are currently invested using algorithmic strategies, for over $1 trillion dollars. This figure does not include factor-based mutual funds and exchange traded funds offered to retail investors, so the total assets of algorithmic-managed investments could be close to $2 trillion…Eventually, we can expect that ML algorithms will be involved in the allocation of tens of trillions of dollars, replacing human discretion and the more traditional econometric methods… “Financial ML creates a number of challenges for the 6.14 million people employed in the finance and insurance industry, many of whom will lose their jobs, not necessarily because they are replaced by machines, but because they are not trained to work alongside algorithms. The retraining of these workers is an urgent and difficult task.” In separate testimony, Rebecca Fender from the CFA Institute noted that, “The type of skill required for investment teams will remain predominantly investment skills. Professionals on investment teams who understand the basics of AI, data science, and technology, however, can be expected to be far more effective than someone with similar investment skills but no exposure to such technologies…Today just 6% of CFA members and candidates say they are proficient in data analysis coding (Python, R, MATLAB, etc.)” |
| “How connected is too connected? Impact of network topology on systemic risk and collapse of complex economic systems” by Vie and Morales | SURPRISE This paper highlights how, across many socio-technical systems, the increase in network connectivity over the past decade has likely made them much more exposed to systemic failure risks. The authors note that, “economic interdependencies have become increasingly present in globalized pro-duction, financial and trade systems. While establishing interdependencies among economic agents is crucial for the production of complex products, they may also in- crease systemic risks due to failure propagation. It is crucial to identify how network connectivity impacts both the emergent production and risk of collapse of economic systems.” They “propose a model to study the effects of network structure on the behavior of economic systems by varying the density and centralization of connections among agents. The complexity of production increases with connectivity given the combinatorial explosion of parts and products.” The authors find that, “emergent systemic risks arise when interconnections increase vulnerabilities.” They claim that their results “suggest a universal description of economic collapse given in the emergence of tipping points and phase transitions in the relationship between network structure and risk of individual failure. This relationship seems to follow a [S-curve] in the case of increasingly denser or centralized networks. The model sheds new light on the trade-off between increasing the density of connections in, and potential production of, a system and its robustness to collapse…Sparser networks may have a lower productivity but are more resilient to probability of failure…Economic agents may in some situations become too interconnected to thrive.” |
| “Evolving trading strategies in heterogeneous environments”, by Dewhurst et al | SURPRISE “Securities markets are quintessential complex adaptive systems in which heterogeneous agents compete in an attempt to maximize returns. Species of trading agents are also subject to evolutionary pressure as entire classes of strategies become obsolete and new classes emerge. Using an agent-based model of interacting heterogeneous agents as a flexible environment that can endogenously model many diverse market conditions, we subject deep neural networks to evolutionary pressure to create dominant trading agents…and construct a method to turn [them] into trading algorithms. “We backtest these trading algorithms on real high-frequency foreign exchange data, demonstrating that elite trading algorithms are consistently profitable in a variety of market conditions, even though these algorithms had never before been exposed to real financial data. “These results provide evidence to suggest that developing trading strategies by repeated simulation and evolution in a mechanistic market model may be a practical alternative to explicitly training models with past observed market data.” |
| The Artificial Intelligence Index, 2019 Annual Report | “In a year and a half, the time required to train a large image classification system on cloud infrastructure has fallen from about three hours in October 2017 to about 88 seconds in July, 2019. During the same period, the cost to train such a system has fallen similarly… “Progress on some broad sets of natural-language processing classification tasks…has been remarkably rapid; [however] performance is still lower on some NLP tasks requiring reasoning, or human-level concept learning tasks… “Prior to 2012, AI results closely tracked Moore’s Law, with compute doubling every two years. Post-2012, compute has been doubling every 3.4 months… “Globally, investment in AI startups continues its steady ascent. From a total of $1.3B raised in 2010 to over $40.4B in 2018 (with $37.4B in 2019 as of November 4th), funding has increased at an average annual growth rate of over 48%. |
| “Data-driven Discovery of Emergent Behaviors in Collective Dynamics”, by Maggioni et al | SURPRISE “Particle and agent-based systems are a ubiquitous modeling tool in many disciplines. We consider the fundamental problem of inferring interaction [relationships] from observations of agent-based dynamical systems given observations of trajectories, in particular for collective dynamical systems exhibiting emergent behaviors with complicated interaction [relationships]… “We provide extensive numerical evidence that [our method for estimating these relationships] provides faithful approximations [of them], and provides accurate predictions for trajectories started at new initial conditions, both throughout the training" time interval in which the observations were made, and often much beyond.” |
| | |
| | |
| | |
| | |
| | |
| | |
| | |
| | |
| New Energy and Environment Information: Indicators and Surprises | Why Is This Information Valuable? |
| “Sunny with a Chance of Curtailment: Operating the US Grid with Very High Levels of Solar Photovoltaics”, by Frew et al | “The total annual solar penetration for the United States in 2017 was about 1.9%, with rapid declines in solar photovoltaic (PV) and energy storage costs, futures with PV penetrations approaching or exceeding 50% of total annual US generation are becoming conceivable. [However], the operational merits of such a national-scale system have not been evaluated sufficiently.” The authors “analyze the operational impacts of a future US power system with very high annual levels of PV (>50%) with storage.” The authors “find that, with appropriate changes to grid operation, 55% PV penetration could be achieved in 2050 while ensuring resource adequacy, addressing net-load variability, and providing sufficient operating reserves. “However, typical grid operation with 55% PV would look very different from how the grid operates today. It would include very high instantaneous penetration of nonsynchronous (inverter-based) generators, net-load ramp rates, and curtailment, as well as many hours of zero energy prices…These changes would require new ways of thinking about the role of curtailed energy, along with new market designs and compensation mechanisms for sources of energy that have no variable costs.” |
| “A Simple Plan for Modernizing the Power Grid”, by Dean et al from BCG | “Modernizing a grid is a tough challenge…Since the beginning of 2018, at least five major utilities across the US have had grid modernization plans rejected by regulators because the proposals lacked a clear rationale for upgrading or failed to explain the benefits for the customer. Even when proposals gain regulatory approval, however, companies often struggle with the sheer complexity of the transformation required. “For utilities that get it right, the benefits to the customer and company are considerable. Get it wrong, though, and the danger of falling further behind in a rapidly evolving energy landscape is significant.” |
| “Deployment of Deep Decarbonization Technologies: Proceedings of a Workshop”, by the National Academies of Sciences | “Many decarbonization discussions begin and end with the technologies, themselves… Various technical solutions for carbon dioxide removal were discussed, but they require vast inputs of energy (direct air capture) or land (natural carbon sink solutions). For many decarbonization technologies, deployment at scale will require transformation of the operations of entire sectors, including rebuilding infrastructure, redefining business models, retrofitting or replacing manufacturing processes, discovering new supply chains, developing new product designs, and retraining the workforce… “Decarbonization of the economy will require large, up-front capital expenditures, and many sectors have so far struggled to attract the required level of investment due to regulatory uncertainty and non-fully depreciated assets that result in carbon dioxide emissions… “Policy changes that lead to investment in decarbonization technologies can result in stranded assets and thus can raise equity issues for the owners of those assets. Above all else, regulatory certainty is necessary to lower risk and attract investors to the market place, and without a reliable return-on-investment, investors often stay on the sidelines.” |
| “Can a Growing World be Fed When the Climate is Changing?” By Dietz and Lanz | The authors study “the capacity to meet food demand under conditions of climate change, economic and population growth…[using] a model of the global economy structurally estimated on the period 1960 to 2015. The model integrates several features necessary to study the problem, including an explicit agriculture sector, endogenous fertility, directed technical change and fossil/renewable energy.” The authors “develop a structural economic model to study how world food demand can be met under conditions of climate change, economic and population growth.” They find that “macro-economic adjustments like crop land expansion and increased R&D have reduced climate damages substantially, but not wholly… “The global agricultural land area, as measured by arable land and permanent crops, has grown more slowly and there are indications that it may not expand much further over the course of this century. Historical research suggests global cropland roughly doubled in each of the 19th and 20th centuries. Between 1960 and 2015 it grew by about 15 percent, with the expansion concentrated in places such as tropical developing countries. This did not constrain global food production, however… "The value of global food production more than tripled from 1961 to 2011, corresponding to a growth rate of about 2.3 percent. This reflects significant productivity gains…[However, more recently some analyses have] reported a slowdown of agricultural productivity growth… “In a nutshell, world population and GDP have expanded significantly, albeit at a decreasing rate. Agricultural productivity has so far more than kept up with this growth, resulting in declining relative food prices and undernourishment, but a slowdown of productivity growth is raising concerns about the capacity of agriculture to keep pace… “The pessimistic, Neo-Malthusian view emphasizes limits to the availability of natural resources that are essential inputs to agriculture, especially under climate change. "The optimistic view focuses on technological progress in agriculture and substitution away from finite natural resources, enabling farmers and the agricultural system to adapt.” |
| “Democracies are Ill-Suited to Deal with Climate Change”, by the Financial Times’ Ed Luce | “If images of Sydney enshrouded in smoke, or Napa Valley in flames, cannot arouse the voter’s imagination, what will? Those hoping the world’s wealthiest countries will take more of a lead on climate change must confront three hard truths. “The first is that politicians struggle to look beyond the electoral cycle. The second obstacle to climate change action is uncertainty. It is impossible to establish that any single disaster is entirely man-made…The third obstacle is — how to put it? — human nature. Few people want to confront a massive problem when there are petty scores to settle.” |
| “A 3C World Is Now Business as Usual”, by the Breakthrough Institute | “The world is on a path to warm to around 3C above pre-industrial levels by 2100 under policies and commitments currently in place. This is a far cry from the 1.5C and 2C targets enshrined in the Paris agreements, but is also well short of the 4C to 5C warming in many “business as usual” baseline scenarios that continue to be widely used… “Uncertainties surround this projection, of course. For one, there are uncertainties in the sensitivity of the climate to rising atmospheric greenhouse gas concentrations that mean emissions expected to produce warming of around 3C could result in warming as little as 1.9C or as much as 4.4C. And future emissions trajectories are themselves highly uncertain.” |
| | |
| | |
| | |
| | |
| | |
| | |
| | |
| New Economic Information: Indicators and Surprises | Why Is This Information Valuable? |
| “Recession Ahead: An Overview of Our Predicament”, by Gail Tverberg on OurFiniteWorld.com | Gail Tverberg is an actuary who for many years has been writing articles about the complex interactions between energy, economic growth, and debt. As she notes, most economic models don’t take these interactions into account. Demand growth is driven by some combination of population growth, productivity growth, and increasing debt. It also requires energy. If energy prices are too high, demand gradually declines. There are many ways high energy prices can emerge, including regulatory constraints on supply (e.g., banning some types of fossil fuels in the absence of offsetting falls in the price of other sources of energy, including their delivery to end consumers), increasing marginal costs of production (e.g., due to depleting supply of low cost deposits), or demand growth (driven by population, productivity, and/or debt) that exceeds energy supply growth and/or the rate at which energy efficiency improves (at least in the short term). However, the opposite can also create problems – slow demand growth caused by declining or aging populations, weak productivity and/or excessive debt can lower energy prices to a level that causes investments in energy supply to fall, potentially causing energy shortages (which have a negative feedback impact on productivity growth, and ultimately the ability of the economy to service its high level of debt). In other words, economic problems can be caused and exacerbated not only by energy prices that are too high, but also by ones that are too low. As Tverberg says, “it is a perpetual tug of war between energy prices that are too high to be affordable and too low to be profitable.” |
| “Germany steps up hunt for migrant workers amid fears for economy”, FT 16Dec19 “Polish companies turn to robots as labour shortage bites”, FT 15Dec19 | “Germany is stepping up efforts to attract more migrant workers from outside Europe, as business leaders and politicians warn that the pervasive lack of skilled labour poses a mounting risk to the country’s economy. “A decade of expansion has left the German labour market with record low unemployment and companies struggling to fill 1.36m vacancies…A survey released on Monday by Germany’s chambers of commerce (DIHK) found that 56 per cent of companies said the lack of skilled labour was the biggest risk to their business… “The Amica warehouse on the outskirts of Wronki, a small town in western Poland, towers over the surrounding countryside, houses up to 230,000 items, and can process 1,600 of them in an hour. But perhaps the most striking thing about the cavernous grey facility is that it can be run by just one person. “Instead of workers, huge orange robots driven by algorithms glide between 46m-high bays packed with washing machines and ovens, shuffling them around so they can be dispatched as quickly as possible to customers around the world. “Opened two years ago, the futuristic warehouse is central to Amica’s expansion plans. But it is also part of the Polish white goods group’s battle against the labour shortages that are constraining one of Europe’s fastest-growing economies.” |
| “US retailers hit by ‘worst year since 2008’ for discounting”, FT 15Dec19 | “US department stores and clothing retailers, trying to weather the continued onslaught of online shopping, are resorting to some of the biggest discounts since the 2008 crisis to woo consumers, heightening concerns of a squeeze in profit margins.” |
| “The Clash of Capitalisms: The Real Fight for the Global Economy’s Future”, by Branko Milanovic 10Dec19 in Foreign Affairs | Capitalism now has no rival, but two models offer significantly different ways of structuring political and economic power in a society. Political capitalism gives greater autonomy to political elites while promising high growth rates to ordinary people. China’s economic success undermines the West’s claim that there is a necessary link between capitalism and liberal democracy... “At the same time, China’s government and those of other political capitalist states need to constantly generate economic growth to legitimize their rule, a compulsion that might become harder and harder to fulfill. Political capitalist states must also try to limit corruption, which is inherent to the system, and its complement, galloping inequality. The test of their model will be its ability to restrain a growing capitalist class that often chafes against the overweening power of the state bureaucracy… “Liberal capitalism has many well-known advantages, the most important being democracy and the rule of law. These two features are virtues in themselves, and both can be credited with encouraging faster economic development by promoting innovation and social mobility. Yet this system faces an enormous challenge: the emergence of a self-perpetuating upper class coupled with growing inequality. This now represents the gravest threat to liberal capitalism’s long-term viability." |
| De Nederlands Bank (the Central Bank) used an interesting sentence is a recent article about its gold stock that raised a lot of eyebrows. | SURPRISE “Shares, bonds and other securities are not without risk, and prices can go down. But a bar of gold retains its value, even in times of crisis. That is why central banks, including DNB, have traditionally held considerable amounts of gold. Gold is the perfect piggy bank – it's the anchor of trust for the financial system. If the system collapses, the gold stock can serve as a basis to build it up again. Gold bolsters confidence in the stability of the central bank's balance sheet and creates a sense of security.” |
| “Inflation Dynamics: Dead, Dormant, or Determined Abroad?” by Kristin Forbes, from MIT | “CPI inflation has become more synchronized around the world since the 2008 crisis, but core and wage inflation have become less synchronized. Global factors (including commodity prices, world slack, exchange rates, and global value chains) are significant drivers of CPI inflation in a cross-section of countries, and their role has increased over the last decade, particularly the role of non-fuel commodity prices. These global factors, however, do less to improve our understanding of core and wage inflation which is still largely a domestic process.” |
| “Macroeconomic effects of political risk shocks”, by Sinem Hacioglu Hoke, from the Bank of England | The author investigates “the macroeconomic impact of political risk” and concludes that they are distinct from shocks that increase uncertainty about economic policy. Moreover, “the political risk shocks we identify are important drivers of inflation dynamics as well as economic activity. Collectively, these findings point to the medium to long term impact of political risk shocks, which comes with a delay.” |
| “Global Waves of Debt”, by Kose et al from the World Bank | “The global economy has experienced four waves of broad-based debt accumulation over the past fifty years. In the latest wave, underway since 2010, global debt has grown to an all-time high of 230 percent of GDP in 2018.” |
| “French strikers angry about pension reform cut power to homes, companies”, Reuters, 17Dec19 | Whether the sustained and increasingly painful standoff between the French government and public sector workers over pension reforms is a harbinger of things to come in other developed countries facing similar pension underfunding crises remains to be seen… “The power cuts, illegal under French law, deepened a sense of chaos in the second week of nationwide strikes that have crippled transport, shut schools and brought more than half a million people onto the street against President Emmanuel Macron’s reform.” |
| “Eight centuries of global real interest rates, R-G, and the ‘suprasecular’ decline, 1311–2018”, by Paul Schmelzing, from the Bank of England | SURPRISE This paper points out that for most of economic history, economic growth and real interest rates have been low (see, for example, Angus Maddison’s papers, and “Seven Centuries of European Economic Growth and Decline” by Fouquet and Broadberry). “ With recourse to archival, printed primary, and secondary sources, this paper reconstructs global real interest rates on an annual basis going back to the 14th century, covering 78% of advanced economy GDP over time.” The author “shows that across successive monetary and fiscal regimes, and a variety of asset classes, real interest rates have not been ‘stable’, and that since the major monetary upheavals of the late middle ages, a trend decline between 0.6–1.6 basis points per annum has prevailed… “Against their long‑term context, currently depressed sovereign real rates are in fact converging ‘back to historical trend’ — a trend that makes narratives about a ‘secular stagnation’ environment entirely misleading, and suggests that — irrespective of particular monetary and fiscal responses — real rates could soon enter permanently negative territory.” |
| “The Value of Government Debt”, by John Cochrane | SURPRISE “The analysis of government finances, how debt is paid off, grown out of, or inflated away, is a long literature…We live in a time of unusually large peacetime government debt to GDP ratios. How will these debts be resolved – by primary surpluses, by low returns, or by large GDP growth rates? What set of expectations sustains these large debts – and what will happen if those expectations of surpluses, growth, and low returns change? Can we count on growth to exceed returns for the foreseeable future, suggesting a rather painless further expansion of government debt? Or are we primed for a debt crisis? “We cannot know, of course, but the lessons of history captured by these calculations are illuminating: We can learn how past variation in debt to GDP ratios was resolved, and we can learn how debts are resolved on average… “I find that about half of the postwar variation in debt to GDP ratios corresponds to variation in expected future surpluses, and about half to expected growth-adjusted discount rates… “The discount rate contribution comes mostly from nominal returns. Essentially none of the variation in debt to GDP ratios corresponds to changing growth forecasts. In the full sample, going back to 1930, even more of the variation in the debt to GDP ratio comes from discount rates, and less from variation in expected future surpluses… “About a third of the postwar fall in debt to GDP did come from sustained primary surpluses. The rest came from the larger fall in the cumulative growth-adjusted return r minus g. Nominal returns and inflation largely cancel, with rising GDP contributing the rest. “Starting in the mid 1970s, sustained primary surpluses turn to repeated large primary deficits, and r minus g turns slightly positive. Subsequent variation in the value of debt largely corresponds to variation in cumulated primary surpluses and deficits. Variation in rates of return, though large, is not sustained enough to produce much variation in the value of debt. The inflation of the 1970s did little to devalue debt, as debt rolled over faster than unexpected inflation could devalue it. Using the correct return on the entire government debt portfolio, there is little sign of a substantial post-2000 decline in r minus g that might make debt more sustainable.” |
| | |
| New National Security Information: Indicators and Surprises | Why Is This Information Valuable? |
| “Winning the Invisible War” by Clark et al from the Center for Strategic and Budgetary Assessments | SURPRISE “The electromagnetic spectrum (EMS) is increasingly central to modern life. For more than a century, broadcast or satellite radio and television have provided entertainment, news, and propaganda to mass audiences. During the last three decades, mobile computing and communications became many people’s main way to connect with others and share information. Now, the advent of small, inexpensive antennas and processors is enabling a virtual explosion of new sensors, communications, and related applications operating in the EMS”… “The proliferation and growing sophistication of civilian and military EMS capabilities has resulted in an increasingly congested and contested electromagnetic environment for which the U.S. military is unprepared. Over the past decade, several government and external assessments found that the U.S. military is falling behind Chinese and Russian forces in electronic warfare (EW) and that U.S. forces will be challenged to achieve EMS superiority in future conflicts. To address these concerns, the U.S. Department of Defense (DoD)—sometimes under Congressional direction—initiated an ongoing series of actions to improve its EW doctrine and capabilities. This study will argue these efforts have been unfocused and are likely to fail at delivering EMS superiority.” |
| “AI & Robots Crush Foes In Army Wargame”, Breaking Defense 19Dec19 | SURPRISE “How big a difference does it make when you reinforce foot troops with drones and ground robots? You get about a 10–fold increase in combat power, according to a recent Army wargame…That mission: dislodge a defending company of infantry, about 120 soldiers, with a single platoon of just 40 attackers on foot. That’s a task that would normally be assigned to a battalion of over 600. In other words, instead of the minimum 3:1 superiority in numbers that military tradition requires for a successful attack, the simulated force was outnumbered 1:3… “Of course [the use of drones and ground robots also] requires the network to, well, work. If your cellphone has ever dropped a call, you know that’s not guaranteed. And battlefield networks have to overcome problems no commercial system faces, such as Russia’s extensive arsenal of electronic warfare systems to detect and jam transmissions. In 2017, the Army decided its tactical network was far too vulnerable to hacking and jamming, so it rebooted the entire modernization effort, and since then industry has been laboring mightily to build communications that can function even in the face of Russian or Chinese attack.” |
| “Russia’s Hostile Measures: Combating Russian Gray Zone Aggression Against NATO in the Contact, Blunt, and Surge Layers of Competition”, by Conable et al from RAND | “Russia threatens the security and stability of the North Atlantic Treaty Organization (NATO) and, bilaterally, many of its individual member states. However, as of early 2019, the nature and extent of the Russian threat was still being debated. We argue that the current consensus on the complex Russian threat is simultaneously understated and overblown… “Russia is dangerous. It sows disorder, weakens democratic institutions, and undermines NATO cohesion. In some ways, its full conventional threat is perhaps even more dangerous than currently portrayed. “However, Russia has a long track record of strategic shortfalls and even some ineptitude in its long game; it is neither infallible nor omnipotent. NATO can effectively deter, prevent, and counter Russian hostile behavior in the gray zone—along what the U.S. Department of Defense (DoD) calls the contact layer, where daily adversarial competition occurs—and during state-on-state war.” |
| “The Illusion of a Rules-Based Global Order”, by Brahma Chellaney professor of strategic studies at the New Delhi–based Centre for Policy Research | “When the Cold War ended, many pundits anticipated a new era in which geoeconomics would determine geopolitics. As economic integration progressed, they predicted, the rules-based order would take root globally. Countries would comply with international law or incur high costs. “Today, such optimism looks more than a little naive. Even as the international legal system has ostensibly grown increasingly robust—underpinned, for example, by United Nations conventions, global accords like the 2015 Paris climate agreement, and the International Criminal Court—the rule of force has continued to trump the rule of law. Perhaps no country has taken more advantage of this state of affairs than China. “Consider China’s dam projects in the Mekong River, which flows from the Chinese-controlled Tibetan Plateau to the South China Sea, through Myanmar, Laos, Thailand, Cambodia and Vietnam. By building 11 mega-dams near the border of the Tibetan Plateau, just before the river crosses into Southeast Asia, China has irreparably damaged the river system and wreaked broader environmental havoc, including saltwater intrusion in the Mekong Delta that has caused the delta to retreat. “Today, the Mekong is running at its lowest level in 100 years, and droughts are intensifying in downriver countries. This gives China powerful leverage over its neighbours. And yet China has faced no consequences for its weaponisation of the Mekong’s waters.” |
| “Iran’s Strategic Intent” Chapter One in IISS’ new book “Iran’s Networks of Influence in the Middle East” | “By 2019, Iran’s influence in Iraq, Lebanon, Syria and Yemen had become a new normal in a region where such a concept would have once been unthinkable by the region’s leaders, including those in Tehran. Iran had achieved much of this change using a transnational Shia militancy, capable of fighting with varying degrees of skill and discipline, which confronted different Iranian adversaries on disconnected battlefields simultaneously. “No state has been so active, and perhaps as effective, as Iran in regional conflicts in modern times…its extraterritorial ambitions are laid out in its constitution and the rhetoric of its leadership – though it could not predict the regional seismic shifts and international apathy that have enabled its success… “This foreign policy has been directed by the Supreme Leader but dominated by two actors: Major-General Soleimani, who engaged directly with Iraqi, Russian and Syrian leaders, and Iran’s Foreign Minister Zarif, who focused on communicating with the broader international community…. “Iran’s interventions have validated an external military doctrine emphasising hybrid-war techniques and cooperation with state and sub-state actors. Iran has been able to threaten international energy and shipping arteries in the Persian Gulf and the Strait of Hormuz, and to some extent the Red Sea and Bab al-Mandeb. A large number of Iranian military personnel have fought difficult and multi-year conflicts in which they may believe they not only achieved strategic objectives but did so at the expense of Arab regional powers, Israel and the US. This confidence will likely guide Tehran’s view as to how it will manage future conflicts.” |
| On 3Jan20, Quasem Soeimani was killed by a US drone strike. | SURPRISE The attack came at the end of a quickly escalating series of actions, which began with a rocket attack by Iranian proxy forces on an Iraqi base that killed a US contractor, which was followed by retaliatory air attacks by US forces. This triggered a large demonstration around the US embassy in Baghdad orchestrated by Iran, which was intended to trigger memories of the Iranian takeover of the US Embassy in Tehran in 1979. The US then deployed a Marine Quick Reaction Force to the embassy. And then Soleimani was killed. Previously growing domestic demonstrations against the Iranian regime gave way to displays of national unity, and calls for revenge against the United States. |
| On 5Jan20 Iran announced it would no longer adhere to the terms of its previous nuclear deal. | Iran’s decision to resume activities that logically lead to its acquisition of nuclear weapons (to complement its already potent missile delivery systems). At some point in the future, this will almost certainly lead to a much larger and coordinated attack on facilities that are critical to its nuclear program. |
| On 8Jan20, Iran retaliated against Soleimani’s death by launching missiles against two bases in Iraq where US forces are stationed. At the same time, evidence emerged that Iran had shot down a Ukranian passenger jet killing all 176 passengers and crew aboard. | SURPRISE As the bases were on high alert, no US citizens were killed. However, a Ukranian passenger aircraft crashed in Tehran shortly after the missiles were fired, killing 176 passengers and crew. Three days later, on the strength of overwhelming evidence, Iran admitted that Iranian Republican Guard forces had shot down the plane. Anti-regime protests soon erupted in Iran, while the Trump administration announced further sanctions. Tightening sanctions and reverberations from the IRGC’s shootdown of Ukranian flight 752 will very likely provoke further demonstrations in Iran, that will almost certainly be met with an aggressive response by the regime, including the use of deadly force. It is very likely that Iran will also carry out further reprisal attacks against the United States, which in turn would very likely trigger massive American retaliation aimed at substantially reducing Iranian military capabilities. Whether this further inflames domestic opposition to the regime or increases nationalistic support for it remains to be seen. What is clear, however, is that such a substantial attack would make a subsequent attack on Iranian nuclear facilities much easier. |
| “Across China, the Clocks are Striking Thirteen”, by David Von Drehle, Washington Post 26Nov19 | Following the release of secret government documents describing the imprisonment of a million plus Uighurs, the author writes, “Across China, clocks are striking thirteen. But unlike the sheeple of Orwell’s grim prophecy, thousands of freedom-loving Chinese are awakening to the ominous chime and rising against Big Brother. “China’s communist government is increasingly brazen about creating a massive surveillance state, in which millions of cameras track every person’s whereabouts, every purchase is recorded in state databanks, every keystroke on the strictly controlled Chinese Internet is scrutinized. Powered by facial recognition software and other tools of artificial intelligence, this tireless web of watchers aims to control all that is done and said — even thought — inside the rapidly rising superpower.” See, for one example, “Tsinghua Professor Lao Dongyan: The hidden worries of facial recognition technology” on chinai.com |
| “Xi’s Tradeoff: Strategic Patience Versus Political Legitimacy”, by Greg Austin from the International Institute of Strategic Studies See also, “Xi Jinping’s Annus Horribilis” by Minxin Pei | “China’s President Xi Jinping is facing a leadership crisis. During the November 2019 BRICs summit, he described the current set of challenging circumstances as ‘changes in the world unseen in a century’. This phrase is several years old and not his own, but it captures the gravity of the predicaments now facing him after seven years in charge... “There are many dangerous currents around Xi’s policy choices that have been swirling for some time, and three of them are now raging torrents that could prove treacherous: Taiwan, Trump and Tiananmen… “The challenge by Hong Kong protesters, voters and key civil society groups to Chinese sovereignty is unambiguous and profound, but it also represents the worst crisis in Beijing’s relations with Taiwan for 20 years… “US President Donald Trump has stoked the fires of this simmering dissent against Xi over Hong Kong and Taiwan. Trump or his government have declared China variously to be a cheater country, a thieving country, a repressive country, a murderous regime, a threat to US national security and a threat to world order. The tirade of insults that American officials under Trump have heaped on Chinese leaders is unprecedented since the 1960s… “The ghosts of the Tiananmen Square crisis of 1989 still haunt the Chinese Communist Party halls of power. These ghosts are numerous and they are haunting different rooms. Just this year, in October, some brave people in China proudly marked the centenary of the birth of Zhao Ziyang, a hero of the Tiananmen demonstrators…In April, the sons of former Party General Secretary, Hu Yaobang, also ousted in 1987 from the same highest office because of his iconoclastic views, visited his grave on the 30th anniversary of his death. It was Hu’s death in 1989 that triggered the student demonstrations… “This more liberal political faction in China is not strong, but there is another more powerful Tiananmen ghost. It is the fear of a brain drain from China if there is another violent crackdown… “In sum, the main question is about the trade-off Xi is making between strategic patience (not using force against Hong Kong and Taiwan), and the erosion of his political legitimacy and authority.” |
| “Hong Kong’s Long View”, by Yang and Rhodes | “Two things have been clear from the beginning: First, neither the Chinese Communist Party (CCP) nor the Hong Kong government would respond positively to the protests and the protestors would experience increasingly harsh suppression. Second, it would be impossible for CCP and the local authorities to completely silence the protestors. This portends that in the near future, the tug of war between the Hong Kong government and the protestors will remain a stalemate with no clear winner… “The Hong Kong people are not afraid of not winning in the short term, but the CCP is afraid that the Hong Kong people are not losing” and their continued resistance could inspire similar protests on the mainland, particularly if the economic conditions worsen.” |
| “Chinese Universities’ Communist Party Tilt Sparks Student Backlash”, FT 18Dec19 | “Leading universities have removed vows to uphold freedom of thought from their charters and added instead pledges of fealty to the ruling Chinese Communist party, sparking a backlash from students and professors.” |
| “Money Has Been Leaving China at a Record Rate”, CNN Business 19Dec19 | “Beijing is stepping up the battle to stop money flowing out of China as the country contends with economic woes and trade war tensions that have eased but show no sign of ending.” |
| “Corporate Defaults in China Surge in 2019 to a Record High $18.6 Billion”, FT 26Dec19 See also, “China’s Impending Minsky Moment”, FT 29Dec19 | In “China’s Impending Minsky Moment”, Bill Rhodes, the former Citibank executive who played a critical role in resolving the 1980s Latin American debt crisis, writes that, “There is still a danger of a ‘Minsky moment” hitting China’s economy. US academic economist Hyman Minsky, who died in 1996, warned of the risks of periods of financial excesses leading to crises. Today, China’s debt-to-gross domestic product ratio is more than 300 per cent and continues on a dangerously upward trajectory… “The Chinese authorities are aware of the situation and the risks but they continually refrain from acting with the necessary force. They are concerned that actions to confront rising domestic debt will constrain economic growth.” Yet continuing delay in addressing the underlying causal drivers will only make China’s Minsky moment more painful when it finally arrives.” |
| New Health and Disease Information: Indicators and Surprises | Why Is This Information Valuable? |
| | |
| | |
| New Social Information: Indicators and Surprises | Why Is This Information Valuable? |
| “The Case for Growth Centers”, by Atkinson et al, published by Brookings | SURPRISE “Rather than growing together, the nation’s regions, metropolitan areas, and towns have been growing apart. That has been a shock, including for an economic and policy mainstream that has long trusted the self-regulating, welfare-enhancing nature of the regional economics market. “For much of the 20th century, market forces had tended to reduce wage, investment, and business formation disparities between more- and less developed regions. By narrowing the divides, the economy ensured a welcome “convergence” among communities and regions. “However, in the 1980s, that trend began to break down as digital technologies and innovation moved to the center of economic activity. Intense new demands for talent and insights increased the value of “agglomeration” economies, unleashing self-reinforcing dynamics that increasingly benefited big, coastal core regions, often to the detriment of cities and metro areas in other parts of the nation. “The result is a crisis of regional imbalance. Among the superstar metro areas, the winner take most dynamics of the innovation economy have led to dominance but also livability and competitiveness crises: spiraling real estate costs, traffic gridlock, and increasingly uncompetitive wage and salary costs. “Meanwhile, in many of the left-behind places, the struggle to keep up has brought stagnation and frustration. These uneven realities represent a serious productivity, competitiveness, and equity problem… “The nation needs a major push to counter these dynamics.” |
| “Profiles of News Consumption” by Pollard and Kavanagh from RAND | The authors “explore how U.S. media consumers obtain news” by examining “the different forms of media delivery (e.g., online, television, print) that consumers rely on and the relationship between consumers’ news consumption profiles and their overall perceptions of media reliability… “The analysis identified four news consumption profiles differentiated by clusters of how frequently individuals relied on different combinations of several news platforms: print and broadcast television platforms, online platforms (e.g., newspaper websites, such as nyt.com), radio, and social media (e.g., Twitter and Facebook) and in-person communication… “Each profile has a distinct set of demographic characteristics… “People whose primary news sources are social media and in-person contacts are generally younger and female, and they tend to have less education than a college degree and lower household incomes... “People whose primary news sources are print publications and broadcast television tend to be significantly older, and they are less likely to be married… “People whose primary news source is radio are significantly more likely to be male, less likely to be retired, and more likely to have a college degree... “People whose primary news sources are online platforms are significantly younger, more likely to be male and have a college degree and higher income, and less likely to be black… “Broadcast and cable television were perceived to be the most-reliable platforms by the largest number of people in our survey. The reliability of other platforms was ranked as follows: print, online news sites, radio, social media, and in-person communication… “People who rated their general political ideology as more liberal were more likely to report that they “never or almost never” sought out sources that they knew would offer views that are different from their own.” |
| “Millennials Are Leaving Religion and Not Coming Back”, by Cox and Thomson-DeVeaux on fivethirtyeight.com | SURPRISE “Millennials have earned a reputation for reshaping industries and institutions — shaking up the workplace, transforming dating culture, and rethinking parenthood. They’ve also had a dramatic impact on American religious life. Four in ten millennials now say they are religiously unaffiliated...In fact, millennials (those between the ages of 23 and 38) are now almost as likely to say they have no religion as they are to identify as Christian. “For a long time, though, it wasn’t clear whether this youthful defection from religion would be temporary or permanent. It seemed possible that as millennials grew older, at least some would return to a more traditional religious life. But there’s mounting evidence that today’s younger generations may be leaving religion for good.” |
| “Most Americans Say the Current Economy is Helping the Rich, Hurting the Poor and Middle Class”, by Pew Research | “Lower-income Republicans are roughly four times as likely as those in the upper-income tier to give the economy an only fair or poor rating… “To the extent that current economic conditions are helping particular groups, the public sees the benefits flowing mainly to the most well-off. Roughly seven-in-ten adults (69%) say today’s economy is helping people who are wealthy (only 10% say the wealthy are being hurt). At the same time, majorities of Americans say poor people, those without a college degree, older adults, younger adults and the middle class are being hurt rather than helped by current economic conditions… “When asked how economic conditions are affecting them and their families, nearly half of adults (46%) say they are being hurt, 31% say they’re being helped and 22% say they don’t see much of an impact.” |
| “The Problem with the Culture Problem”, by Oren Cass | SURPRISE Cass is one of the most interesting centrist policy writers active today. He recently left the Manhattan Institute to launch his own think tank. If effective and politically acceptable solutions to the economic and social challenges confronting the United States are to be found, Cass is likely to have a significant influence on them. In this article he writes that, “we need to put behind us the false distinction between “economic” and “cultural.” It is better to think in terms of “resources” and “decisions.” The liberal explanation takes material resources as fundamental and seeks to alleviate hardship through government transfers. With greater resources, this model presumes, decision-making will improve. The conservative explanation takes people’s decisions as fundamental and seeks to encourage better ones by altering both social and economic incentives. Through better decisions, material conditions will improve… A massive influx of resources over the last two generations has coincided with worsening decisions and thus conditions. Government spending on safety net programs quadrupled from $73 billion in 1965 to $271 billion in 1975, and quadrupled again to more than $1 trillion in 2015 (all figures in 2015 dollars)”… That’s a real compound annual growth rate of about 5.4%. In comparison, the compound annual growth of the US population over the same period was 1.01%. Cass notes that, “as proponents take pains to highlight, this strategy did work if the goal had merely been to meet material needs. Taking all these transfers into account, vanishingly few Americans would qualify as still “in poverty.” And yet the official poverty rate, which measures whether households earn sufficient income to support themselves, barely budged: The 2010s had a higher average poverty rate than the 1990s, which in turn had a higher rate than the 1970s. Family stability and community vitality plummeted. The underclass’s afflictions spread upward through the working class. “Even if safety net spending did not worsen the problem, one would be hard-pressed to make the case that it contributed to a solution, or that yet another expansion will do the trick. Instead, social science research supports the primacy of decisions over resources… “But a simplistic recital of “culture” as an explanation for social problems is inadequate. An emphasis on personal agency should not foreclose consideration of the many factors influencing how that agency is exercised. “Policymakers eager to affirm personal responsibility should be equally eager to inquire why individuals make the choices they do—the design of safety net programs is one such consideration, but hardly the only one. People in similar circumstances make different choices, confirming the central role of personal agency. But we can also observe that people tend to make choices in accord with information and incentives that change over time, factors that are often influenced by public policy… “For most decisions that matter, both economics and culture play a role.” |
| ”The Real Class War” by Julius Krein, American Affairs Journal | SURPRISE “At bottom, the economy that has been constructed over the last few decades is nothing more than a capital accumulation economy. As long as returns on capital exceed returns on labor, then the largest capital holders benefit the most, inequality rises, and wealth becomes more and more narrowly concentrated. Labor—including elite labor—is inevitably left behind…. The socioeconomic divide that will determine the future of politics, particularly in the United States, is not between the top 30 per cent or 10 percent and the rest, nor even between the 1 percent and the 99 percent… “In fact, the fortunes of the members of this new aristocracy have diverged considerably. The performance gap between the top 1 or 0.1 percent versus the top 10 percent is actually larger than the gap between those right at 10 percent and any part of the bottom 90 percent… “The real class war is between the 0.1 percent and (at most) the 10 percent—or, more precisely, between elites primarily dependent on capital gains and those primarily dependent on professional labor… “This underappreciated reality at least partially explains one of the apparent puzzles of American politics in recent years: namely, that members of the elite often seem far more radical than the working class, both in their candidate choices and overall outlook. Although better off than the working class, lower-level elites appear to be experiencing far more intense status anxiety.” |
| “Is College Still Worth It? The New Calculus of Falling Returns”, by Emmons et al from the Federal Reserve Bank of St. Louis | “The college income premium is the extra income earned by a family whose head has a college degree over the income earned by an otherwise similar family whose head does not have a college degree. This premium remains positive but has declined for recent graduates… “The college wealth premium (extra net worth) has declined more noticeably among all cohorts born after 1940. Among families whose head is White and born in the 1980s, the college wealth premium of a terminal four-year bachelor’s degree is at a historic low; among families whose head is any other race and ethnicity born in that decade, the premium is statistically indistinguishable from zero. Among families whose head is of any race or ethnicity born in the 1980s and holding a postgraduate degree, the wealth premium is also indistinguishable from zero… “Our results suggest that college and postgraduate education may be failing some recent graduates as a financial investment, due to the rising cost of college and the increasing burden of student debt.” |
| | |
| | |
| | |
| | |
| | |
| | |
| New Political Information: Indicators and Surprises | Why Is This Information Valuable? |
| “Building U.S. Resilience to Political Violence”, by Itzhak et al from the New America Foundation | SUPRRISE The surprise was less this report’s contents, and more that a respected think tank actually published it. “The United States has recently seen a rise in violence and hate speech, an increase in public rhetoric that seems to encourage violence, and a decline in the perceived legitimacy of U.S. democratic institutions. These well-documented trends are themselves alarming. Yet the next year will likely see an escalation in tensions and the risk of violence, due to political and cultural events, including the run-up to the U.S. presidential election and census… “We define political violence as violence aimed at political ends — meant to control or change who benefits from, and participates fully in, U.S. political, economic, and socio-cultural life…. “We highlight four risk factors for political violence: elite factionalization, societal polarization, a rise in hate speech and rhetoric, and weakening institutions… “In addition to intensifying, our polarization has changed in nature. Whereas once political divisions stemmed from disagreements over a particular issue or policy, they now stem from how people feel about those on the other side of the political spectrum, known as identity-based or affective polarization. “This has occurred alongside a process of social sorting: Our personal identities have grown in alignment with our political ones. With this, we are no longer merely competing for political victories, but also for the victories of our racial, religious, ethnic, and gender identities — leading to an ever-heightened need for victory… “As Americans increasingly connect political differences to core identities rather than issues, the space for deliberation, dialogue, and compromise recedes.” |
| “How Culture Killed the Labour Party”, by Yascha Mounk in The Atlantic | “The rise of culture as the main cleavage of Western politics helps explain the slow death of social-democratic parties in many countries across the West… “[In the UK] back when Labour was capable of commanding convincing electoral majorities, it held together a broad class coalition. It was the natural party of working people, with overwhelming support among the less affluent and less well educated. At the same time, it enjoyed strong support among large sections of the middle class, attracting many university students, schoolteachers, and civil servants. “Although these two sides of the bourgeois-proletarian coalition have always differed in their cultural attitudes, they had significant economic commonalities. Both had an interest in high wages and strong unions. And both relied on the welfare state for the schooling of their children, for access to good doctors, and for the knowledge that they would be able to retire in dignity. “So long as the main focus of electoral politics was on economic questions, the leaders of the Labour Party could therefore hold this broad coalition together… “But in the past decades, partisan alignment has shifted away from matters of economic policy toward what one might call questions of culture, such as immigration and, of course, Brexit. And whereas middle-class voters in large urban areas have progressive attitudes on immigration and strongly oppose Brexit, working-class voters tend to be highly critical of immigration and favor leaving the EU. Most of the working-class constituencies that have now swung to the Conservative Party resoundingly backed Leave in the 2016 referendum.” |
| “The Populist Decade”, by Matthew Continetti | SURPRISE “The underlying causes of national populism have not disappeared. Our times continue to be shaped by immigration, terrorism, and the cultural distance between voters without college degrees and the credentialed elites who govern them. It would be a mistake to follow the advice of the Bloomberg editor who wrote in a recent headline, “Populism Will Probably Just Go Away Soon, So Relax.” On the contrary: The populist epoch may be only beginning.” |
| “A Season of Caesars”, by Larry Diamond in the American Interest | SURPRISE “Unlike their predecessors, today’s authoritarians lack a common ideology. But once in power, they behave in remarkably similar ways… “In particular, they pursue what I have called in my book, “Ill Winds, the Autocrats’ Twelve-Step Program”. While the style and sequence may vary from country to country, it looks something like this: • Demonize the political opposition as illegitimate and unpatriotic • Undermine independent courts • Attack the independence of the media • Gain control of any public broadcasting • Impose government control of the internet • Subdue other elements of civil society • Intimidate the business community • Enrich a new class of crony capitalists • Assert partisan control over the civic service and the security apparatus • Gerrymander districts and rig electoral rules • Gain control over the administration of elections • Repeat 1-11 ever more vigorously” |
| | |
| | |
| | |
| | |
| | |
| | |
| New Financial Markets and Investor Behavior: Indicators and Surprises | Why Is This Information Valuable? |
| “Investors grit their teeth for a ‘low return decade” by Robin Wiggleworth in the FT, 11Dec19 | “Wall Street’s forecasts for the coming year make for fairly glum reading. But the real horror-show lies in the smattering of long-term forecasts, which indicate that the coming decade could be as terrible for investors as this one has been terrific… “The price-to-earnings ratio for US stocks constructed by Nobel prize-winning economist Robert Shiller, which adjusts for economic cycles, has climbed back to 30 times — roughly twice its long-term average. Meanwhile, $11.6tn of bonds are trading at negative yields. “I think this will be an abnormally low-return decade,” warned Andrew Sheets, chief cross-asset strategist at Morgan Stanley. “For bonds it’s just arithmetic, but for equities there are also valuation challenges… “While such dour forecasts are sometimes dismissed as Cassandra-like — a reference to the soothsayer of Greek mythology — Mr Sheets noted that Cassandra’s prophesies were actually accurate. Her curse was never to be believed… “The long-term estimates of GMO, the asset manager founded by Jeremy Grantham, are even more pessimistic. GMO forecasts US equities will on average lose 3.9 per cent a year in real, inflation adjusted terms over the next seven years, US bonds will shed 2.2 per cent, international equities will move sideways, and international fixed income — when the currency exposure is hedged — will drop 3.9 per cent, because the elevated cost of insuring against FX movements will erode the scant returns available… "Most investors are more hopeful than their Wall St banks and fund managers. In a UBS survey of its clients, 69 per cent said they are optimistic about investment returns over the next decade.” |
| “Estimating the Anomaly Base Rate”, by Chinco et al | SURPRISE “The academic literature literally contains hundreds of variables that seem to predict the cross-section of expected returns. This so-called ‘anomaly zoo’ has caused many to question whether researchers are using the right tests of statistical significance. But, here’s the thing: even if researchers use the right tests, they will still draw the wrong conclusions from their econometric analyses if they start out with the wrong priors—i.e., if they start out with incorrect beliefs about the ex ante probability of encountering a tradable anomaly. So, what are the right priors? What is the correct anomaly base rate?” The authors conclude that it is ver low, noting that ”the anomaly zoo contains a few tradable anomalies and many more spurious predictors.” |
| “Fund Managers Push Against the Flow in Global Macro”, FT 9Dec19 | “US asset manager Neuberger Berman on Monday announced the launch of a “macro opportunities” fund, focused purely on major currencies. Specialist currency manager Adrian Lee & Partners, which manages $14bn of assets, announced the launch of a global macro fund late last week. Both target high single-digit annual returns… “The managers behind the new fund launches reported strong demand from institutional investors, especially given nerves that the long bull run in equities might be coming to an end.” |
| “Active Fixed Income Illusions”, by Brooks et al | SURPRISE “Over the past 20 years, active fixed income (FI) managers have tended to deliver returns in excess of their benchmarks. This has generated a popular notion that active investing in fixed income markets is ‘easy’. Our aim is to assess the veracity of that notion. Across a broad set of popular active FI categories, we find that passive exposures to traditional risk premia (especially exposure to credit risk) explain the majority of FI manager active returns. The resulting implication is that, contrary to popular belief, traditional discretionary active FI strategies offer little in the way of true alpha, and that traditional active FI strategies may significantly reduce the strategic diversification benefit of FI as an asset class.” |
| “Chasing Your Own Tail Risk, Revisited”, by Thapar et al from AQR | “Our recommendation today for dealing with the risk of severely declining portfolio wealth is the same as it was in our 2011 paper: rather than try to Band-Aid the problem via portfolio insurance [e.g., buying S&P 500 puts], instead reduce your equity risk and complement the portfolio with underutilized sources of returns.” This is also the same thing The Index Investor has been saying since it was founded in 1997. (See the free section of our website that describes our core beliefs about investing). |
| “Credit Cycles and Asset Returns”, by Davis and Taylor | In the history of investing, some lessons get learned over and over, often as the result of painful experience. ”Investor experience and academic research since the Global Crisis reflects a growing realisation that credit conditions can affect future macroeconomic outcomes. This column investigates whether credit booms throughout history have had any explanatory power to account for future asset class returns. It finds that credit booms tend to systematically predict poor returns in the near future for equities in absolute terms, and relative to bonds. An investor who had tilted their portfolio allocations based on a credit boom signal would have been able to improve portfolio performance. The contribution of the credit boom signal is meaningful when compared to other well-established signals such as momentum and value.” |
| | |
| | |
System Tipping Points/Critical Threshold Analysis
Like Professors Andrew Lo, Doyne Farmer and others, we regard financial markets as a complex adaptive system (CAS), that exist as part of a larger macro system comprised of other CAS between which there are multiple feedback loops. These other systems include those that produce technology innovations, and economic, environmental, national security (including cyber), social, demographic, and political outcomes.
We also find that these systems tend to operate and generate effects in a rough chronological sequence, albeit with many feedback loops between them. The following chart highlights that the changes we observe in different areas at any point in time are actually part of a much more complex evolutionary process.
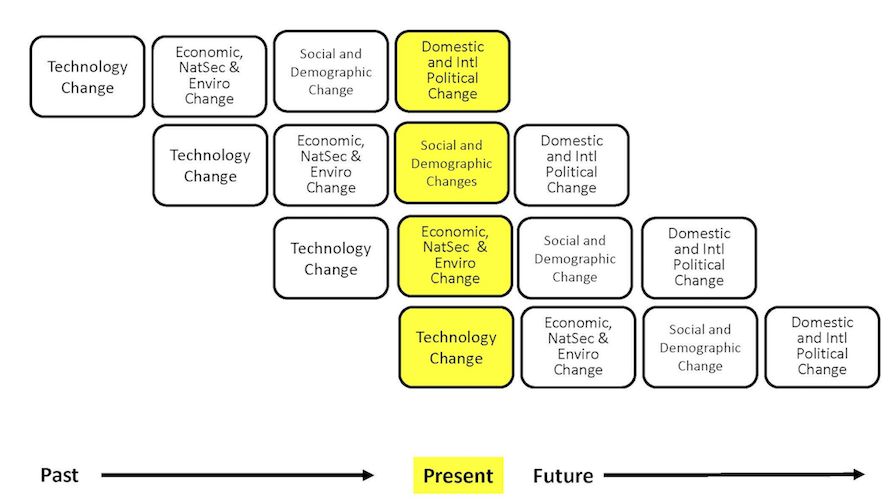
While most media coverage of these systems focused on flows (e.g., the size of the government deficit), rapid non-linear change in complex adaptive systems is often caused by a key stock (e.g., the amount of outstanding government debt) exceeding a critical threshold.
The next table highlights the key macro system stocks that we monitor.
In the next section, we will discuss information received over the past month that is related to these stocks, and which we believe is significant to our assessment of the probabilities that a critical threshold will be reached and a regime change will occur. We will conclude with our estimate, at the end of this month, of how close the macro system is to these critical thresholds, and the implications for financial market regime change probabilities.
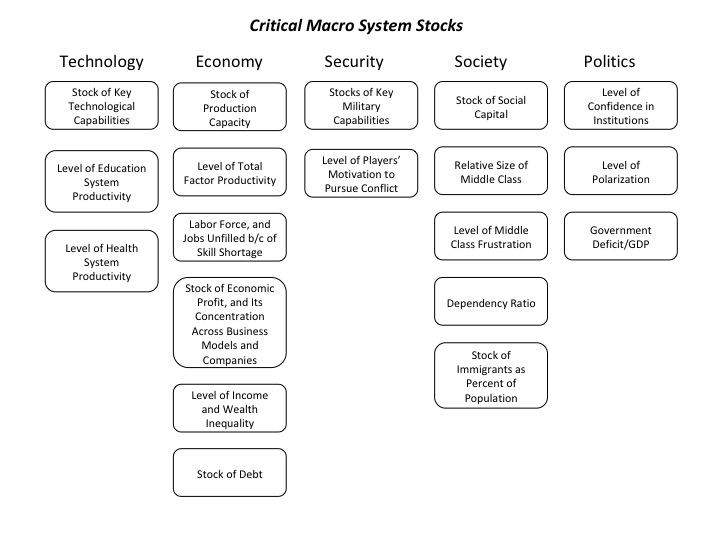
How Close is the Macro System to One or More Critical Thresholds?
As we have noted, the macro drivers of financial market regime changes typically follow a rough chronological sequence, from technology to economic, security, social, and political causes and effects. Yet there are many feedbacks loops between them, creating complex root causes for many of the critical thresholds we have identified.
Understanding the time dynamics in this complex system is critical to avoiding substantial downside investment risk.
We use the UK Met Office Warning Model to communicate our assessment of these time dynamics. We estimate the time remaining before a critical macro system threshold is reached that could trigger a regime change, which is usually accompanied by substantial changes in asset class valuations.
The model uses three increasingly serious levels of warning, from “Be Aware” (condition yellow), to “Be Prepared” (condition orange), to “Take Action” (condition red).
For our purposes, we denote as “Be Aware” (yellow) critical thresholds that we assess to be three or more years away. We estimate that “Be Prepared” (orange) thresholds could be reached within 1 to 3 years. “Take Action” thresholds are very likely to be reached within one year.
Given their nature, we also note that in our three “wildcard” areas (Environment and Energy related; Disease and Human Caused Bioevents; and Cyber and Electromagnetic Events), our forecasts have higher levels of uncertainty.
The following charts summarize our current estimate of the time remaining before different critical thresholds will be reached.
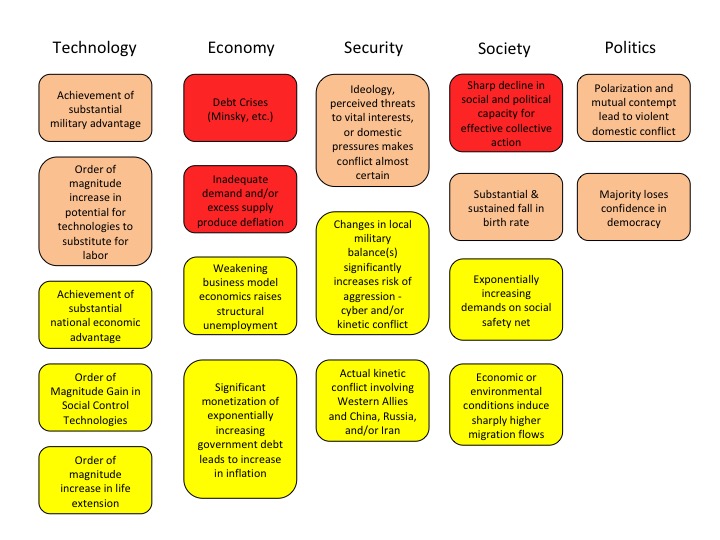
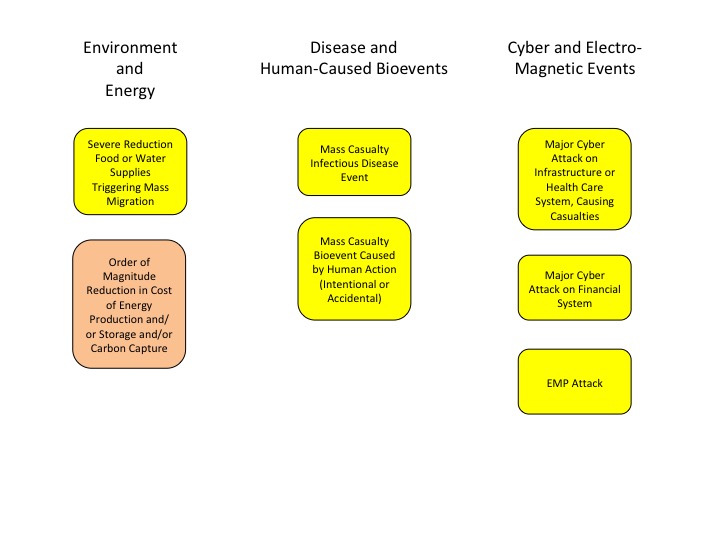
At the highest level, we believe the complex adaptive global macro system can be in one of four states, based on its degree of order versus disorder, and degree of social cooperation versus conflict. A very coarse-grained reading of history suggests that these states evolve in a predictable cycle, from ordered/cooperative, to disordered/cooperative, to disordered/conflicted, to ordered/conflicted.
We believe that the system is currently in its most uncertain state, characterized by high degrees of underlying disorder and social conflict, both domestically and internationally. Beyond some point, intensifying conflict eventually increases the degree of order in the system. That appears to be happening now, via the increasing conflict between China, Russia, and Iran and the United States and other Western nations.
If you have any questions about anything we have written in this issue, please don’t hesitate to get in touch, at contact@indexinvestor.com
Appendix: Anticipatory Thinking and Forecasting Methodologies
Our process is based on methods and tools developed over the past seven years at our affiliate, Britten Coyne Partners, which provides consulting services and education courses to executive teams and boards on strategic risk governance and management.
At The Index Investor, we engage in both anticipatory thinking to identify what could happen (e.g., different macro regimes and related events), and forecasting, to estimate the probability that events and regimes will happen, and the impact they will have if they do (e.g., on macro variables and broad asset class returns).
With respect to what could happen, we are acutely conscious of the conclusion reached by a 1983 CIA study of failed forecasts: "each involved historical discontinuity, and, in the early stages…unlikely outcomes. The basic problem was…situations in which trend continuity and precedent were of marginal, if not counterproductive value."
When it comes to forecasting, we know that in complex socio-technical systems that are constantly evolving, the accuracy of statistical or machine learning based forecasting methods declines exponentially as the time horizon lengthens, since the historical data set on which they were trained will (depending on the speed and effectiveness of any retraining cycle) bear less and less resemblance to the distribution of outcomes the system is likely to produce in the future.
Under these circumstances, forecast accuracy over longer time horizons depends on causal and counterfactual reasoning about the possible future effects of multiple interacting trends and uncertainties that are hard to quantify.
And we are acutely aware of the economist Rudi Dornbusch's famous warning: "Crises take a much longer time coming than you think, then happen much faster than you would have thought."
Our forecasting process also draws on lessons Tom Coyne learned from spending four years as a member of the Good Judgment Project team, which won the Intelligence Advanced Research Projects Activity’s forecasting tournament with forecast accuracy that was more than 50% better than the tournament's control groups (the team's experience is described in Professor Philip Tetlock's book, “Superforecasting").
Our analysis focuses on the probability of the global macro system being in four possible macro regimes 12 and 36 months from the date of our forecast: (1) Normal Times, where equity asset classes perform well; (2) a High Uncertainty regime that is usually short and transitory, where asset classes like short-term government bonds perform best and equities suffer significant declines; (3) High Inflation (which we deem 5% or more, year-on-year), where commercial property, real return bonds and other traditional hedges are favored; and (4) Persistent Deflation (a year-on-year decline in the US CPI), which up to now has only been seen in Japan, and in which the relative performance of different asset classes remains uncertain, but will likely favor high quality bonds and the consumer staples equity sector.
In response to subscriber requests, we have added a 36-month regime forecast to our existing 12 month forecast. The logic is that, in a complex evolving system like global macro, a longer forecast horizon gets beyond the “detection range” of algorithmic forecasting approaches, and therefore raises probability that a manager/investor can gain an edge in identifying emerging threats and opportunities.
That said, because evolving (i.e., “non-stationary”) complex systems populated by highly connected human agents are also capable of sudden non-linear changes (with which are hard for algorithmic approaches to predict), we are also keeping our 12 month forecast.
Our forecasting methodology starts with base rate/reference case data about the historical probability of large changes in equity and bond valuations. We then analyze the current situation from both a quantitative and qualitative perspective. In the latter, we focus on the key endogenous drivers of macro regime change, including technological, economic, national security, social, and political trends and uncertainties. We also focus on three potential sources of exogenous shocks that could also produce a macro regime change, caused by environmental, disease, and cyber related events.
While most of our attention typically focuses on various flows (e.g., economic growth, change in the price level, sales, earnings, job creation, etc.), endogenously caused regime changes result when those flows push key stocks beyond a critical threshold or tipping point, often setting off non-linear reactions across multiple areas. As noted by Hyman Minsky and others, a classic example is the steady accumulation of outstanding debt until it reaches the point where it can no longer be serviced and triggers a crisis.
Base Rate Data
Since the end of World War Two, there have been fifteen months where a downturn in the US equity market began that eventually reduced asset class value by 20% of more. That is a hazard rate of about 1.75% per month. Put differently, in any given month there is a 98.25% probability that a 20%+ downturn won’t occur, or, in a given year, an 81% probability.
However, as the time without a 20%+ downturn extends, the compound probability that one will not occur shrinks. At the end of August 2018, it is more than nine years since the last equity market decline of 20% or more. The probability of that happening is only 15%.
To estimate the base rate for a 20% fall in bond prices (which historically has been caused by a sharp increase in inflation, as we saw in the late 1970s and early 1980s), we analyzed monthly historical AAA bond yields since 1919. For consistency, we used them to calculate the price of a ten-year zero coupon bond. We then calculated the probability of a price decline of 20% or more over three different holding periods: 12, 18, and 24 months. In any month, the annualized probability of a decline of 20% or more over the subsequent 12 months is 12%; over 18 months, 20%, and over 24 months, 25%.
Market Stress Indicators Methodology
We view financial markets as a complex adaptive system. The size of changes generated by such a system follows a power law rather than a normal (Gaussian) distribution. The critical point is that large changes are much more common in complex adaptive systems than most people’s intuition leads them to believe.
While predicting the behavior of complex adaptive systems remains far more art than a science, various researchers have found that large changes in such systems are often preceded by subtle warning signs, as stress accumulates within them. While this research is not definitive, we believe that five warning signs are worth monitoring as potential indicators of growing stress within financial markets that could suddenly give rise to large changes in asset class valuations.
Our first indicator is the month-to-month autocorrelation of broad asset class returns (i.e., the relationship of this month’s returns to last month’s). A system under increasing stress loses resiliency, causing it to take longer to recover from perturbations; hence, autocorrelation increases as it approaches a critical transition (see, “Early Warning Signals for Critical Transitions” by Scheffer, et al).
The second market stress indicator we monitor is the Economic Policy Uncertainty Index published by the Federal Reserve Bank of St. Louis (via its FRED economic database), which is based on research by Baker, Bloom, and Davis (see their paper, “Measuring Economic Policy Uncertainty”). The index is based on automated text analysis of leading newspapers and magazine publications, to identify the frequency with which words and phrases are used that indicate uncertainty.
In humans’ evolutionary past, when uncertainty increased the probability of survival was enhanced by staying close to a group. All of us still have that instinct. Research has found that as uncertainty increases, we have an unconscious bias towards higher conformity of our own views with those of a larger group (i.e., reduction in cognitive diversity). Behaviorally, heightened uncertainty induces more “social copying” of others, likely due to both conformity bias and the rational belief that others may be acting on the basis of superior information. This increase in conformity and copying makes a social system more ordered as uncertainty increases, and also reduces its responsiveness to perturbations (i.e., increases autocorrelation) because of delays in the social copying process.
The key point is that increasing uncertainty induces more, not less order in social systems, and in so doing primes them for sudden non-linear change.
Our third market stress indicator is the spread between the yield on AAA rated bonds and the 10-year US Treasury. This is a proxy for the level of investor concern about financial system funding liquidity.
Our fourth market stress indicator is the yield spread between speculative BB rated bonds and the ten-year US Treasury. Throughout history, excessive credit growth has been a root cause of many financial crises. An indicator of such growth is falling credit spreads, particularly in the case of riskier borrowers. In contrast, rising BB spreads indicate growing investor concern about the consequences of such growth, and the financial distress lower rated companies could experience in an economic downturn.
Our fifth market stress indicator is what we term the “political risk premium” that is implicit in the price of gold. Our starting point for estimating this premium is the three different roles that gold plays. First, gold is a store of value in a world of fiat currencies. When the rate of money supply growth exceeds the growth of nominal GDP, gold’s price should increase to maintain its purchasing power. Between 2007 and 2017, the US money supply (M2) grew by about 86%, while nominal US GDP grew by 35%. The stock of gold grew by 18%, based on mine production over this period. We therefore infer that 33% of the increase in the price of gold represented the maximum potential gold price change that could be attributed to a desire to hedge inflation risk (86% less 35% less 18%).
Second, gold is a unit of account. We take this to mean that the annual change in GDP expressed in terms of physical gold (i.e., nominal GDP divided by the price of gold) should equal the change in real GDP calculated using the GDP price deflator to account for actual inflation over the period. A key challenge is the point at which to start this calculation.
We chose the price of gold in 1995/1996. In that period, the change in real global GDP measured using the IMF’s price deflator just about equaled the change in GDP measured in terms of physical gold. We interpret that coincidence as indicating that at that point in time, concerns about future inflation and political risk were minimal, and the change in the price of gold was mostly driven by its role as a unit of account. We calculated a subsequent series of gold prices that would produce the same change in “gold GDP” as the actual real GDP as calculated by the IMF. Between 2007 and 2017, “gold as a unit of account” warranted a 21% increase in its price.
Gold’s third role is as a hedge against inflation and what we term “political disaster” risk. We subtract the 21% estimated compensation for actual inflation from the 33% “gross” inflation risk hedge to derive an apparent 12% increase in the gold price that reflected the true risk premium to hedge against possible future inflation. However, between 2007 and 2017 the price of gold actually increased by 81%. This implies that 48% of this (81% less 21% less 12%) represented a premium for some other type of uncertainty at the end of 2017. The interesting question is the nature of the uncertainty for which gold is believed by some investors to be a superior hedge than traditional ports in a storm like short-term US government securities, or similar securities issued by other developed countries.
The logical inference is that the uncertainty in question must reflect a situation in which short term US Treasuries would be a less effective hedge than gold. This could be a world of widespread hyperinflation, capital controls, and/or radical changes in nations’ governments (of course, this would also imply a preference for investing in gold coins rather than bullion, as while the latter may be a store of value, it is far less convenient as a means of paying for transactions).
To put this in further perspective, this gold price “disaster risk” premium sharply increased from 2008 to 2012, then declined before sharply increasing again after 2016. Arguably, a significant part of the former increase reflects concerns about the potential inflationary consequences of dramatic quantitative easing by central banks. But this is not likely to be the case after 2016.