The Index Investor
February 2021
Recent Quantitative Indicators
Tactical Asset Allocation Implications of Our Forecasts
Forecast Pre-Mortem Analysis
Combining and Extremizing Forecasts to Improve Predictive Accuracy
Feature Article: Ten Years Later: Threats to Political Legitimacy Have Grown More Dangerous
High Value Information Observed Last Month:
- Technology
- Energy and Environment
- Health and Disease
- Economy
- National Security
- Society
- Politics
- Financial Markets and Investor Behavior
Critical System Thresholds/Tipping Points Analysis
Appendix: Anticipatory Thinking and Forecasting Methodologies
Current Macro Forecast
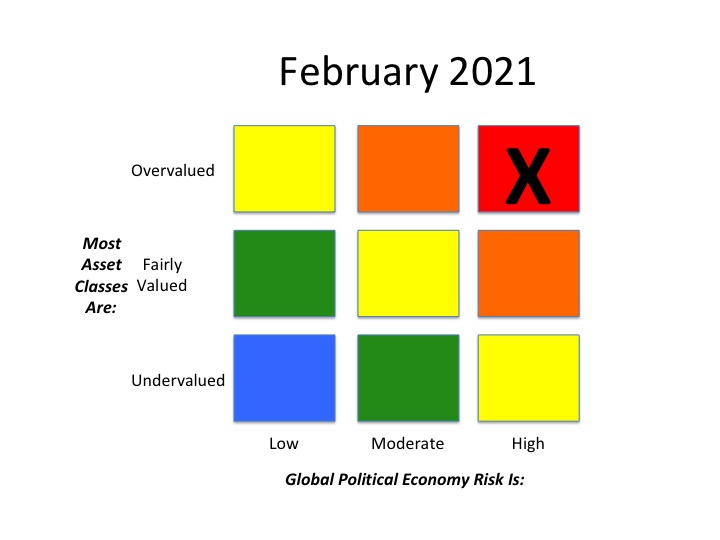
Less mentioned, however, that the risk that increased inflation would almost certainly lead to higher interest rates, which could trigger the rapid deflation of the current bubbles in the debt and equity markets, with cascading negative consequences for the real economy (e.g., a fall in demand, and rising insolvencies, business closures, and unemployment).
But practically absent from the headlines is this equally critical warning from Summers: “If the stimulus proposal is enacted, Congress will have committed 13 percent of GDP [Trump’s $900 billion plus the proposed $1.9 trillion] with essentially no increase in public investment to face the fundamental problems of economic justice, slow, growth and inadequate investment in everything from infrastructure to preschool education to renewable energy [that are] at the heart of Biden’s emphasis on building back better…
“After resolving the coronavirus crisis, how will political and economic space be found for the public investments shat should be the nation’s highest priority?”
In our view, this is the most important objection of all.
Borrowing to sustain consumption rather than increase production rather than to repay the new debt taken on is a recipe for eventual insolvency. At the very least, the current structure of the Biden plan will, to some extent, raise the probability of a future US sovereign debt crisis, which should lead rational investors to demand higher compensation to bear this risk – which in turn increases the likelihood that the debt and equity bubbles will burst, triggering what could become a vicious downward cycle and worsening crisis.
It is also important to recognize that Summers’ objections to Biden’s proposed stimulus plan are also based on a critical unspoken assumption – that economic conditions won’t worsen as the new spending is being implemented.
This brings to mind the time British Prime Minister Harold Macmillan was once reportedly asked what had been the greatest influence on his administration. “Events, dear boy, events”, he supposedly replied.
One way to think about this is as the compound probability that not one of a series of potential events that would have substantial negative consequences will occur over the next three years.
Consider these possible “events” that the Biden administration could confront:
(1) An increase in inflation, and the popping credit and equity market bubbles rising rates would very likely trigger;
(2) A US sovereign debt and/or dollar crisis (though the latter would also require a more attractive new currency home for investors fleeing the dollar, which at this point seems unlikely);
(3) An LDC debt crisis, due to heavy corporate borrowing in foreign currency;
(4) A Eurozone sovereign debt crisis, most likely triggered by Italy;
(5) A severe private sector solvency crisis, as the government support that enabled many companies to survive during the pandemic is withdrawn but the economy remains weak;
(6) SARS-CoV-2 mutations that significantly reduce vaccine efficacy, forcing another return to lockdowns (as we have recently seen in the UK and EU);
(7) A violent conflict between the US and China (most likely over Taiwan), or between the US and/or Israel and Iran
Let’s very optimistically estimate that there is a 95% probability that each of these seven potential crises will NOT occur over the next 12 months. Let’s also optimistically assume they are independent (which some of them almost certainly aren’t – i.e., if one happens it could trigger some of the others).
Mathematically, this means that there is only a 70% joint probability (95% to the 7th power) that none of them will occur over the next year. Looked at differently, it means that there is a 30% probability that one will happen.
What if we extend the forecast horizon to three years? If there is a 70% probability that none of these crises will occur in the first year, there is only a 34% chance that none of them will occur over the next three years (70% to the third power)– and therefore a 66% chance that at least one of them will.
As Macmillan said, “events, dear boy, events.”
If one or more of these potential crises occurs, the immediate negative shock to demand (and quite possibly supply too) and the indirect (and likely longer lasting) negative shock to uncertainty will very likely be substantial.
In this scenario, the extra stimulus provided by Biden’s $1.9 trillion stimulus may very well be critical to preventing an even worse economic collapse. So from this perspective, Biden’s approach appears to be a prudent response to multiple downside risks, and Summers’ concern about overheating the economy is overblown. But his objection that too much of the proposed Biden stimulus package is focused on consumption and not enough on investment still stands.
This Month’s Regime Forecasts
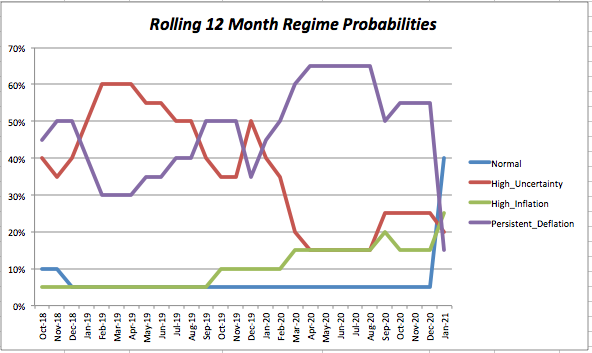
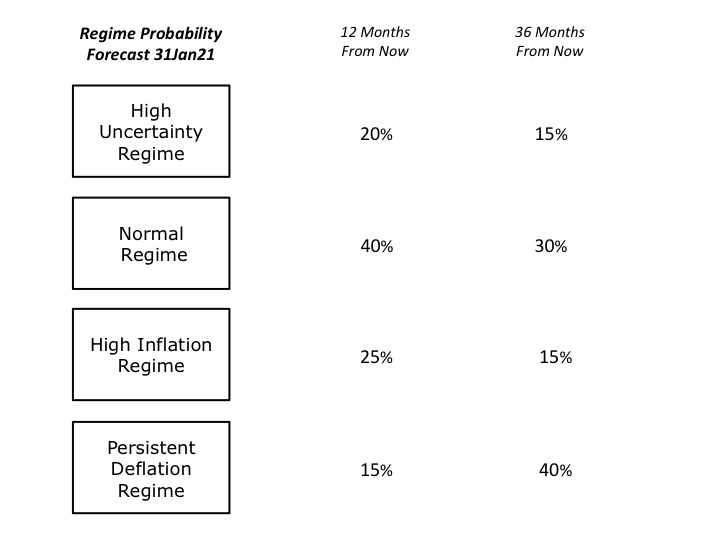
In light of the size and composition of the Biden stimulus package, and the progress of COVID vaccination programs, we forecast that the probability of being in the Normal Regime 12 months from now has risen to 40%. However, based on the assumption that COVID’s negative impact on supply capacity will not recover quickly, we forecast that there is a 25% probability that 12 months from now we could be in the High Inflation Regime.
However, that high inflation is almost certain to have a negative impact on equity and debt valuations, which could slow spending and increase business insolvencies. The speed at which this could happen, and uncertainty about the depth and breadth of its cascading impact across a complex global economy leads to our forecasts of a 20% probability of being in the High Uncertainty Regime 12 months from now, and a 15% probability of being in the Persistent Deflation Regime (which assumes faster and deeper negative effects).
At a 36-month time horizon, we forecast that there is only a 30% probability of being in the Normal Regime (based on the above “no new crises” analysis). The probability of being in the High Uncertainty Regime is 15%, which assumes that the impact of negative events diffuses relatively slowly across the global economy.
To be sure, we assume the prevailing high level of uncertainty will continue over the next 36 months, as it is mainly rooted in structural, not cyclical factors (e.g., the threat of a Chinese attack on Taiwan, the replacement of jobs by automation and AI technologies, high levels of debt, low productivity, stagnant education systems, SARS-CoV-2’s continuing mutation, etc.).
We assume this high level of uncertainty will depress the recovery of private sector demand after the effects of the Biden stimulus wear off. When this happens, the negative effects driven by deeply rooted structural factors will strengthen. Assuming no Chinese attack on Taiwan, the most important of these will very likely be a sharp increase in insolvencies of highly indebted companies, which will increase deflationary pressures. In light of this, we forecast that 36 months from now there is a 40% probability we will be in the Persistent Deflation Regime, and only a 15% probability we will be in the High Inflation Regime.
Finally, we reiterate that uncertainty in the global macro system remains very high. Under these conditions, people rely more heavily on social learning and copying what others are doing than they do on their own private information and views.
This not only slows the diffusion of new information throughout social systems like economies and financial markets, but also causes these systems to coalesce around a small number of narratives. However, as tension increases on various fault lines in the global macro system, the dominant narrative or narrative grows increasingly fragile.
Under these conditions, rapid, non-linear changes are very likely to occur, that are out of proportion to the apparent trigger that sets them off.
Forecast Logic: Quantitative Indicators
Implications of the Most Recent Three Month Asset Class Returns
Our forecasting methodology also includes quantitative analyses of asset class valuations, market stress indicators, and the level and change in three-month returns, over the most recent and previous three-month periods, for those asset classes, which should perform best under different regimes (in this sense, our regimes can be regarded as macro factors).
We assume that that the rolling three month returns reflect investors’ views regarding the relative probability that a given macro regime will develop in the future.
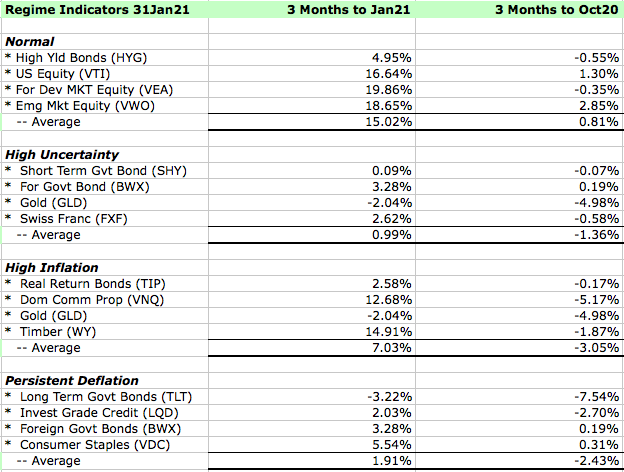
On a 12-month time horizon, we don’t disagree with the regime forecasts implied by recent market returns. At a 36-month time horizon, we think the market’s current expectations are overly optimistic.
Asset Class Valuation and Momentum Indicators (@31Jan21)
| Asset Class (ETF) | Valuation | 1 Month Return | Conclusion |
| US Real Return Govt Bond (TIP) | Almost Certainly Overpriced* | 0.27% | Increasing Overvaluation |
| US Nom Return Govt Bond (GOVT) | Likely Overpriced* | (0.44%) | Decreasing Overvaluation |
| US Investment Grade Credit (LQD) | Within Fairly Priced Range* | (1.83%) | Fairly Valued |
| US High Yield Credit (HYG) | Almost Certainly Overpriced* | (0.38%) | Decreasing Overvaluation |
| US Commercial Property (VNQ) | Within Fairly Priced Range* | 0.04% | Fairly Valued |
| US Equity (VTI) | Almost Certainly Overpriced* | (0.33%) | Decreasing Overvaluation |
| Foreign Devel Mkt Equity (VEA) | Likely Overpriced* | (0.72%) | Decreasing Overvaluation |
| Emerging Markets Equity (VWO) | Almost Certainly Overpriced* | 3.13% | Increasing Overvaluation |
| Timber (WY) | Likely Overpriced | (6.98%) | Decreasing Overvaluation |
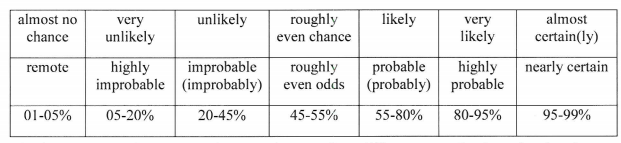
Note: The language we use to describe our estimated likelihood of asset class over or undervaluation is based on US Intelligence Community Directive 203 on Analytic Standards, which includes the following table:
Market Stress Indicators (@31Jan21)
| Market Stress Indicator | This Month vs Last Month |
| Asset Class Returns Autocorrelation (this month versus last month). Higher autocorrelation is an indicator of more tightly coupled and fragile markets. | .30 versus .30 the previous month. This indicates a relatively low level of market stress. |
| Economic Policy Uncertainty Index (how many days over the last 30 was index in top quartile of values since 1985?). A higher number equals more market stress. | On 27 days last month the index was in the top quartile of daily values since 1985 (the 97th percentile of all rolling 30-day periods), a slight decrease from last month. |
| AAA Rated Bonds Spread over 10 Year Treasury Yield (month end). Higher spreads indicate rising concern about market liquidity. | 1.40% (57th percentile since 1983), versus 1.30% (51st) at the end of the previous month, indicating an increasing level of market stress. |
| BB Rated Bonds Spread over 10 Year Treasury Yield (month end). High spreads indicate increasing credit risk. | 2.80%, (37thth percentile) unchanged from 2.79% (37th) last month, indicating a low level of stress. Given our Regime forecast, this is almost certainly inadequate compensation for the risk being taken with BB rated bonds. |
| Gold Price per Ounce in US Dollars (month end). Rising gold prices are an indicator of increasing market uncertainty and stress. | $1,852 versus $1,891, down (2.0%) from the previous month. At the end of 2017, we estimated the “disaster premium” in the gold price was 47% (see our methodology in the Appendix). At the end of last month it was 90%, down from 93% the previous month. |
Portfolio Allocation Implications of Our Forecast
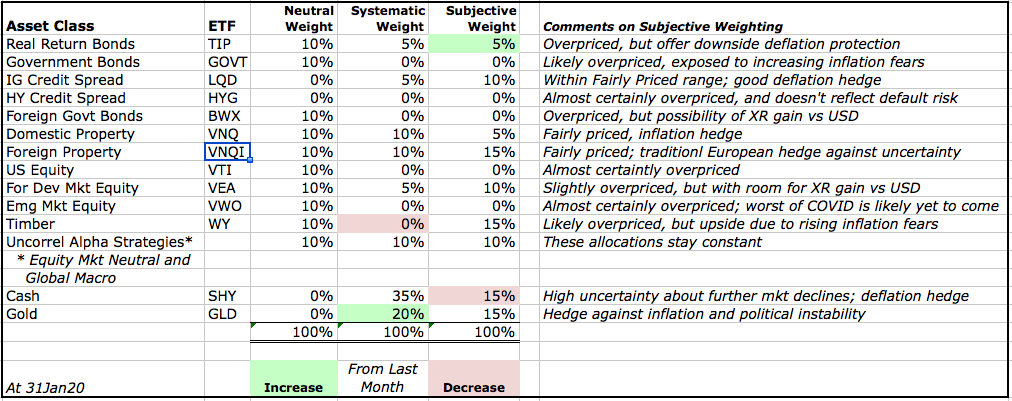
We take two approaches to deriving the tactical asset allocation implications from our analyses (i.e., deviations from our "neutral" or base case model portfolio).
The first takes a systematic approach, and is based on relative asset class valuations. Our starting point is our neutral model portfolio, which is equally weighted across nine broad asset classes, and also includes 5% allocations to alpha strategies (equity market neutral and global macro) that are designed to have a low correlation to returns on broad asset classes.
Based on asset class valuations, we systematically vary the asset class weights (but not the active strategy weight), increasing from 10% to 15% when an asset class is likely undervalued, and 15% when it is very likely undervalued. In the case of overvaluations, we go to 5% and then into cash, if there are no undervalued asset classes with room for an increase. In effect, this replicates the systematic rebalancing strategy we used for 15 years in our previous model portfolios.Based on subscriber requests, this month we are re-introducing a feature from the previous version of The Index Investor: Tactical Asset Allocation Implications from our analyses.
The second tactical approach is based on our subjective view not only of current asset class valuations, but also of the implications of the broader macro trends and uncertainties that we analyze each month. Importantly, this subjective view reflects our primary goal of avoiding large downside losses, rather than seeking large upside gains.
Three final notes: First, with respect to US fixed income, we include credit products (investment grade and high yield) in the same asset class as government debt, and will shift into the former when their valuations become attractive.
Second, we regard gold not as a separate asset class to be held long-term, but rather as a complement to cash, into which we shift in periods of substantial overvaluation across multiple asset classes.
Third, we continue to be deeply concerned by the distortion in asset class valuations that have been created by negative real interest rates on sovereign bonds, which are the foundation of most asset pricing models. In August, we decided to address this distortion by using in our asset class valuation models our estimate of the economically logical real yield on inflation protected US government bonds (TIPs). This brings our quantitative valuation conclusions much closer to those based on our qualitative analysis.
More information about our investment beliefs, including our core philosophy, approach to asset allocation (including our model portfolios and their long-term track record), and views on various approaches to active and passive management can all be found here.
Here is our latest asset allocation view:
Pre-Mortem Analysis
One of the most important forecasting disciplines is to ask yourself why your forecast could be wrong. Dr. Gary Klein’s research has shown that a very powerful and insightful way to do this is via a “pre-mortem analysis.” This method asks you to assume that it is a point in the future, and your forecast has been proven wrong (or your strategy or company has failed). You are then asked to look backward from this imagined point in the future, to explain why you failed, what you missed, and what you could have done differently to avoid your fate.
The pre-mortem method takes advantage of the fact that humans reason much more concretely and in more detail when explaining the past than they do when trying to forecast the future.
So let us assume that it is one year from now, and our current forecast has turned out to be wrong.
How did this happen? What developments did we fail to anticipate?
- A number of world leaders – Xi Jinping and to a lesser extent Vladimir Putin and Ali Khamenei, are all facing weakened economies and declining political popularity. History teaches us that this can lead to increased “foreign adventurism” to distract the public from worsening domestic conditions, and force the nation to rally around its leader in a period of heightened external conflict. Should a “kinetic” conflict develop between China and the United States, or between Iran and Israel, Saudi Arabia, and/ or the US, or between Russia and one or more European countries (e.g., due to a Russian incursion into the Baltics), it would generate a very sharp increase in uncertainty and collapse in currently high asset class valuations, while boosting the price of US Treasuries, gold, timber, and, in Europe, property. An attack by China on Taiwan would almost certainly deepen and prolong the economic recession triggered by COVID. Given high debt levels, this would almost certainly accelerate the arrival of the Persistent Deflation Regime.
- On the other hand, following the election of Joe Biden, the removal from office Xi Jinping could lead to a reduction in the dangerously growing conflict between the US and China. The impact of this surprise seems uncertain. To the extent that reduced external threat reduces the perceived urgency of implementing structural reforms in the US, it would increase the probability of the High Inflation Regime. Yet at the same time, it could accelerate economic and political reforms in China, which would increase economic growth there, creating a more dangerous medium term situation for the United States.
- A supply side shock of some type – beyond the disruption of global supply chains caused by COVID-19 -- could produce a sudden increase in inflation. The most likely scenario is a reduction in oil supplies due to a prolonged kinetic conflict between Iran and the US. An unlikely scenario could be major crop failures associated with the next solar cycle, which NASA forecasts will be the weakest in 200 years. McKinsey recently concluded that the probability of such a failure has increased due to changes in the environment, and now stands at about 10% over the next five years ("Will the World’s Breadbaskets Become Less Reliable?”).
Note: Combining Our Forecasts with Others From Other Sources and Extremizing the Result Should Increase Your Predictive Accuracy
Research has found that three steps can improve forecast accuracy. The first is seeking forecasts based on different forecasting methodologies, or prepared by forecasters with significantly different backgrounds (as a proxy for different mental models and information). The second is combining those forecasts (using a simple average if few are included, or the median if many are). The final step, which significantly improved the performance of the Good Judgment Project team in the IARPA forecasting tournament, is to “extremize” the average (mean) or median forecast by moving it closer to 0% or 100%.
Forecasts for binary events (e.g., the probability an event will or will not happen within a given time frame) are most useful to decision makers when they are closer to 0% or 100% than the uninformative “coin toss” 50%. As described by Baron et al in “Two Reasons to Make Aggregated Probability Forecasts More Extreme”, forecasters will often shrink their probability estimates towards 50% to take into account their subjective belief about the extent of potentially useful information that they are missing.
When you average multiple forecasters’ estimates, you are including more information, which should increase forecast confidence and push the mean estimate closer to 0% or 100%. However, this doesn’t happen when you use simple averaging. For this reason, forecast accuracy is increased when you employ a structured “extremizing” technique to move the mean estimate closer to 0% or 100%.
You can download an extremizing model from our website to use when combining the forecasts you use in your decision process.
The extremizing factors in our model are those that the Good Judgment Project found maximized the accuracy of combined forecasts. Note that the extremizing factor is lower when average forecaster expertise is higher. This is based on the assumption that a group of expert forecasters will incorporate more of the full amount of potentially useful information than will novice forecasters.
Feature Article: Ten Years Later: Threats to Political Legitimacy Have Grown More Dangerous
In May and September of 2010, The Index Investor published feature articles on what we then called “the growing threat to political legitimacy.” You can download both of them here.
The story actually begins much earlier. I still remember listening to a speech my father gave, back n 1977 or 1978, when he was sixty. He recounted all the shocks that had hit everyone in the room over the past decade, including the assassinations of Martin Luther King Jr. and Robert Kennedy; the riots at the 1968 Democratic Convention, the election of Richard Nixon, the tremendous shift in the Democratic Party followed by the landslide loss of George McGovern in 1972, Watergate and Nixon’s resignation, the 1973 oil shock, the rise of inflation and how it devastated many people’s standard of living, and the fall of Saigon and shock that the United States had lost a war.
For the generation who thought they had seen it all, after having grown up through the Depression and won World War Two, the events of the past decade had left them stunned and disoriented.
I’ve never forgotten what my father said next. What really worried him that night was two things: the decline of manufacturing in southern New England, and the rise of conspicuous consumption by a generation that, not having been raised on stories of the bitter conflicts that accompanied industrialization or lived through the Depression, could not see it for the “social cancer” it was. His pessimistic conclusion that night was that if things didn’t change, the years ahead were going to get harder and harder for “Joe Middle Income.”
And that, unfortunately, is what has happened over the past 40 plus years.
I have a collection of books that documents different observers’ concerns about the path the country has been on. Here are the ones that were published in the eighties and nineties:
The Culture of Narcissism: American Life in an Age of Diminishing Expectations, by Christopher Lasch (1979)
Managing Our Way to Economic Decline, by Hayes and Abernathy (1980)
The Rise and Decline of Nations, by Mancur Olson (1982)
The Closing of the American Mind, by Allan Bloom (1987)
The Rise and Fall of the Great Powers, by Paul Kennedy (1987)
The Bonfire of the Vanities, by Tom Wolfe (1987)
The Collapse of Complex Societies, by Joseph Tainter (1988)
Fear of Falling, by Barbara Ehrenreich (1989)
The Politics of Rich and Poor, by Kevin Phillips (1990)
The Overworked American, by Juliet Schor (1991)
Culture Wars: The Struggle to Define America, by James Davison Hunter (1991)
Post Modernism: The Cultural Logic of Late Capitalism, by Frederic Jameson (1991)
Whither the Middle Class? by Duncan and Smeeding (1991)
Populism and Elitism, by Jeffrey Bell (1992)
Boiling Point: Democrats, Republicans, and the Decline of the Middle Class, by Kevin Phillips (1993)
Culture of Complaint: The Fraying of America, by Robert Hughes (1993)
The Revolt of the Elites and the Betrayal of Democracy, by Christopher Lasch (1994)
The Good Life and Its Discontents, by Robert Samuelson (1995)
The End Of Affluence: The Causes And Consequences Of America's Economic Dilemma, by Jeff Madrick (1995)
The Overspent American, by Juliet Schorr (1997)
What’s Wrong with Critical Race Theory: Reopening the Case for Middle Class Values, by Daniel Subotnik (1998)
Luxury Fever, by Robert Frank (1999)
One Nation, Two Cultures, by Gertrude Himmelfarb (1999)
Bobos in Paradise, by David Brooks (2000)
Why the White Working Class Still Matters, by Teixeira and Rogers (2000)
Bowling Alone, by Robert Putnam (2000)
The 2000s proved to be a far more tumultuous decade that the 80s or 90s, as we were hit with a series of shocks.
These included Al Gore challenging the legitimacy of the 2000 election outcome in the courts, the 9/11 terrorist attacks (and others in Europe), the exponential increase in globalization and outsourcing of production following China joining the World Trade Organization at the end of 2001, the 2003 Iraq War, the housing boom, and the Great Financial Crisis in 2008.
Throughout the decade, the economic and social challenges facing the middle class continued to worsen and its resentments increased as a rising share of income went to those at the top, and fueled their conspicuous consumption. The elite’s growing contempt for the masses was painfully brought into widespread public view by Barak Obama’s jarring comment about working class voters in old industrial towns during his 2008 campaign for president: “They get bitter, they cling to guns or religion or antipathy to people who aren't like them or anti-immigrant sentiment or anti-trade sentiment as a way to explain their frustrations.”
That was the background for our 2010 analyses of what we termed, “the growing threat to political legitimacy.”
Summary of our 2010 Analysis
In 2010 we observed that, “It is safe to say that the world economy has entered a period characterized by complex and dangerous dynamics that few people even begin to understand. And even fewer people have tried to think more than a few steps ahead, about where these dynamics may take us, much less what those future scenarios imply for asset allocation and risk management decisions today.
“It goes without saying that any attempt at such thinking is bound to be imperfect, given the complex and evolving nature of the underlying system that is generating the rapid and often confusing changes we see all around us today. Nevertheless, professionals who have been entrusted with the management of other people’s money, and especially those who have a fiduciary duty to their clients, have an obligation to think about these issues” …
“Our current analytical framework is based on the assumption that the world faces four critical and interrelated challenges whose potential effects are non-linear. This makes them both hard to understand, and raises the likelihood that we will underestimate their potential impact and will be surprised by the rapid changes they may cause.
“The first challenge is the fragile nature of the global financial system, in which a very large amount of debt of highly uncertain quality rests on a very thin capital base. On the other side of this equation is the precarious position of many parties that are struggling to repay and/or rollover that debt, including households, some corporations (e.g., commercial property developers), and various levels of government, up to and including some sovereign nations.
“The second challenge is the weakened and imbalanced state of global aggregate demand…
“The third challenge facing the world economy is the risk that developed economies will slip into an extended period of deflation, similar to Japan’s experience since the bursting of its property and equity bubble in 1989…
“The final challenge we face is maintaining the legitimacy of various political institutions that function as control parameters for the global economy and financial markets. These institutions are both international (e.g. rules governing multilateral trade and capital flows) and domestic (e.g., rules governing taxation and redistribution), and face economic and social stresses not seen since in most countries since the 1930s…
“In essence, the “muddling through” scenario assumes that all these challenges will be met, and that the main price we will pay is a prolonged period of slower economic growth (the truly rosy scenario assumes that rising domestic demand in emerging markets will cause them to become the new motor of the world economy, which in turn will return global growth to its previously high levels).
“The downside scenario assumes that we will fail to meet one or more of these challenges, and, given their complex interrelationships and non-linear effects, the result will be an extended period of stagnation whose severity will take many people by surprise…
In our 2010 analysis, we applied different frameworks to better understand the growing political legitimacy crisis.
“Perhaps the best inductive framework has been developed by the Political Instability Task Force, a group of scholars that was originally formed in 1994 and whose work was funded by the U.S. Central Intelligence Agency (the task force’s public website can be found here). In their paper “Modeling Transitions To and From Democracy”, Ulfelder and Lustik summarize the key factors that are associated with these two types of political legitimacy crises (see also, “How to Construct Stable Democracies” by Goldstone and Ufelder).
“This research concludes that increasingly factionalized political competition increases the probability of transition away from democracy. These transitions are also characterized by (1) heightened parochialism (major political parties focus on the interests of a narrow group, rather than nation as a whole); (2) heightened polarization (competition over central authority is increasingly a winner-take-all struggle); and (3) rising mobilization (rival groups begin to pursue their interests through collective action). All of these are amplified by deteriorating economic performance.”
From a deductive perspective, we observed that the growing crisis of political legitimacy could be described as a complex contagion that was driven by causes deeply rooted in our evolutionary past.
“For complex contagions to spread, multiple sources of activation are required. Hence, complex contagions are more likely to spread when individuals in a network observe a new behavior or belief in a significant number of the other individuals to whom they are linked…
“More specifically, two conditions are required for the transmission of a complex contagion.
“First, an individual has to be susceptible to it, in the sense that his or her current behavior or beliefs are not achieving goals or satisfying needs that are important to the individual. Second, a threshold must be met, with a minimum number of other linked individuals adopting the new behavior or belief.
“In the context of the changes in collective beliefs and behavior that triggers a political legitimacy crisis, we believe the susceptibility criterion is ultimately grounded in a sufficient number of people fearing for their future. A person must have a very powerful motivator to question the legitimacy of a political system; only fear can provide that.
“In previous issues, we have written at length about the complex neurobiology of fear, and its relationship to the role played by the amygdala (a primitive part of our brain). To simplify, there are two key primary fear triggers: the experience of uncertainty, and the experience of loss. The latter can be either absolute, as in the loss of resources, or relative, as in the loss of relative social status. Once a primary fear is triggered, people also experience a heightened secondary fear of social isolation. All of these emotional reactions probably increased our ancestors’ chances for survival on the East African plain, and are therefore likely hardwired into us by evolution.
“With respect to the threshold criterion, research has shown that there is a complicated relationship between the emotions triggered by gains and losses and whether these outcomes result from our action or inaction.
“Our emotional reactions to gains and losses, and our preferences for errors of commission and omission, seem to be deeply connected with whether those gains and losses are private or visible to a social group within which we believe our relative social status is important.
“When they know the results of a decision will be private, human beings prefer errors of omission, in order to avoid feeling regret. However, when the results will be public, they prefer errors of commission to avoid feelings of envy (see “Interdependent Utilities: How Social Ranking Affects Choice Behavior” by Bault, Coricelli, and Rustichini).
“Think of this as a switch from a system dominated by negative feedback to one dominated by positive feedback.
“From this perspective, political legitimacy crises result when a social network passes two critical points: first, feelings of fear arise in a sufficiently large number of people, and second, there is a willingness to go beyond our natural preference for errors of omission rather than errors of commission, because enough socially important individuals to whom we are linked are adopting new beliefs and behaviors.
This is not to say that all situations that pass the susceptibility and social threshold tests will trigger a legitimacy crisis. A full-blown crisis requires that collective action is undertaken not just by isolated local networks of individuals, but by many such networks in parallel. In this regard, modern technology has made this transition much more likely, as it has enabled the creation of vastly more network links, both between local individuals and between local networks themselves. So called “flash mobs” are one example of this, as are the “color revolutions” we have seen in a number of countries in recent years…
“From a social network perspective, more and more people are fearful for their jobs and their futures, and increasingly frustrated by the inability of the political system to respond in a manner that reduces these fears.
“More important, people increasingly realize that many other people in their social networks – and in similar networks around their countries, if not the world – share their fears. The Tea Party movement in the United States is a logical result of this situation, and shows that for a growing number of people, the collective action threshold has been passed.
“However, this still begs the question of the extent to which these growing frustrations and signs of collective action are translating into a growing crisis of political legitimacy.
“In our view, there is evidence that this is, in fact, occurring. For example, a growing number of commentators have noted the sharply widening gap in the United States, and likely in other countries as well, between the views of the elite and the views of the masses.
“For example, the pollster Scott Rasumussen has found that 68% of likely voters “say the political class doesn’t care what most Americans think”, while 84% say that America is headed in the wrong direction. In contrast, 67% of what Rasmussen terms the “political class” thinks America is headed in the right direction (for more of his analysis, see Rasmussen’s recently published book, In Search of Self Governance).
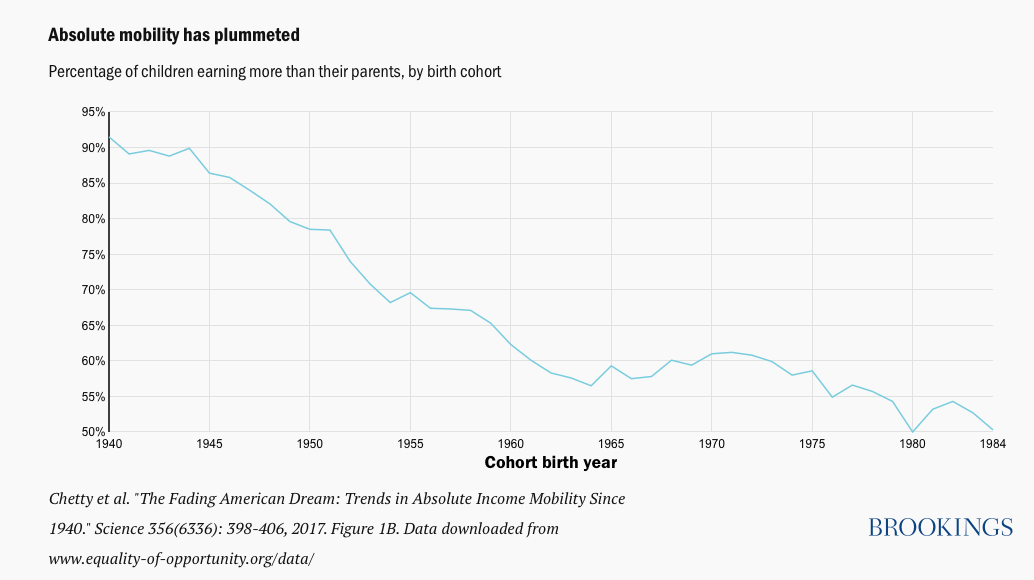
“Peggy Noonan also captured this sentiment in a recent Wall Street Journal column (“America Is At Risk of Boiling Over”, 6Aug10). She noted that, “The biggest change in my political lifetime is that Americans no longer assume that their children will have it better than they did. This is a huge break with the past, with assumptions and traditions that have shaped us.”
As the following chart shows, Noonan was spot on:
“In sum, we see widespread evidence today of an accelerating decline in the perceived legitimacy of the political institutions that govern the behavior of critical aspects of the global economic system”.
“We believe that this legitimacy crisis is most visible today at the international level. However, there is also evidence that domestic legitimacy crises are also building in the United States, China and the European Union. This trend represents a significant source of increased uncertainty for the operation of financial markets and the future returns on different asset classes.”
What Happened Between 2010 and 2020?
In the ten years since our report on the rising threat to political legitimacy was written, a number of critical changes have occurred:
• An ever growing number of people are experiencing either stagnant or declining living standards in the evolving 21st century economy, in which it has become harder and harder to maintain a middle class standard of living;
• This has led to the broadening and worsening of multiple social pathologies, including family breakdown, addiction, and a rising number of “deaths of despair.”
• Across economic, social, and political dimensions, the gap between various elites and the masses has grown wider, with the former increasingly treating the latter with condescension and contempt. In return, the masses have grown increasingly angry with and contemptuous of elite individuals and institutions because, “nobody’s helping us.” For example, Peggy Noonan wrote this in her February 2016 column on “Trump and the Rise of the Unprotected”: “What marks this political moment, in Europe and the U.S., is the rise of the unprotected. It is the rise of people who don’t have all that much against those who’ve been given many blessings and seem to believe they have them not because they’re fortunate but because they’re better” (for more on this, see Daniel Markovits’ 2019 book, “The Meritocracy Trap: How America's Foundational Myth Feeds Inequality, Dismantles the Middle Class, and Devours the Elite”).
• This increasingly poisonous social conflict has transformed politics from an arena in which policy differences are discussed and compromises reached in order to move the nation forward to one in which political parties have become tribal identities, increasingly pulled towards their populist extremes. In short, politics is now seen as a zero sum game in which one party increasingly denounce “wins” by the other party as “illegitimate.”
The Capitol riot on January 6, 2021 was just the latest step down the dangerous road we have been on for a long time.
This has not gone unnoticed; in the last ten years vastly more books have been written about our deteriorating economy, society, and politics than was the case in the eighties, nineties, and noughties.
Since we published our 2010 analysis, here is just a small selection of the many books that have appeared:
The Ruling Class, by Angelo Codevilla (2010)
Age of Greed: The Triumph of Finance and the Decline of America, 1970 to the Present, by Jeff Madrick (2011)
The Great Stagnation, by Tyler Cowen (2011)
Time to Start Thinking: America in the Age of Descent, by Edward Luce (2012)
Coming Apart: The State of White America 1960 - 2010, by Charles Murray (2012)
The Great Degeneration: How Institutions Decay and Economies Die, by Niall Ferguson (2013)
The New Class Conflict, by Joel Kotkin (2014)
The Revolt of the Public, by Martin Gurri (2014)
Political Order and Political Decay, by Francis Fukuyama (2014)
Our Kids: The American Dream in Crisis, by Robert Putnam (2015)
Makers and Takers: How Wall Street Destroyed Main Street, by Rana Foroohar (2016)
Hillbilly Elegy: A Memoir of a Family and Culture in Crisis, by JD Vance (2016)
The End of Loyalty: The Rise and Fall of Good Jobs in America, by Rick Wartzman (2017)
The Vanishing Middle Class: Prejudice and Power in a Dual Economy, by Peter Temin (2017)
Crashed: How a Decade of Financial Crises Changed the World, by Adam Tooze (2018)
Them: Why We Hate Each Other and How to Heal, by Ben Sasse (2018)
Squeezed: Why Our Families Can't Afford America, by Alissa Quart (2018)
The Forgotten Americans: An Economic Agenda for a Divided Nation, by Isabel Sawhill (2018)
The Coming Neo Feudalism, by Joel Kotkin (2020)
Deaths of Despair and the Future of Capitalism, by Deaton and Case (2020)
A New Contract with the Middle Class, by Reeves and Sawhill (2020)
What were the critical changes that accelerated the deterioration of political legitimacy between 2010 and today?
New Technologies Improved and/or Emerged.
• Perhaps the most important were automation (which led to more losses of previously well paying jobs), supply chain management (which led to more job losses due to offshoring, especially previously well-paid manufacturing jobs), smartphones and platform apps that enabled the rise of the euphemistically named “sharing economy” (which in practice facilitated the growth of poor quality “gig work” jobs); and social media apps which resulted in people becoming “hyperconnected” via text, photos, and video to multiple individuals and networks that provided us with exponentially increasing volumes of information.
Many Developed Country Economies Ceased to Create Enough Well Paid Jobs to Replace the Ones That They Lost.
• Historically, the introduction of new “general purpose technologies” like electricity created as many new jobs as they destroyed. In recent years, however, that has not been happening. Many hypotheses have been advanced to explain this, including tax systems that make it more expensive to hire workers than to automate and outsource jobs; stagnant education systems that have haven’t produced enough talented graduates to enable the diffusion of new technologies beyond a limited number of companies that have the necessary talent, leading to “winner-take-all” industry dynamics;
• Legalization of share buybacks in the United States in 1982, which depressed corporate investment (e.g., “How the Looting of the Business Corporation Became the U.S. Norm and How Sustainable Prosperity Can Be Restored” by Lazonick and Shin); and the financialization of the economy, leading to much greater use of leverage (debt), which further depressed investment rates (and thus productivity growth). The result has been the emergence of a growing bloc of politically volatile under and unemployed people, many of whom are young men who are frustrated and angry at a system they believe has failed them. Throughout history, this has been a dangerous combination.
The Emergence of a “Dual Economy”, Which Added Geographic Inequality to Worsening Inequalities of Income and Wealth.
• Digital industries with relatively high productivity, profits, and pay migrated to the coasts, while the middle of the country retained traditional physical capital industries like energy, agriculture, and manufacturing that were creating fewer jobs than the “new economy” companies. As Joel Kotkin notes in his essay “Economic Civil War”, “Our national divide is usually cast in terms of ideology, race, climate, and gender. But it might be more accurate to see our national conflict as regional and riven by economic function. The schism is between two ways of making a living, one based in the incorporeal world of media and digital transactions, the other in the tangible world of making, growing, and using real things.”
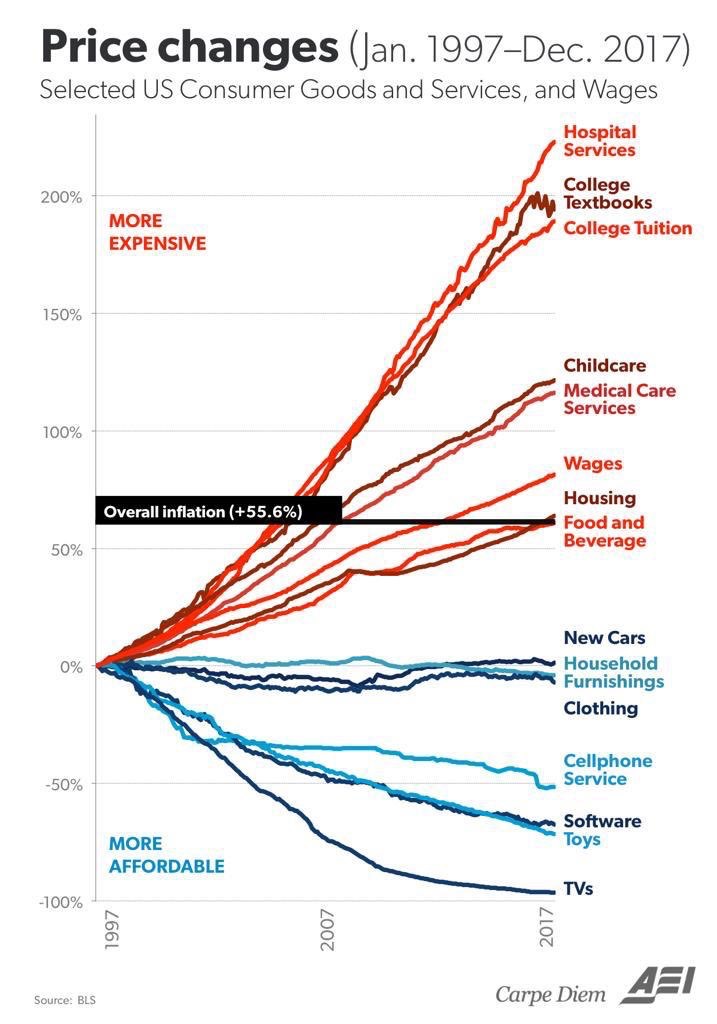
The Costs Of Key Elements of a Middle Class Living Standard Have Increased Much Faster Than Average Hourly Wages.
• At the same time, the profusion of social media photo and video apps has led to a steady flow of posts in which people convey to their networks the carefully crafted image of a lifestyle that is increasingly out of reach of the masses. This supercharging of conspicuous consumption has further increased middle class frustration and anger at a system they no longer believe is fair
• In his 2000 book “Bowling Alone”, Robert Putnam documented the decline of traditional sources of individual belonging and “social capital”, including fraternal organizations, sports leagues, and religious organizations. In the succeeding years, new sources of belonging and identity have arisen with regional, national, or global characteristics, rather than the local organizations documented by Putnam.
• Four examples stand out. I’m old enough to remember when people didn’t wear team jerseys and other kit to sports games and matches to communicate to others their shared loyalty to a team. That began to change in the 80s, and has now become a multibillion-dollar business. Paralleling this (in the United States) has been the transformation of the military from an object of derision after Vietnam, to the object of unquestioning praise and affiliation that shocked my father and his friends who served in World War 2 (and knew from experience that the military was far from perfect). Do you remember people wearing camoflauge and military-style kit in the 1970s or 1980s (well, at least until Top Gun came out)? Or (in the US) such widespread ownership of military style weapons?
• Elsewhere, for some environmentalism has become a powerful source of affiliation, complete with creation, fall, and redemption stories that remind one of a religion. More recently, the “woke” movement has at times seemed like the latest of the “Great Awakenings” that have occurred throughout America’s religious history.
Post-Modernism and Critical Theory (Including Critical Race Theor) First Grew on the Campuses, Then in the Wider Society.
• By far the most important aspects of this were three beliefs. First, that truth and facts is socially constructed, and therefore relative; there are no “objective” facts. Second, that the social construction of truth reflects the relative power of different/cross-sectional identity groups, all of which have been systematically discriminated against by “the patriarchy” of whites, and especially white males. By various routes (especially hyperconnectivity and social media apps) this initially facilitated the emergence of demands for “politically correct” speech, and, more recently, “woke” and “cancel culture” that demands positive discrimination in favor of members of previously oppressed identity groups, and repression of any speech that any member of those groups might find offensive or “problematic.” The highly destructive result of this (beyond the danger it poses to First Amendment freedoms) is that the United States of America has effectively lost its unifying national narrative.
The Business Models of Traditional Journalism and Legacy Media Were Overwhelmed by the Hyperconnectivity and Social Media Tsunami.
• When the news business was a combination of local and national advertising based oligopolies, journalists focused on collecting and accurately reporting facts to their audience, with opinions segregated from reporting on separate “Editorial” and “OpEd” pages. The rise of smart phones, hyperconnectivity, social media apps, and critical theory’s claim that facts and truth are social constructions, not absolutes destroyed the traditional model.
• Roger Ailes sensed the change that was underway when he took over as CEO of FOX News in 2000 and began to build “a Republican oriented CNN.” Others quickly followed, with the realization that traditional industry definitions and barriers had crumbled, and they were now in a brutal competition to deliver an economically attractive audience to advertisers. From here, it was only a short step to the de facto elimination of the barriers between reporting and opinion, and then the increasing use of emotionally arousing “clickbait” stories, the use of algorithms to curate and deliver this content to increasingly microtargeted audiences prized by various advertisers, and the collection of ever increasing amounts of personal data to further optimize this business model. The age of “echochambers” (or, as Shoshana Zuboff calls it, “surveillance capitalism”) was born.
Inevitably, All These Trends Have Led to Political Parties Becoming “Super Identities”, that Are Highly Correlated with Other Identities.
• With greater accuracy than ever before, just by knowing a person’s party affiliation today, you can predict a wide range of their other affiliations and characteristics. Unfortunately, political parties as “Super” or “Meta” identities also leads to tribalism and seeing politics as a zero sum game. Most dangerous of all, a rising number of partisans now treat members of the other party with undisguised condescension and contempt (e.g., “Partisan Antipathy: More Intense, More Personal” by Pew Research, and “Our Radicalized Republic: Can President Biden, Or Anyone Else, Overcome Years Of Rising Partisan Hatred?” by Koerth and Thomson-DeVeaux).
• As the Financial Times’ Isabella Kaminsky bluntly observed, “the groups in play have not just become tribal; they have become splintered into entirely opposing perspectives on cultural norms and reality…This leads to an extremely frightening framing of the fight between them in terms of good and evil” (“A Wilderness of Mirrors in the US”). When a marriage has reached this stage, divorce is almost certain. This is not an environment in which the perceived political legitimacy of government is likely to improve.
Last but not least, political legitimacy has also come directly under attack from two other sources.
The First Was the Democratic and Republican Parties Themselves.
• This began with the 2000 election, when Al Gore challenged the legitimacy of the vote count in Florida, causing the election to effectively be decided by the Supreme Court. After Obama was elected, the “birther” movement challenged his legitimacy. In 2016, the election of Donald Trump triggered the rise of the Democratic “Resistance”, which yet again challenged the legitimacy of an election and the president who won it. In 2020, this routine challenging of the legitimacy of electoral outcomes metastasized into Donald Trump’s repeated denial of his election loss, which led to the January 6th attack on the Capitol as Congress was certifying Joe Biden’s election.
The Other Attack on Political Legitimacy Has Come From Within Government Itself.
• Paul Light is not a name that is familiar to most Americans, including many of those who are most involved in politics. That is a shame. For years, Light has analyzed and publicized the declining competence and capacity of government bureaucracies to effectively resolve the increasingly complex problems they confront (e.g., “The Rebuilder’s Dilemma”, February 2020). Every day, across the United States people experience poor infrastructure, stagnant education systems, overpriced and impenetrable health care systems, and a growing Gordian Knot of regulation, presided over the government bureaucrats whose technical competence and interpersonal skills increasingly resemble the old Soviet Nomenklatura.
• When a government fails to effectively serve the people, and, worse, appears indifferent to their needs, its political legitimacy plummets. And when people increasingly believe the value they get from government in exchange for the taxes they pay is declining, and repeated promises to improve government performance are boken, people logically become more resistant to paying higher taxes – another sign of government’s declining legitimacy. Now the COVID pandemic has made the decline of government competence painfully clear to the entire nation – this time with deadly consequences.
In his recent article, “Rotten to the Core?” Francis Fukuyama summed up his view of the current situation.
“Writing in Foreign Affairs in 2014, I lamented the political decay that had taken root in the United States, where governing institutions had become increasingly dysfunctional. ‘A combination of intellectual rigidity and the power of entrenched political actors is preventing those institutions from being reformed,’ I wrote. ‘And there is no guarantee that the situation will change much without a major shock to the political order.’
“In the years that immediately followed, it seemed possible that the rise of Bernie Sanders and Donald Trump might present a shock of that sort. Revisiting the question of political decay during the presidential campaign of 2016, I was encouraged to see that ‘voters on both sides of the spectrum have risen up against what they see as a corrupt, self-dealing Establishment, turning to radical outsiders in the hopes of a purifying cleanse.’ I also warned, however, that ‘the nostrums being hawked by the populist crusaders are nearly entirely unhelpful, and if embraced, they would stifle growth, exacerbate malaise, and make the situation worse rather than better.’
“Those nostrums were, in fact, embraced by Americans—or at least by enough of them to send Trump to the White House. And the situation has indeed gotten worse. The process of deterioration has continued at a startling pace and on a scale that was hard to anticipate back then, culminating in developments such as the January 6th mob attack on the U.S. Capitol.
“Meanwhile, the underlying conditions that brought on this crisis remain unchanged. The U.S. government is still captured by powerful elite groups that distort policy to their own benefit and undermine the legitimacy of the regime as a whole. And the system is still too rigid to reform itself. These conditions, however, have morphed in unexpected ways. Two emerging phenomena have worsened the situation enormously: new communications technologies have contributed to the disappearance of a common factual basis for democratic deliberation, and what were once policy differences between blue and red factions have hardened into divisions over cultural identity.”
Where do we go from here?
In the 2020 election, Joe Biden received a record 81 million votes. But Donald Trump – in spite of everything – received 74 million. Too many Democrats can’t understand how this happened, or why anybody could vote for a man they so revile and hold in utter contempt. Yet however much Democrats would like to deny it, many of those Trump voters were neither miserably ignorant nor seduced by fake news and foreign manipulation. They had – and still have – serious grievances and needs that they apparently didn’t think a Biden administration would or could meet.
So, ten years after we published our first analysis of declining political legitimacy, how do we think this threat will evolve in the future?
Let’s start with the biggest uncertainty of them all: The future of the US/China conflict. If it continues to intensify and leads to armed conflict with significant American and allied casualties (e.g., as would almost certainly be the case of China attempts to conquer Taiwan by force), political legitimacy will sharply increase, as it did after 9/11, and long ago, after Pear Harbor.
However, sustaining that increase will require successfully overcoming the obstacles Paul Light has identified to substantially improving government’s competence and capacity for addressing the complex problems we face. Pressures created by a war with China could lead to those obstacles being overcome. However, the ability of many sectors of government (outside the military, law enforcement, and intelligence communities) to resist performance improvement even after the 9/11 attacks argues for keeping one’s optimism in check.
But what happens in the absence of a dangerous external threat to the United States?
That depends on the answer to another question: Will the Biden administration be able to successfully address some of the most pressing problems facing the non-elite masses?
Winning the battle against COVID is necessary – but it isn’t likely to be sufficient to reverse the decline in political legitimacy. More will be required.
Restoring economic growth is also necessary – but it is also likely to be insufficient, unless its benefits substantially accrue to the masses rather than the elite.
Unfortunately, this is unlikely to happen, at least in the short term, even if Biden succeeds in forcing companies to “reshore” their supply chains or finds a way to enact some version of the “Green New Deal” to “Build Back Better”. The ugly reality is that, given a stagnant education system (whose performance improvement is largely controlled not at the federal or state level, but rather at the local school district level where elections are dominated by the teachers unions, which are dead set against change), accelerated job losses due to increasing investments in AI and automation are still very likely to happen. And the returns from those investments (even with higher taxes) will largely flow to elites (e.g., “The Pandemic Is Replacing People With Tech — Threatening The Jobs Rebound” in Politico).
In addition, as noted in last month’s issue, the evolving structure of the economy is creating more (but still relatively low wage) jobs in healthcare and other service industries that have traditionally had a relatively large proportion of female workers.
Even if worker productivity and wages could be increased in these growing sectors (a big if, given a stagnant education system), the cultural challenge of attracting more men into these jobs will very likely remain significant. All else being equal, this is a recipe for continued anger among the masses, directed towards the elites.
If all else is not to remain equal, what change in the current status quo could make a substantial impact on perceived political legitimacy and have a good chance of being successfully implemented?
Repeated polls find that addressing the challenges and frustrations most Americans face when dealing with the healthcare system seems the most likely candidate.
This doesn’t necessarily mean a national single payer system, like Medicare for all, which is almost certainly too high a political mountain for the Biden administration to climb. Rather, a public option (e.g., to opt-in to Medicare even if you’re younger than 65) seems more politically achievable (as it wouldn’t require people to give up their private or employer-provided health insurance). If enacted, a public option would very likely lead to a number of benefits, including increased geographic mobility for individuals (which would boost productivity growth), and greater scale that would enable Medicare buyers to put more downward pressure on healthcare suppliers’ prices (which are very high compared to other nations). Based on polling data, this is a change that many citizens would welcome, that would raise the perceived political legitimacy of government.
Not far behind a public health care option would be a Universal National Service program for all young men and women, perhaps linked to government payments for later education or training.
This idea was repeatedly proposed by the late Senator John McCain, who claimed it would force children of the elite and the masses to work together to achieve common goals. This happened in World War Two and the experience of the Greatest Generation paid dividends for nation the next forty years, in social bonds and, politically, the ability work across party lines for the common good. Whether this could happen again is uncertain. But, as McCain often said, it is well worth a try.
But what are the chances either of these proposals would ever be enacted, and well-implemented?
Unfortunately, they are probably less than 50/50. As multiple researchers have found, elite actors have much stronger influence over Congress than the masses (e.g., “Predicting United States Policy Outcomes with Random Forests”, by McGuire and Delahunt). And elites would likely oppose both ideas (e.g., just look at the percentage of elite children who serve in the volunteer military).
There is also another risk to the success of the Biden administration. The chance that intra-party politics will lead the Biden administration to propose to Congress or implement via executive order policy changes that will win praise from the progressive left while antagonizing everyone to their right – not just the 74 million Trump voters, but also many centrist Democrats.
One of the underappreciated facts about US politics is that the largest share of the American electorate is composed of voters who are relatively liberal on economic issues, and relatively conservative on social issues. This segment is not well represented by either major party these days, and because of that is, electorally, up for grabs. To the extent that the Biden administration’s policy proposals aim at this “sweet spot” and are enacted and implemented, it has a good chance of restoring some measure of political legitimacy. But that is a very unlikely outcome if too many of the Biden administration’s policy proposals come from left wing progressives.
What happens if the Biden administration (and the political center with it) fails?
According to the National Opinion Research Center, “today just 16% of Americans say democracy is working well or extremely well, a pessimism that spans the political spectrum. Nearly half of Americans, 45%, think democracy isn’t functioning properly, while another 38% say it’s working only somewhat well” (“AP-NORC Poll: Few In US Say Democracy Is Working Very Well”, by Sloan and Beaumont).
A failure by the Biden administration to significantly improve the lives of the masses, even if doing so makes the elites worse off, will further worsen people’s view of government’s competence and legitimacy and erode the political strength of the center left and center right.
This could lead to at least two possibilities: The election of a populist left or a populist right government.
If elected, a populist left administration might choose move in the direction of techno-authoritarianism, using social control technologies (e.g., as Xi Jinping has greatly expanded in China) to minimize resistance to its progressive economic and especially social programs. Yet given the political unpopularity of many of progressives’ “woke” social proposals, it seems unlikely that a “progressive populist” could win election in the United States, particularly in the middle of an even deeper political legitimacy crisis following a failed Biden administration.
In contrast, it seems far more likely that a right wing populist, perhaps with authoritarian tendencies, could win, again conditional upon avoiding more extreme positions on social issues.
Beyond the fact that 74 million people voted for Donald Trump, nothing made the continuing appeal of right wing populism more shockingly clear than the profiles of people who were arrested for attacking the Capitol on January 6th.
As Pape and Ruby noted in The Atlantic, “a closer look at the people suspected of taking part in the Capitol riot suggests a different and potentially far more dangerous problem: a new kind of violent mass movement in which more ‘normal’ Trump supporters—middle-class and, in many cases, middle-aged people without obvious ties to the far right—joined with extremists in an attempt to overturn a presidential election” (“The Capitol Rioters Aren’t Like Other Extremists”).
In trying to explain this, the Financial Times’ Isabella Kaminska keenly observed that, “to all those who have abandoned trust in the system (no doubt because they no longer believe it works for them), nothing is above suspicion. As a result everything, including the idea the judiciary may be too corrupt or compromised by threatening behaviour behind the scenes, is all within the realm of possibility. It’s happened before in other occupied or corrupt authoritarian systems. So why not in the US? Once we understand this perspective, we can understand why in the minds of the most radical Q supporters January 6 wasn’t an insurrection as much as a last-ditch attempt to restore the democracy they believe was being stolen from them.”
Given popular demands for “government that works” and “politics that finally helps the people instead of the elite” it would not come as a surprise if, in the wake of a failed Biden administration, a winning Republican ticket in 2024 included a former senior military officer. After all, Gallup’s polling has repeatedly found that the military is the institution that is, by far, most respected by Americans today.
To be sure, that still begs the question of the extent to which even a populist Republican administration could increase the competence and capacity of government and restore its popular legitimacy. And even if it did so at the federal level, would this be offset by its inability to improve state and local government, assuming the continuation of government business as usual (e.g., no declaration of an extraordinary national emergency)?
In trying to forecast these questions, there is a precedent in US history that can serve as one reference case. As the agricultural economy gave way to industrialization at the end of the 19th / beginning of the 20th century, economic dislocation and social strife were rampant in the United States. These years saw both a populist (William Jennings Bryan) and a socialist (Eugene Debs) run for president multiple times. Three developments finally arrested the process of increasing domestic conflict and declining political legitimacy, and returned the country to economic prosperity and social peace.
The first was the Progressivism (in the older, not current meaning of that term) of Theodore Roosevelt’s presidency, which implemented many reforms to reduce the negative effects of the economy’s jarring transition. The second was Franklin Roosevelt’s New Deal, which arose from a Depression that painfully revealed where the Progressives’ reforms had been incomplete. And the third, unfortunately, was World War Two.
They say that while history doesn’t repeat, it often rhymes. In that sense, we can only hope that if a Republican administration is elected in 2024, it resembles not the Trump administration, but rather the reforming populism of TR. Indeed, there are signs of the emergence of this type of program, aimed at the needs of the large economically liberal/socially conservative segment of the population.
One example is where Boris Johnson appears to be taking the UK Conservative Party. Another is where people like Oren Cass (see AmericanCompass.org) would like to take the US Republican Party. But that’s an optimistic take. There are other, more destructive paths the Republican Party could take between now and 2024.
Conclusion
In our October 2020 feature article, we forecasted a 25% (+/- 15%) probability that China will attack Taiwan before the 20th CCP Congress, which is scheduled for November. If that doesn’t happen, the crisis of political legitimacy will almost certainly continue.
At this point, we forecast a 40% (+/- 15%) probability that the Biden administration will succeed in significantly reversing it.
If Biden fails and perceived political legitimacy continues its dangerous decline for four more years, we forecast a 30% (+/- 10%) probability that a left wing, progressive populist administration will be elected in 2024, and 70% (+/- 10%) probability that the Biden administration will be replaced by a right wing populist (but likely more competently led) Republican administration.
In sum, here are our forecast scenarios to the 2024 US election, and their respective probabilities:
• War with China (25% probability)
• No War, and Biden administration program succeeds and increases political legitimacy (30% = 75% x 40%)
• No War, Biden fails, and left wing populist elected in 2024 (13.5% = 75% x 60% x 30%)
• No War, Biden Fails, and right wing populist elected in 2024 (31.5% = 75% x 60% x 70%)
High Value Information Observed In January 2021
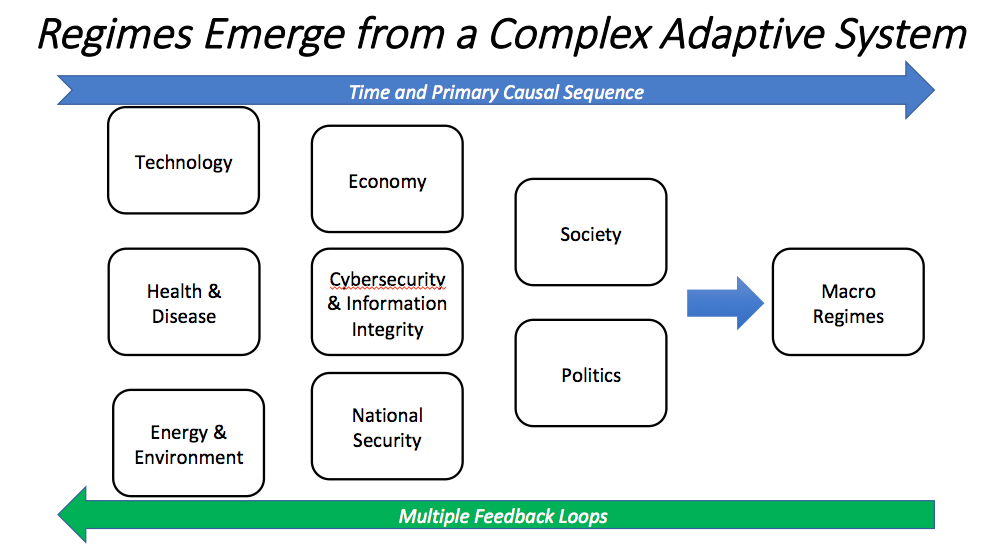
In our model of the complex global macro system, change drivers are arrayed across a roughly chronological process (albeit one with many feedback loops), in which technological, health, and environmental changes precede changes in the economy and national security, which in turn lead to changes in society and politics, all of which produce (albeit with multiple feedback loops) the effects we observe in investor behavior and financial market valuations and returns.
To generate alternative future scenarios and critical forecasting questions, we use this framework to identify multiple paths across these issue areas, including alternative outcomes for critical uncertainties.
In our methodology, we take a Bayesian approach, and classify new information as significant and highly valuable if either it (1) is an “indicator”, which reduces our uncertainty about the value of a parameter in our mental model for making sense of the dynamic macro system, or (2) it is a “surprise” which increases our uncertainty about either the range of potential values for a parameter or the structure of our model.
With respect to indicators, the higher our priori probability is for a regime, the more we look for indicators that it will not occur, and the lower our prior probability for a regime, the more we look for indicators that it will occur. Put differently, try to systematically search for high value indicators that disconfirm our prior views.
| New Technology Information: Indicators and Surprises | Why Is This Information Valuable? |
| “Machine Learning Prediction of Critical Transition and System Collapse”, by Kong et al | Complex dynamical systems, like climate, or an electrical power grid, have multiple cause and effect relationships, many of which operate in a time delayed and non-linear manner. These systems are characterized by “tipping points” (also, “phase transitions” or “critical transitions”) when they either shift from one regime to a very different one, or into a zone characterized by highly unstable or chaotic dynamics. The authors observe that, “to predict a critical transition… without relying on model is an outstanding problem in nonlinear dynamics and applied fields. A closely related problem is to predict whether a system is already in or if the system will be in a transient state preceding its collapse.” They develop a model free, machine learning-based solution to both problems that focuses on the evolution of key parameters to predict critical transitions. While this is an important development, it is not (yet) the same thing as being able to accurately predict critical transitions in complex adaptive systems (e.g., like the economy or financial markets) in which multiple intelligent agents are constantly using feedback about the impact of their behavior (and about other agents’ behaviors) to adapt their strategies to achieve goals that themselves may also be evolving over time. |
| “Making Sense of Sensory Input”, by Evans, et al | SURPRISE Per Judea Pearl, current AI technologies have yet to meet two critical challenges: Causal and Counterfactual reasoning. Various researchers are coming at this fundamental problem from different directions. This paper provides further evidence of progress towards that goal. To be sure, there is still a lot of ground to cover between breakthroughs like this in labs, and their broad application in the economy. But recognizing these breakthroughs is critical to understanding the new AI capabilities that will be deployed in the future. The authors of this paper “attempt to answer a central question in unsupervised learning: what does it mean to “make sense” of a stream of sensory information? In [their] formalization, making sense involves constructing a symbolic causal theory that both explains the sensory sequence and also satisfies a set of unity conditions. The unity conditions insist that the constituents of the causal theory – objects, properties, and laws – must be integrated into a coherent whole” … “We believe there is more to “making sense” than prediction, retrodiction [explanation], and imputation [of missing values in a sequence]. Predicting the future state of [a system] may be part of what is involved in making sense – but it is not on its own sufficient. The ability to predict, retrodict, and impute is a sign, a surface manifestation, that one has made sense of the input. We want to define the underlying mental model that is constructed when one makes sense of the sensory input, and to show how constructing this mental model ipso facto enables one to predict, retrodict, and impute… They “assume that making sense of sensory input involves constructing a symbolic theory that explains the sensory input” … The authors’ second contribution is “a computer implementation, the ‘Apperception Engine’ that is designed to satisfy the above requirements. Our system is able to produce interpretable human-readable causal theories from very small amounts of data… A causal theory produced by our system is able to predict future sensor readings, as well as retrodict [explain] earlier readings, and impute (fill in the blanks of) missing sensory readings, in any combination. In fact, it is able to do all three tasks simultaneously.” |
| “Understanding in Artificial Intelligence”, by Maetschke et al from IBM Research | Similar to the paper above, this one surveys the extent to which AI’s substantially improved predictive capabilities have been accompanied by increase in understanding (“to know why or how something happens or works”). Like others, the authors find that the answer is “much less.” They also review the strengths and shortcomings of methods using machine learning and symbolic reasoning, and discuss more promising approaches to true understanding. |
| “Who is Winning the AI Race?” by Castro and McLaughlin, and “The Innovation Wars”, by Darby and Sewall | Our approach to macro forecasting acknowledges the immense challenges involved in predicting the effects produced by complex adaptive systems, which grow exponentially more difficult as the time horizon lengthens. However, we also stress that gaining a “coarse grained understanding” of the dynamics of such systems, along with the use of disciplined forecasting methods, can lead to predictions that are more accurate than chance. With respect to global macro (which is a system of underlying and interacting CAS like technology, national security, the economy, society, politics, etc.) a key aspect of this “coarse grained understanding” is recognition of a rough time sequence driving cause and effect (albeit with many feedback loops). This sequence begins with technology. Indeed, as Brian Arthur noted in his book “The Nature of Technology”, the economy is an expression of its technologies. Hence, it is critically important that we stay aware of developments in the areas of technology that are likely to have the largest effects as they develop and diffuse. The first of these papers analyzes the current state of competition in AI. It finds that while the US is ahead (based on the metrics the authors use), China is catching up quickly, while Europe is falling further behind. The second paper takes a broader look at shortcomings in the US approach to technology innovation. While they have been present for years, their negative effects have become much more visible as China has employed a very different approach (“civil-military fusion”) to make dramatic progress across multiple technologies. While the authors offer ideas for fixing the problems they identify in the US approach, many of these have been offered before, but have not been able to overcome the many political obstacles that have blocked their adoption in the past. Whether intensifying conflict with China will lead to a different outcome this time remains to be seen. |
| “How Could Future AI Help Tackle Global Complex Problems?” by Anne-Marie Grisogono | SUPRRISE Anne-Marie Grisogono spent most of her career at Australia’s Defence Science and Technology Organization. Over the years, I have consistently found her publicly available research on the application of complex adaptive systems theory to practical problems to be among the best I’ve read. A few years ago she left for academia, and recently published this outstanding paper. In a world of increasing complexity (which Joseph Tainter’s research has hypothesized is a cause of civilization collapse), Grisogono focuses on the “wicked problems” created by rising complexity, and why only 10% of humans are good at solving them. She then very practically lays out what AI will need to do in the future in order to augment human beings’ ability to manage wicked problems, and ethical challenges such powerful AI will create. For all these reasons, it’s a great read. |
| | |
| | |
| | |
| | |
| | |
| | |
| | |
| | |
| New Energy and Environment Information: Indicators and Surprises | Why Is This Information Valuable? |
| “Germany's Energiewende, 20 Years Later”, by Vaclav Smil and, “A Tale of Two Markets: How the US Electric Power Sector is Diverging”, by Clune et al from McKinsey | In 2000, Germany launched its “Energiewende”, a targeted program to reduce CO2 emissions by subsidizing renewable energy. Smil notes that, “the initiative has been expensive, and it has made a major difference. In 2000, 6.6% of Germany’s electricity came from renewable sources; in 2019, the share reached 41.1 percent. In 2000, Germany had an installed capacity of 121 gigawatts and it generated 577 terawatthours, which is 54 percent as much as it theoretically could have done (that is, 54 percent was its capacity factor). “In 2019, the country produced just 5 percent more (607 TwH), but its installed generating capacity was 80 percent higher (218.1 GW) because it now had two generating systems. “The new system, using intermittent power from wind and solar, accounted for 110 GW, nearly 50 percent of all installed capacity in 2019, but operated with a capacity factor of just 20 percent. (That included a mere 10 percent for solar, which is hardly surprising, given that large parts of the country are as cloudy as Seattle.) “The old system stood alongside it, almost intact, retaining nearly 85 percent of net generating capacity in 2019. Germany needs to keep the old system in order to meet demand on cloudy and calm days and to produce nearly half of total demand. In consequence, the capacity factor of this sector is also low. “It costs Germany a great deal to maintain such an excess of installed power. The average cost of electricity for German households has doubled since 2000. By 2019, households had to pay 34 U.S. cents per kilowatt-hour, compared to 22 cents per kilowatt-hour in France [which heavily relies on nuclear generation] and 13 cents in the United States.” These results from Germany are a critical reference case, in light of McKinsey’s report on the growing split between US electricity markets that are driven by a goal of minimizing electricity costs and those that are driven by minimizing carbon emissions. As the German experience shows, this is likely to lead to widening divergences in generating capacity, utilization, and electricity costs (and thus economic competitiveness and social conditions) across different regions of the United States. In turn, this could also increase political conflicts between regions, especially if the federal government attempts to effectively raise electricity prices in the middle of the country to match prices on the coasts by imposing national renewable generation mandates. |
| “Three Prongs for Prudent Climate Policy”, by Aldy and Zeckhauser | SURPRISE “For three decades, advocates for climate change policy have simultaneously emphasized the urgency of taking ambitious actions to mitigate greenhouse gas (GHG) emissions and provided false reassurances of the feasibility of doing so. The policy prescription has relied almost exclusively on a single approach: reduce emissions of carbon dioxide (CO2) and other GHGs. “Since 1990, global CO2 emissions have increased 60 percent, atmospheric CO2 concentrations have raced past 400 parts per million, and temperatures increased at an accelerating rate. The one-prong strategy has not worked. “After reviewing emission mitigation’s poor performance and low-probability of delivering on long-term climate goals, we evaluate a three-pronged strategy for mitigating climate change risks: adding adaptation and amelioration – through solar radiation management (SRM) – to the emission mitigation approach… “SRM is a geoengineering instrument, as an amelioration measure. The most promising SRM measure would inject aerosols into the upper atmosphere to reflect back incoming solar energy. This would lower the temperature for a given accumulation of atmospheric GHGs… “We identify SRM’s potential, at dramatically lower cost than emission mitigation, to play a key role in offsetting warming. We address the moral hazard reservation held by environmental advocates – that SRM would diminish emission mitigation incentives – and posit that SRM deployment might even serve as an “awful action alert” that galvanizes more ambitious emission mitigation. We conclude by assessing the value of an iterative act-learn-act policy framework that engages all three prongs for limiting climate change damages.” |
| “Investors Start To Pay Attention to Water Risk” in the Economist | SURPRISE “At current rates of consumption, the demand for water worldwide will be 40% greater than its supply by 2030, according to the un. Portfolio managers are realising that physical, reputational and regulatory water risk could hurt their investments, particularly in thirsty industries such as food, mining, textiles and utilities… “Disclosures of water risk are even patchier than those of greenhouse-gas emissions. In part, that is because it is more difficult to measure. |
| “Underestimating the Challenges of Avoiding a Ghastly Future”, by Bradshaw et al | SURPRISE Writing about the attack on Pearl Harbor, Thomas Schelling famously observed that, “there is a tendency in our planning to confuse the unfamiliar with the improbable. The contingency we have not considered looks strange; what looks strange is therefore improbable; what seems improbable need not be considered seriously.” That is a warning we forget at out peril. Yet many people do just that. It is for this reason that papers like this one are critical. In complex adaptive systems the global climate, there is (as noted in previous issues of The Index Investor) a great deal of remaining uncertainty about the tail risks associated with climate change. The authors of this paper “review the evidence that future conditions will be far more dangerous than currently believed”, focusing especially on the potential and poorly understood consequences of the accelerating loss of biodiversity. In light of Grisogono’s paper noted above, it is also interesting that Bradshaw et al highlight the “time delays between ecological deterioration and socio-economic penalties [that] impede recognition of the magnitude of the challenge and timely counteraction needed.” As a key cause of this, they cite, “disciplinary specialization and insularity [that] encourages unfamiliarity with the complex adaptive systems in which these problems and their potential solutions are embedded.” |
| | |
| | |
| | |
| | |
| | |
| | |
| | |
| | |
| | |
| New Economic Information: Indicators and Surprises | Why Is This Information Valuable? |
| Former Treasury Secretary Larry Summers raised objections to the size of the Biden administration’s proposed $1.9 trillion stimulus package. The core of his argument is that it is too large because of the anticipated rate at which the economy is expected to recover. As such, and in light of the reduction in supply capacity in some sectors of the economy due COVID-induced business closures, a stimulus of this size could increase inflation. This was what you saw in the headlines. Less mentioned, however, was the risk that increased inflation would almost certainly lead to higher interest rates, which could trigger the rapid deflation of the current bubbles in the debt and equity markets. And practically absent from the headlines was this equally critical warning from Summers: “If the stimulus proposal is enacted, Congress will have committed 13 percent of GDP [Trump’s $900 billion plus the proposed $1.9 trillion] with essentially no increase in public investment to face the fundamental problems of economic justice, slow, growth and inadequate investment in everything from infrastructure to preschool education to renewable energy [that are] at the heart of Biden’s emphasis on building back better…After resolving the coronavirus crisis, how will political and economic space be found for the public investments shat should be the nation’s highest priority?” | By far the best analyses we have seen are “Supply And Demand Shocks In The COVID-19 Pandemic: An Industry And Occupation Perspective, by del Rio-Chaona et al; “Firms, Failures, and Fluctuations: The Macroeconomics of Supply Chain Disruptions”, by Acemoglu and Tahbaz-Salehi; and “In And Out Of Lockdown: Propagation Of Supply And Demand Shocks In A Dynamic Input-Output Model”, by Pichler et al. Using a sophisticated dynamic sectoral model of supply and demand shocks that incorporates pandemic induced changes in consumer preferences, the latter paper finds that, “the shocks to on-site consumption industries are more long lasting, and savings from the lack of consumption of specific goods and services during lockdown are only partially reallocated to other expenses.” Indeed, there is evidence that the inflationary effects of supply capacity cuts are already beginning to appear (e.g., see “Supply Chain Costs Are Mounting In All Sorts Of Ways”, by Claire Jones in the Financial Times). The bottom line is that Summer’s concerns about inflation and its potential to pop our current credit and equity bubbles (again with unpredictable cascading consequences) are well founded, all else being equal (which it may very well not be – see the next evidence note). Equally important is Summers concern with the balance in the proposed $1.9 billion stimulus between transfer payments to maintain consumption versus investment spending to raise future growth. Borrowing to sustain consumption rather than to increase production to repay the debt is a recipe for eventual insolvency. At the very least, the current structure of the Biden plan will, to some extent, raise the probability of a future US sovereign debt crisis, which should lead rational investors to demand higher compensation to bear this risk – which in turn increases the likelihood that the debt and equity bubbles will burst, which will substantially depress economic demand (and thus worsen the insolvency crisis, what could become a vicious cycle). |
| Summers’ objections to Biden’s proposed stimulus plan are based on a critical unspoken assumption – that economic conditions won’t worsen. That brings to mind the time British Prime Minister Harold Macmillan was once reportedly asked what had been the greatest influence on his administration. “Events, dear boy, events”, he supposedly replied. One way to think of this is as the compound probability that a series of potential events with substantial negative consequences won’t occur over the next three years. I’ve listed seven of them in the next column. Let’s very optimistically estimate that there is a 95% probability that each of these seven potential crises will NOT occur over the next 12 months. Let’s also optimistically assume they are independent (which some of them probably aren’t). Mathematically, this means that there is a 70% joint probability (95% to the 7th power) that none of them will occur over the next year. Looked at differently, it means that there is a 30% probability that one will. But what happens when we extend the time frame to three years. If there is a 70% probability that none of these crises will occur in the first year, there is only a 34% chance that none of them will occur over the next three years (70% to the third power)– and therefore a 66% chance that at least one will. As Macmillan said, “events, dear boy, events.” If one or more of these potential crises occurs, the direct negative shock to demand (and quite possibly supply too) and the indirect (and likely longer lasting) negative shock to uncertainty will very likely be substantial. In this scenario, the extra stimulus provided by Biden’s $1.9 trillion stimulus may very well be critical to preventing an even worse economic collapse. So from this perspective, Biden’s approach appears to be a prudent response to multiple downside risks. Those are all big “ifs”. But that’s the world we’re living in today, much as many people don’t want to admit it and confront its implications. | Consider these possible “events” that the Biden administration could confront: • An increase in inflation, and the popping credit and equity market bubbles rising rates would very likely trigger; • A US sovereign debt and/or dollar crisis (though the latter would also require a more attractive new currency home for investors fleeing the dollar, which at this point seems unlikely); • An LDC debt crisis, due to heavy corporate borrowing in foreign currency; • A Eurozone sovereign debt crisis, most likely triggered by Italy; • A severe private sector solvency crisis, as the government support that enabled many companies to survive during the pandemic is withdrawn but the economy remains weak; • SARS-CoV-2 mutations that significantly reduce vaccine efficacy, forcing another return to lockdowns (as we have recently seen in the UK and EU); • A violent conflict between the US and China (most likely over Taiwan), or between the US and/or Israel and Iran (e.g., see the recent column by the FT’s John Dizard, who recently observed that, “War risk is consistently underestimated by money people… Wall Street, the City of London and their counterparts appear to believe that once vaccines are distributed to most of the developed world’s population, the problem ends. The 1990s assumptions of peace and free financial flows will work once again.” As Dizard notes, “The market volatility caused by sudden conflict in an over leveraged world would lead to the mother of all un-meet-able margin calls.” |
| In “Tapping into Talent: Coupling Education and Innovation Policies for Economic Growth”, Akcigit et al show the critical relationship between improving education and the wider diffusion of advanced technologies. See also: “Costs of Lost Schooling Could Amount to Hundreds of Billions in the Long Run” by the UK Institute for Fiscal Studies; “Pandemic Boosts Automation and Robotics”, “Dani Rodrik: ‘We Are In A Chronic State Of Shortage of Good Jobs’”, and “Why I Was Wrong to Be Optimistic About Robots”, all in the Financial Times; “How Robots Will Break Politics” and “The Pandemic is Replacing People with Tech – Threatening the Jobs Rebound”, both in Politico. All of these are further evidence of the hypothesis advanced by Acemoglu and Restrepo in 2019, in their paper, “The Wrong Kind of AI: Artificial Intelligence and the Future of Labor Demand”, that for a range of reasons (e.g., the tax code; human capital quality; potential returns), companies are investing in more labor substituting rather than labor augmenting technology to a degree that is neither economically nor socially optimal. | SURPRISE Looking beyond the short-term, we see two very disturbing developments. First, as the pandemic has continued, students’ learning losses have continued to accumulate. Unless they are recovered (which seems unlikely, given the interest group rigidities in many K12 education systems, especially in the US) they will have a long-term negative impact on labor productivity growth. Second, there is accumulating evidence that due to multiple factors (including uncertainty about labor force quality, the differential taxation of labor and capital, profit pressures, health concerns, etc.), employers are increasing their investment in labor substituting automation technologies (e.g., robotics and artificial intelligence). If not slowed or altered (e.g., to encourage more investment in labor augmenting AI), this will have grim consequences, including worsening inequality, more pressure on governments’ social safety net budgets, increasing social problems, and, almost certainly, increasingly polarized, conflict-ridden, and populist politics. Two new research papers reported findings along these lines. In “Artificial Intelligence, Globalization, and Strategies for Economic Development”, Korinek and Stiglitz conclude that, “Progress in artificial intelligence and related forms of automation technologies threatens to reverse the gains that developing countries and emerging markets have experienced from integrating into the world economy over the past half century, aggravating poverty and inequality.” In “Pandemics and Automation: Will the Lost Jobs Come Back?” Sedik and Yoo from the IMF observe that, “COVID-19 has exacerbated concerns about the rise of the robots and other automation technologies… raising concerns about a jobless recovery.” They note that these concerns are well founded: “A recent survey of business leaders and human resource strategists of large companies from around the world shows that over 80 percent are accelerating the digitalization of their work processes and expanding their use of remote work, and 50 percent indicate that they will accelerate the automation of jobs in their companies.” Sedik and Yoo conclude that, “the distributional effects of COVID-19 could be sizeable through an acceleration of robotization: "Looking forward, a corollary of our results is that as automation and robotization are accelerating from still low levels, they are expected to become even more important drivers of inequality in the future.” |
| “A Growth Model of the Data Economy”, by Faboodi and Veldkamp | SURPRISE In this thought-provoking new paper, the authors note that, “The rise of information technology and big data analytics has given rise to ‘the new economy.’ But are its economics new? This article constructs a growth model where firms accumulate data, instead of capital. "We incorporate three key features of data: 1) Data is a by-product of economic activity; 2) data is information used for prediction, and 3) uncertainty reduction enhances firm profitability.” While the authors find that the dynamics of this economy differ from those in the traditional, in the long run there are diminishing returns from accumulating data, just as there are from accumulating capital. Intuitively, this makes sense. A company’s first applications of data to improve prediction will be those that generate the highest returns; returns from the 100th application will likely be lower. A limitation of the paper is that it glosses over the new economy skill shortages that other authors address. These have limited the diffusion of advanced AI technologies across companies, and thus contributed to the “superstar firm” and “winner-take-all” effects that have led to worsening inequality. The paper also doesn’t mention other negative aspects of the new digital economy that are covered at length by Shoshana Zuboff in her book, “The Age of Surveillance Capitalism.” |
| | |
| | |
| | |
| | |
| | |
| | |
| | |
| | |
| | |
| | |
| | |
| | |
| | |
| | |
| | |
| New National Security Information: Indicators and Surprises | Why Is This Information Valuable? |
| “The Globalization Of Refugee Flows”, by Devictor et al | “This paper analyzes the spatial distribution of refugees over 1987-2017 and establishes several stylized facts about refugees today compared with past decades. Refugees still predominantly reside in developing countries neighboring their country of origin. However, compared to past decades, refugees today (i) travel longer distances, (ii) are less likely to seek protection in a neighboring country, (iii) are less geographically concentrated, and (iv) are more likely to reside in a high-income OECD country.” |
| US Department of Defense, FY2020 Industrial Capabilities Report to Congress | SURPRISE This new report paints a stunning picture of how much the use industrial manufacturing base has declined, and the dangers its weakness now poses to national security. “America’s defense industrial base was once the wonder of the free world, constituting a so-called ‘military-industrial complex’ that, regardless of criticism, was the model for, and envy of, ever other country – and the mainstay of peace and freedom for two generations after World War II. “Today, however, that base faces problems that necessitate continued and accelerated national focus over the coming decade, and that cannot be solved by assuming that advanced technologies like autonomous systems and artificial intelligence (AI) and 5G and quantum will wave those challenges away, and magically preserve American leadership. “On the contrary, those advanced technologies themselves rely on a manufacturing complex whose capability and capacity will have to be trusted and secure to protect the Pentagon’s most vital supply chains. These include microelectronics, space, cyber, nuclear, and hypersonics, as well as the more conventional technologies that make up our legacy defense equipment. “Unless the industrial and manufacturing base that develops and builds those goods modernizes and adjusts to the world’s new geopolitical and economic realities, America will face a growing and likely permanent national security deficit.” |
| “Robustness of The International Oil Trade Network Under Targeted Attacks to Economies”, by Wei, Xie, and Zhou from the East China University of Science and Technology, in Shanghai PRC | SURPRISE The authors conclude that the international oil trading network has grown much more fragile since 2003, and is more easily disrupted by targeted attacks. |
| “Navigating the Deepening Russia-China Partnership” by Andrea Kendall-Taylor and David Shullman from the Center for a New American Security | “The most concerning — and least understood — aspect of the Russia-China partnership is the synergy their actions will generate. Analysts understand well the challenges that Russia and China each pose to the United States. But little thought has been given to how their actions will combine, amplifying the impact of both actors. As this report highlights, the impact of Russia- China alignment is likely to be far greater than the sum of its parts, putting U.S. interests at risk globally… “Their cooperation accelerates their efforts to erode U.S. military advantages — a dynamic that is especially problematic for U.S. strategic competition with China in the Indo-Pacific.” |
| “Reskilling China”, by the McKinsey Global Institute | SURPRISE “Three decades of Chinese educational reform have created a workforce oriented toward an industrial economy. “Now the challenge is to transform China’s talent-development model to develop the skills needed in an innovative, digitized, postindustrial economy... “Up to one-third of global occupational and skills transitions may occur in China. By 2030, up to 220 million Chinese workers, or 30 percent of the workforce, may need to transition between occupations due to automation.” This represents an enormous challenge for China, considering the failure of many, if not most, largescale reskilling programs thus far attempted by developed Western countries. It is very likely that China will also struggle to meet it, which is almost certain to increase domestic conflict and dissatisfaction with Xi Jinping and other government leaders. |
| “The World Turned Upside Down: America, China, and the Struggle for Global Leadership” by Clyde Prestowitz | Prestowitz has worked in or advised Republican administrations since Ronald Reagan’s presidency. This book overall is worth a read; however, it also contains what may go down in history as the pithiest summary of how “constructive engagement” with gave way to the new Cold War we’re facing today: “American businesses are often thinking of what is best for their business [in China] in circumstances under which Beijing has them by the balls while they, by dint of their legally unlimited political donations to US politicians, have Washington by the balls.” |
| China passed a new law authorizing its Coast Guard to use force against ships operating in its claimed territorial waters. | SUPRRISE This increases the chances of an armed confrontation in the East or South China Sea. As Ryan Martinson notes in “Gauging the Real Risks of China’s New Coast Guard Law”, “Many have focused on the law’s use-of-force provisions. In the past, the China Coast Guard has employed a wide range of coercive tactics to achieve Beijing’s strategic and operational objectives… However, to date it has avoided using armed force against foreigners… “The new law signals that that could change. Article 47 authorises armed China Coast Guard personnel to forcibly board noncompliant foreign vessels ‘illegally’ engaged in economic activities in Chinese-claimed waters. Article 48 allows the use of shipborne weapons (that is, deck guns) incases where coastguard forces face attack by weapons and ‘other dangerous methods’ — which could mean anything. “Even more ambiguous, Article 22 allows the coastguard to employ ‘all means necessary including the use of force’ to stop foreigners found infringing Chinese ‘sovereignty, sovereign rights and jurisdictional rights.’ “While disturbing, the use-of-force provisions are not the most worrisome elements in the new law. Rather, it is the ambiguous geographic scope of the law’s application: China’s ‘jurisdictional waters’. The draft law only vaguely defined the term (Article 74). In the final version, passed on 22 January, that content was removed, leaving no definition at all. “However, a close reading of authoritative Chinese sources reveals that Beijing claims jurisdiction over 3 million square kilometres of maritime space, often called China’s ‘blue national territory’. “This comprises the Bohai Gulf; a large section of the Yellow Sea; the East China Sea as fareast as the Okinawa Trough, including waters around the disputed Senkaku/Diaoyu Islands; and all the waters within the ‘nine-dash line’ in the South China Sea. By Beijing’s own reckoning, over half of this space is contested by other countries.” |
| Biden publicly warned China it will face “extreme competition from the United States”, and China warned Biden “not to meddle” in Hong Kong and Xinjiang. Chinese warplanes ran a live simulated attack against the USS Theodore Roosevelt Carrier Task Group while it was operating near Taiwan. | Early signs indicate that the US-China conflict will continue to intensify under the Biden Administration. |
| The return of Alex Navalny to Russia after treatment in Germany for his attempted murder via novichok nerve agent poisoning, was followed by a show trial and his sentence to a jail term. | SURPRISE In “Alexei Navalny is a real threat to Vladimir Putin”, the Financial Times’ Gideon Rachman noted that, “the fragility of the Russian regime is becoming clear… Through his bravery, determination and investigative flair, Mr. Navalny has galvanised the Russian opposition. He has survived an attempt to kill him and returned to Russia to face arrest, imprisonment and, possibly, death. His example inspired mass protests across the country over the weekend. “Whether Mr. Navalny ultimately succeeds or fails, he now represents the most dangerous threat that Mr. Putin has faced in the two decades since he took power.” Comparing the recent demonstrations against the Kremlin to those he has seen in the past, Rachman observes that, “this time feels different. The current protests have taken place in more than 100 cities across Russia — from Vladivostok on the Pacific coast to Irkutsk in Siberia and Kazan in Tatarstan. “Experienced observers say that the level of violence used against protesters is increasing: the police have swung their batons with more abandon, and some demonstrators have fought back. In 2012, the opposition did not have a clear leader. Now it does.” Writing in the FT (“Vladimir Putin’s Russia Is Destabilising Itself From Within”), Tatiana Stanovaya observes that, “The Navalny imbroglio is a microcosm of the problems that have enveloped the Kremlin in recent years. Since the 2014 annexation of Crimea and breakdown in relations with the west, Putin has been consumed by geopolitics while fobbing off governing to a group of faceless technocrats. “Putin’s original success was rooted in his regime’s ability to deliver steady improvements in living standards while inspiring Russians with exploits on the world stage. Now the regime is ruling largely by scaring people and fostering the impression that Mother Russia is once again a besieged fortress”… “The drama surrounding Navalny’s poisoning was the fuse, but the fire it lit is being fed by the public’s fatigue and frustration with the Putin regime and its inability to change. By refusing any dialogue with its opponents and the public, the regime all but guarantees that social tensions will morph into political protest. Either the regime must find the wisdom to be more flexible, or it will become an unambiguously repressive state. The latest events set Russia firmly on track to the latter destination.” |
| Tensions continued build along a number of European Union fault lines. While initially a leader in the fight against COVID, the EU has fallen badly behind with vaccination, with fingers pointed at both national governments and EU bureaucrats in Brussels. Perhaps more galling is the fact that the post-Brexit UK vaccination program has emerged as a world leader. There is increasing frustration with slow disbursements by the European Recovery (i.e. fiscal stimulus) Fund, with French Finance Minister Bruno Le Maire that latest to complain. In contrast, former German Finance Minister Wolfgang Schauble (and president of the Bundestag) complained about the slow implementation of structural reforms in many nations that were a condition of receiving European Recovery Fund fiscal support. In Italy, Prime Minister Giuseppe Conte resigned as recriminations increased over the government’s actions to address the pandemic and its economic consequences, including plans for economic reforms and how to spend money received from the European Recovery Fund. Conte was replaced by Mario Draghi, former head of the European Central Bank. Finally, the EU signed a trade treaty with China that has come under rising criticism (e.g., see the Financial Times story, “The EU’s Quixotic Plan To Shame China Over Labour Rights: The idea that tougher demands by themselves will force substantive about turn from Beijing is fanciful”). | An economically and politically weakening EU is less able to effectively resist Russia’s potential actions in the Baltics and Eastern Europe. This is particularly dangerous as such actions will become more likely as domestic conditions deteriorate in Russian, and threaten Putin’s continued rule. A weakening EU also raises the probability of an Italian sovereign debt crisis, which would be far worse than the one that occurred in Greece. If it happens, and Italian crisis will almost certainly threaten both the stability of many EU banks (which have bought Italian bonds), and the future of the Euro (which prevents Italy from devaluing its currency to stimulate exports). In the worst case, Italy could pursue its own version of Brexit. |
| | |
| | |
| | |
| | |
| New Health and Disease Information: Indicators and Surprises | Why Is This Information Valuable? |
| “Bidirectional Associations Between COVID-19 And Psychiatric Disorder: Retrospective Cohort Studies Of 62,354 COVID-19 Cases In The USA”, by Taquet et al | SURPRISE “Adverse mental health consequences of COVID-19, including anxiety and depression, have been widely predicted but not yet accurately measured.” The authors find that, “The incidence of any clinical psychiatric diagnosis in the 14 to 90 days after COVID-19 diagnosis was 18⋅1% (95% Confidence interval 17⋅6–18⋅6), including 5⋅8% (5⋅2–6⋅4) that were a first diagnosis.” |
| “Mental Health, Substance Use, and Suicidal Ideation During the COVID-19 Pandemic — United States, June 24–30, 2020”, by Czeisler et al from the US CD | This study describes the self-reported results of a panel study conducted among 5,412 adults. Unlike the study noted above, these results are not based on clinical diagnoses. “Overall, 40.9% of respondents reported at least one adverse mental or behavioral health condition, including symptoms of anxiety disorder or depressive disorder (30.9%), symptoms of a trauma- and stressor-related disorder (TSRD) related to the pandemic† (26.3%), and having started or increased substance use to cope with stress or emotions related to COVID-19 (13.3%). “The percentage of respondents who reported having seriously considered suicide in the 30 days before completing the survey (10.7%) was significantly higher among respondents aged 18–24 years (25.5%), minority racial/ethnic groups (Hispanic respondents [18.6%], non-Hispanic black [black] respondents [15.1%]), self-reported unpaid caregivers for adults (30.7%), and essential workers (21.7%).” |
| As we predicted in our September 2020 feature article (“An Assessment of Covid-19 Vaccine Uncertainties and Probabilities”), the roll out of vaccines production and distribution across countries has been uneven, but was gradually improving last month. | The key uncertainty at this point is whether and when the continuing evolution of the SARS-CoV-2 virus (i.e., the emergence of more infectious new variants, such as those seen in the UK, South Africa, and Brazil) will sufficiently reduce the efficacy of immunity conferred by either previous infection or vaccination. In the absence of the development and distribution of new vaccines, this would cause the number of COVID cases to rise once again (in the absence of renewed masking, social distancing, fast testing and contact tracing, lockdowns, and other virus suppression interventions). The good news is that reduction in the number of COVID cases due to vaccination and previous infection could slow the mutation process, which occurs in infected individuals. However, this will not be the case until a substantial percentage of the world’s population is vaccinated (with the exception of places like Taiwan, New Zealand and Australia, which can more easily close themselves off to international travel). Time to herd immunity will also be further slowed by people refusing to take the vaccines, as well as vaccines’ less than 100% efficacy at preventing infection. In light of these various pieces of new evidence, it seems likely (60% probability, +/- 10%) that we will continue to see the emergence of new “COVID waves” over the next 12 months. |
| “Super-Spreaders Out, Super-Spreading In: The Effects of Infectiousness Heterogeneity and Lockdowns on Herd Immunity”, by Tavori and Levy | SURPRISE The authors note that most epidemiological models do not include differential infection via “superspreader” events. They argue that because of this, the actual threshold for effective herd immunity is much lower than the level estimated using traditional methods (often cited as 67% of the population previously infected or vaccinated). On the other hand, the reduction in the number of potential superspreader events may be offset by the arrival of new SARS-CoV-2 variants that are much more transmissible. |
| While still uncertain, new research findings indicate that the B.1.1.7 variant of SARS-CoV-2 increase not only the transmissibility of the virus, but also the fatality rate for those infected. | SURPRISE The following is from the 21Jan21) UK government brief (“NERVTAG Presented to SAGE” by Horby et al): “1. The variant of concern (VOC) B.1.1.7 appears to have substantially increased transmissibility compared to other variants and has grown quickly to become the dominant variant in much of the UK. 2. Initial assessment by PHE of disease severity through a matched case-control study reported no significant difference in the risk of hospitalisation or death in people infected with confirmed B.1.1.7 infection versus infection with other variants. 3. Several new analyses are however consistent in reporting increased disease severity in people infected with VOC B.1.1.7 compared to people infected with non-VOC virus variants. 4. There have been several independent analyses of SGTF and non-SGTF cases identified through Pillar 2 testing linked to the PHE COVID-19 deaths line list: a. LSHTM: reported that the relative hazard of death within 28 days of test for VOC-infected individuals compared to non-VOC was 1.35 (95%CI 1.08-1.68). b. Imperial College London: mean ratio of CFR for VOC-infected individuals compared to non-VOC was 1.36 (95%CI 1.18-1.56) by a case-control weighting method, 1.29 (95%CI 1.07-1.54) by a standardised CFR method. c. University of Exeter: mortality hazard ratio for VOC-infected individuals compared to non-VOC was 1.91 (1.35 - 2.71). d. These analyses were all adjusted in various ways for age, location, time and other variables. 5. An updated PHE matched cohort analysis has reported a death risk ratio for VOC- infected individuals compared to non-VOC of 1.65 (95%CI 1.21-2.25). 6. There are several limitations to these datasets including representativeness of death data (<10% of all deaths are included in some datasets), power, potential biases in case ascertainment and transmission setting. 7. Based on these analyses, there is a realistic possibility that infection with VOC B.1.1.7 is associated with an increased risk of death compared to infection with non-VOC viruses. 8. It should be noted that the absolute risk of death per infection remains low.” |
| “SARS-Cov-2 RBD In Vitro Evolution Follows Contagious Mutation Spread, Yet Generates An Able Infection Inhibitor”, by Zahradnik et al from the Weizmann Institute of Science | SURPRISE This very important research paper reports the results of experiments that attempt to predict the future emergence of even more infectious variants of SARS-CoV-2. The authors first show how their approach predicts the emergence of two amino acid mutations on the virus’s protein spike that increase its ability to bond to human tissue (which increases transmissibility). These are known as N501Y and E484K, which are present in the new UK, South African, and Brazilian variants. Their key conclusion is that the emergence of another amino acid mutation, Q498R, on the spike protein could potentially increase transmissibility by a factor of 50x. The good news is that this research also gives vaccine developers a jump on developing new formulations that will be effective against this mutation in the SARS-CoV-2 virus. |
| “COVID-19 Rarely Spreads Through Surfaces. So Why Are We Still Deep Cleaning?” by Dyani Lewis in Nature | “As evidence has accumulated over the course of the pandemic, scientific understanding about the virus has changed. Studies and investigations of outbreaks all point to the majority of transmissions occurring as a result of infected people spewing out large droplets and small particles called aerosols when they cough, talk or breathe. These can be directly inhaled by people close by. “Surface transmission, although possible, is not thought to be a significant risk… In fact, the US Centers for Disease Control and Prevention (CDC) clarified its guidance about surface transmission in May, stating that this route is “not thought to be the main way the virus spreads”. It now states that transmission through surfaces is “not thought to be a common way that COVID-19 spreads”… “But it’s easier to clean surfaces than improve ventilation — especially in the winter — and consumers have come to expect disinfection protocols. That means that governments, companies and individuals continue to invest vast amounts of time and money in deep-cleaning efforts. By the end of 2020, global sales of surface disinfectant totaled US$4.5 billion, a jump of more than 30% over the previous year.” |
| After nearly a year’s delay, China finally let a WHO team into the country to investigate the origins of SARS-CoV-2. The results were controversial. | On 9 Feb, the WHO said the virus lab leak theory was “extremely unlikely”, claiming the most plausible explanation was that the virus jumped from bats to an “as yet unknown” intermediate host before infecting humans. However, the very next day evidence emerged that Peter Daszak, one of the WHO researchers had worked with the Wuhan lab for 18 years, and had received grant funding from Chinese organizations. Two days later, the Financial Times reported that the “US Raised ‘Deep Concerns’ Over WHO Report On Covid’s Wuhan Origins… ‘We have deep concerns about the way in which the early findings of the Covid-19 investigation were communicated and questions about the process,’ said Jake Sullivan, national security adviser… ‘It is imperative that this report be independent, with expert findings free from intervention or alteration by the Chinese government,’ Sullivan said.” |
| | |
| | |
| | |
| New Social Information: Indicators and Surprises | Why Is This Information Valuable? |
| “People Globally Offer Mixed Views Of The Impact Of Artificial Intelligence, Job Automation On Society”, by Pew Research | SURPRISE It is interesting to contrast public perceptions of the impact of automation and AI with other sources of data on these technology’s diffusion and deployment and assessments of the risks they pose to future employment and job creation. My key takeaway is that this polling data is further evidence that human beings struggle to think clearly about the implications of exponential rates of change. In the 20 countries around the world where people were polled, “a median of about half (53%) say the development of artificial intelligence, or the use of computer systems designed to imitate human behaviors, has been a good thing for society, while 33% say it has been a bad thing. [In the US, the split was 47/44]. “Opinions are also divided on another major technological development: using robots to automate many jobs humans have done in the past. A median of 48% say job automation has been a good thing, while 42% say it’s had a negative impact on society. [In the US, the split was 41/50]. |
| “Factors Associated With Psychological Distress During The Coronavirus Disease 2019 (COVID- 19) Pandemic on the Predominantly General Population: A Systematic Review and Metaanalysis” by Wang et al “Pandemic Burnout On Rise As Latest Covid Lockdowns Take Toll”, by Sarah Marsh in The Guardian | SURPRISE Based on surveys of 288,830 people in 19 countries, Wang et al find “the prevalence of anxiety and depression was, respectively, 33% (95% CI: 28%-39%) and 30% (26%-36%).” Women, younger adults, and people with lower socioeconomic status were more likely to suffer from these conditions. So too were people who had had COVID and who had longer media exposure. These data line up with the Guardian’s finding that, in the UK, “psychologists are reporting a rise in ‘pandemic burnout’ as many people find the current phase of lockdowns harder, with an increasing number feeling worn out and unable to cope… “Many are finding the latest lockdown more difficult because of a realisation that coronavirus will be around longer than expected, dashed hopes about an easing of restrictions, and a period of sustained stress similar to overwork, which has prompted symptoms such as fatigue… your concentration getting sluggish, finding it harder to pay attention, and having sleep and memory issues.” |
| “School Catchup Could Take Five Years, Says Education Recovery Tsar”, Financial Times “Youth Who Graduate in a Crisis Will Be Profoundly Affected, and May Never Fully Recover” -- IMF | Nation’s are just beginning to grapple with the size of students’ COVID learning losses and the challenges they face in recovering them, in an economy where automation and AI technologies are improving at a rapid rate. In the US, this challenge continues to grow in those school districts where teachers unions are still blocking the reopening of schools. Unions are also arguing that standardized tests should be cancelled “because they would put too much stress on students.” However, that would also mean that the size of COVID learning losses would remain hidden, which would limit demands to substantially change school district budgets to recover them. As I wrote in another publication, if learning losses are not recovered, “Dark Days Lie Ahead.” |
| “COVID’s Long Shadow: Social Repercussions of Pandemics”, by Barrett et al from the IMF | SURPRISE “From the Plague of Justinian and the Black Death to the 1918 Influenza Epidemic, history is replete with examples of disease outbreaks casting long shadows of social repercussions: shaping politics, subverting the social order, and some ultimately causing social unrest. “Why? One possible reason is that an epidemic can reveal or aggravate preexisting fault lines in society, such as inadequate social safety nets, lack of trust in institutions, or a perception of government indifference, incompetence, or corruption. “Historically, outbreaks of contagious diseases have also led to ethnic or religious backlashes or worsened tensions among economic classes… “Recent trends in social unrest immediately before and after the COVID-19 outbreak are consistent with this historic evidence.” |
| | |
| | |
| | |
| | |
| | |
| | |
| | |
| | |
| | |
| New Political Information: Indicators and Surprises | Why Is This Information Valuable? |
| The latest IPSOS poll in the UK showed the Conservative Party up 12 points over Labor among workers, up 26 points outside of London and the South, up 41 points among senior citizens, and up 43 among those who voted for Brexit. In contrast, Labor is up 28 among those who voted to remain in the EU (i.e., against Brexit), up 27 in London and the South, up 46 among voters aged 18-24, but up only 2 among middle class voters. | This poll highlights a political alignment underway in the UK, which may be a signal of what is to come in other countries. A key uncertainty is whether the Conservative Party can develop and sustain economic and social policies that appeal to the working class, many of whom are made uncomfortable by Labor’s increasingly progressive stands on many social and cultural issues. At the same time, Labor Leader Keir Starmer is struggling to come up with a policy platform and message platform that is significantly different from the Conservatives’ but (as former leader Jeremy Corbyn proved) not so radically different that it guarantees electoral defeat. |
| In the US, both major parties will continue to struggle with intensifying intraparty conflicts. The Democrats face the challenge of balancing Progressives versus Traditional Democrats. This will not be easy; for example, a progressive Political Action Committee has already announced it will seek candidates who can challenge moderate Democratic Senators Joe Manchin (West Virginia) and Kyrsten Sinema (Arizona) in their next primary elections. The Republicans face a much bigger challenge, sorting through the wreckage of the past four years and trying to create new party policies and messages that are electorally viable. It remains to be seen what will emerge from this civil war (or circular firing squad) between multiple factions (e.g., right populists, business conservatives, social conservatives, and national security conservatives – all of which are themselves rent by factional infighting). And that requires a feature article, as it can’t be adequately analyzed here in the Evidence Notes. | Biden’s fundamental goal is to retain the Democratic Party’s control of the US House and Senate in the 2022 elections, and avoid Obama’s fate when he lost them both just two years into his first term. His strategy for retaining control of Congress while keeping the Progressive vs. Traditional Democrat civil war under control appears to be (1) make early policy changes that satisfy some progressive demands; (2) hope that the negative reaction to these from Republicans will, by 2022, be offset by a successful vaccination program that brings COVID under control, and a strong economic recovery due to his large stimulus package. As noted earlier in this Evidence File, both of these involve considerable uncertainty. Based on our calculations above, they are at best a 50/50 bet (the 70% probability that none of our seven potential crises occur in any one year, squared). |
| “Clarifying the Structure and Nature of Left-Wing Authoritarianism”, by Costello et al | SURPRISE “Authoritarianism has been the subject of scientific inquiry for nearly a century, yet the vast majority of authoritarianism research has focused on right-wing authoritarianism (RWA)… We investigate the nature, structure, and network of left-wing authoritarianism (LWA)… “Our results point to the fruitfulness of a tripartite conceptualization of LWA comprising three correlated dimensions—revolutionary aggression, top-down censorship, and anticonventionalism… “Revolutionary aggression reflects motivations to forcefully overthrow the established hierarchy and punish those in power… In the personality domain, revolutionary aggression is characterized by low agreeableness, low honesty-humility, low conscientiousness, and psychopathic disinhibition and meanness… “Top-down censorship reflects motivations to wield group authority (e.g., governmental limitations on speech) as a means of regulating characteristically right-wing beliefs and behaviors, mirroring RWA’s definitional core… “Anti-conventionalism, the final LWA dimension, reflects a moral absolutism concerning progressive values and concomitant dismissal of conservatives as inherently immoral, an intolerant desire for coercively imposing left-wing beliefs and values on others, and a need for social and ideological homogeneity in one’s environment” … “By and large, LWA and RWA seem to reflect a shared constellation of traits that might be considered the “heart” of authoritarianism. These traits include preference for social uniformity, prejudice towards different others, willingness to wield group authority to coerce behavior, cognitive rigidity, aggression and punitiveness towards perceived enemies, outsized concern for hierarchy, and moral absolutism.” |
| | |
| | |
| | |
| | |
| | |
| | |
| | |
| | |
| | |
| | |
| New Financial Markets and Investor Behavior: Indicators and Surprises | Why Is This Information Valuable? |
| “The ‘COVID’ Crash of the 2020 U.S. Stock Market”, by Shu et al | SURPRISE “The 2020 U.S. stock market crash originated from a bubble which began to form as early as September 2018 … We employed the log-periodic power law singularity (LPPLS) methodology to systematically investigate the 2020 stock market crash in the U.S. equities sectors with different levels of total market capitalizations through four major U.S. stock market indexes, including the Wilshire 5000 Total Market index, the S&P 500 index, the S&P MidCap 400 index, and the Russell 2000 index… “Our results indicate that the price trajectories of these four stock market indexes prior to the 2020 stock market crash have clearly featured the obvious LPPLS bubble pattern and were indeed in a positive bubble regime. Contrary to the popular belief that the COVID-19 led to the 2020 stock market crash, the 2020 U.S. stock market crash was endogenous, stemming from the increasingly systemic instability of the stock market itself.” |
| “CIO Of £19bn Pension Pot Casts Doubt Over Returns From Illiquid Assets” by Josephine Cumbo in the Financial Times | SURPRISE “The £19bn Local Pensions Partnership has hit out at asset managers that promote outsized returns to investors who lock up cash in long-term investments, saying the so-called illiquidity premium no longer existed for most assets. “Richard Tomlinson, chief investment officer of the LPP, which provides retirement benefits to about 600,000 town hall workers, said it used to be the case that illiquid assets, such as infrastructure or real estate, would typically deliver “excess returns” but the situation had changed. “Ten or 15 years ago, there was a premium paid in many areas for holding illiquids,” Tomlinson said in an interview with the Financial Times. “It used to be an easy sale of say private credit — ‘hey, if you can lock your money up we can get you extra return’. For return-hungry investors this made sense, assuming they could wear the illiquidity. “However, as more capital has flowed to these opportunities the returns offered have fallen. Suddenly there isn’t a premium to be had,” he said. |
| Competition for Attention in the ETF Space, by Ben-David et al | Count us as “shocked, just shocked” by these findings… “Exchange-traded funds (ETFs) are the most prominent financial innovation of the last three decades. Early ETFs offered broad-based portfolios at low cost. As competition became more intense, issuers started offering specialized ETFs that track niche portfolios and charge high fees. “Specialized ETFs hold stocks with salient characteristics| high past performance, media exposure, and sentiment that are appealing to retail and sentiment-driven investors. After their launch, these products perform poorly as the hype around them vanishes, delivering negative risk-adjusted returns. |
| “Time To Look Again At The Financial System’s Dangerous Faultlines”, by Paul Tucker, former Governor of the Bank of England, in the Financial Times | SURPRISE Given Tucker’s deep experience, we take his warnings very seriously. “The west cannot afford another financial crisis. It would be a disaster in every possible way domestically, and a geopolitical gift to strategic competitors in Beijing and elsewhere. “Last March and April, the fabric of our financial system was stretched almost beyond endurance. Only intervention from the north Atlantic central banks seems to have averted some kind of disaster triggered by markets grasping the pandemic was serious… “For the dollar’s place as the world’s premier reserve currency to be secure, trading in Treasuries must remain reasonably liquid in all weathers. The same goes for government bond markets on the European side of the Atlantic. “Three things are needed to tackle this part of the backlog of unfinished or neglected business for safeguarding stability. “First, central banks need to dust down the plans developed a decade ago for them to act as market makers of last resort — buying and selling securities, subject to an insurance premium — when trading liquidity evaporates… “Second, the plumbing and design of the main government bond and bond-lending markets need repairs, and possibly overhauling, if they are to cope with today’s extraordinary occasional bursts in selling activity… “Third, and most significantly, the spectre of excessive leverage and liquidity mismatches among some types of funds and other investment vehicles really must now be addressed. “Banking’s historical fragility is being replicated outside the industry, and without constraints or backstops. In general terms, this was foreseen: the re-regulation of banking after the 2008-09 collapse was obviously going to incentivise activity to migrate elsewhere. “There were plans to develop policies for such shadow banking, distinguishing it from the vanilla capital markets activity that does not represent a threat to the resilient provision of essential credit, insurance and payments services. But the plans stalled, and when the shadow banking label was ditched for the much more positive sounding “market-based finance”, the issue was, in effect, whitewashed.” |
| “After Brookfield’s Asset Shuffle What Cards Are Left To Be Played?” by John Dizard in the Financial Times | For almost 40 years, I’ve known that John Dizard (like his brother Steve) is a very sharp guy. So I always read his columns with great interest, as he is a true insider. In this column, John describes the hoops that Brookfield (a major Canadian property developer) is jumping through in its attempt to survive the COVID pandemic. As someone who spent a lot of years in restructuring and turnarounds, I found it a fascinating, if technical read. But the bigger picture is this: So far, COVID-driven insolvencies have been held at bay by sharp moves like the ones Dizard describes. I also know from experience that the number of moves like this that a company can make is limited. A lot of potential insolvencies are now riding on the bet that vaccines and the Biden and EU fiscal stimulus packages will revive the economy before you can kick the can no further. |
| “Wealth Creation in the U.S. Public Stock Markets 1926 to 2019”, by Hendrik Bessembinder | This report quantifies long-run stock market outcomes in terms of the increases or decreases (relative to a Treasury bill benchmark) in shareholder wealth, when considering the full history of both net cash distributions and capital appreciation. The study includes all of the 26,168 firms with publicly-traded U.S. common stock since 1926. “Despite the fact that investments in the majority (57.8%) of stocks led to reduced rather than increased shareholder wealth, U.S. stock market investments increased shareholder wealth on net by $47.4 trillion between 1926 and 2019… “The degree to which stock market wealth creation is concentrated in a few top-performing firms has increased over time, and was particularly strong during the most recent three years, when five firms accounted for 22% of net wealth creation. “These results should be of interest to any long-term investor assessing the relative merits of broad diversification vs. narrow portfolio selection.” |
| | |
| | |
System Tipping Points/Critical Threshold Analysis
Like Professors Andrew Lo, Doyne Farmer and others, we regard financial markets as a complex adaptive system (CAS), that exist as part of a larger macro system comprised of other CAS between which there are multiple feedback loops. These other systems include those that produce technology innovations, and economic, environmental, national security (including cyber), social, demographic, and political outcomes.
We also find that these systems tend to operate and generate effects in a rough chronological sequence, albeit with many feedback loops between them. The following chart highlights that the changes we observe in different areas at any point in time are actually part of a much more complex evolutionary process.
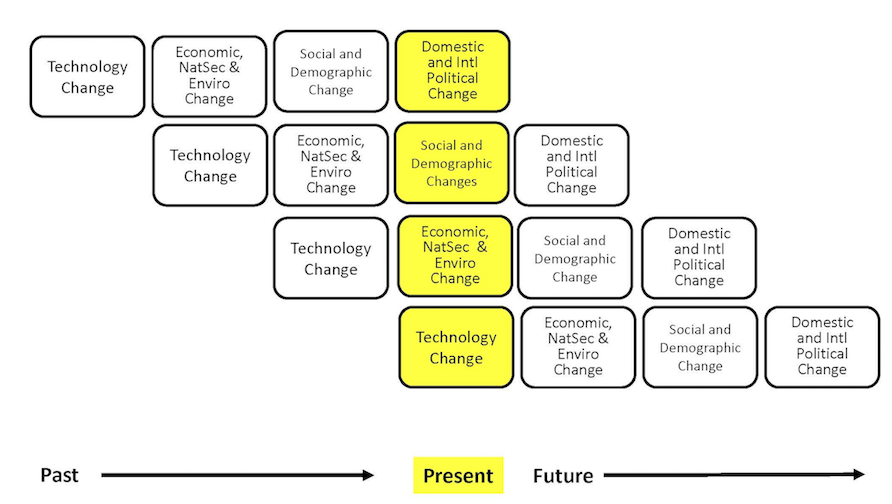
While most media coverage of these systems focused on flows (e.g., the size of the government deficit), rapid non-linear change in complex adaptive systems is often caused by a key stock (e.g., the amount of outstanding government debt) exceeding a critical threshold.
The next table highlights the key macro system stocks that we monitor.
In the next section, we will discuss information received over the past month that is related to these stocks, and which we believe is significant to our assessment of the probabilities that a critical threshold will be reached and a regime change will occur. We will conclude with our estimate, at the end of this month, of how close the macro system is to these critical thresholds, and the implications for financial market regime change probabilities.
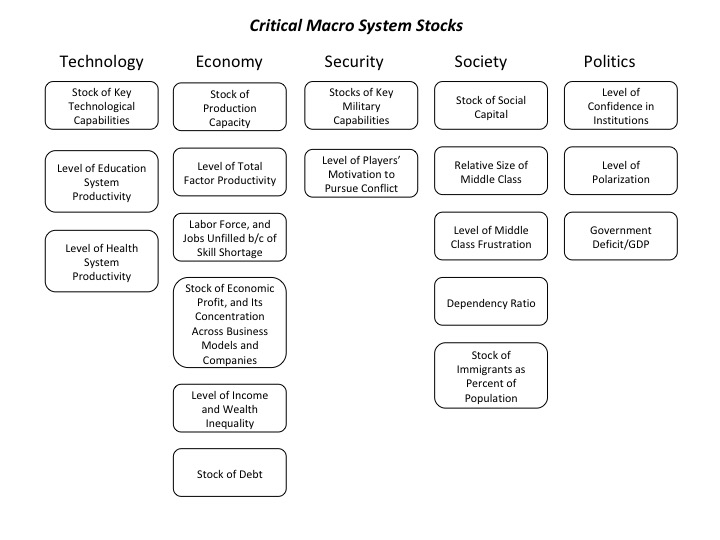
How Close is the Macro System to One or More Critical Thresholds?
As we have noted, the macro drivers of financial market regime changes typically follow a rough chronological sequence, from technology to economic, security, social, and political causes and effects. Yet there are many feedbacks loops between them, creating complex root causes for many of the critical thresholds we have identified.
Understanding the time dynamics in this complex system is critical to avoiding substantial downside investment risk.
We use the UK Met Office Warning Model to communicate our assessment of these time dynamics. We estimate the time remaining before a critical macro system threshold is reached that could trigger a regime change, which is usually accompanied by substantial changes in asset class valuations.
The model uses three increasingly serious levels of warning, from “Be Aware” (condition yellow), to “Be Prepared” (condition orange), to “Take Action” (condition red).
For our purposes, we denote as “Be Aware” (yellow) critical thresholds that we assess to be three or more years away. We estimate that “Be Prepared” (orange) thresholds could be reached within 1 to 3 years. “Take Action” thresholds are very likely to be reached within one year.
Given their nature, we also note that in our three “wildcard” areas (Environment and Energy related; Disease and Human Caused Bioevents; and Cyber and Electromagnetic Events), our forecasts have higher levels of uncertainty.
The following charts summarize our current estimate of the time remaining before different critical thresholds will be reached.
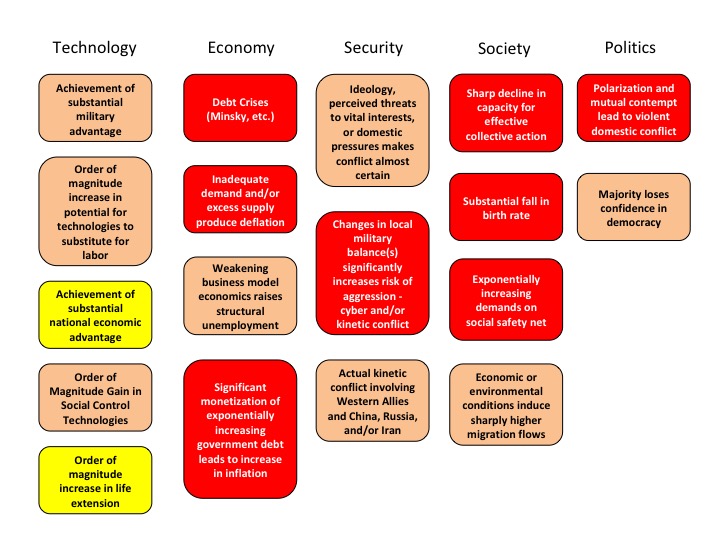
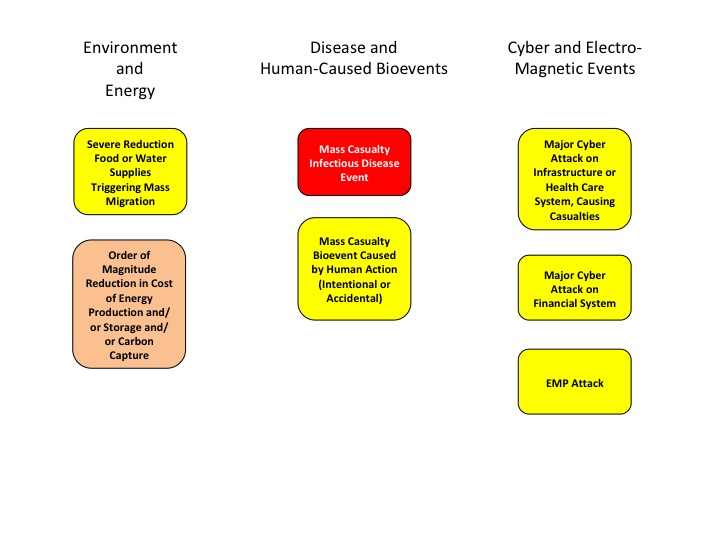
At the highest level, we believe the complex adaptive global macro system can be in one of four states, based on its degree of order versus disorder, and degree of social cooperation versus conflict. A very coarse-grained reading of history suggests that these states evolve in a predictable cycle, from ordered/cooperative, to disordered/cooperative, to disordered/conflicted, to ordered/conflicted.
We believe that the system is currently in its most uncertain state, characterized by high degrees of underlying disorder and social conflict, both domestically and internationally. Beyond some point, intensifying conflict eventually increases the degree of order in the system. That appears to be happening now, via the increasing conflict between China, Russia, and Iran and the United States and other Western nations.
If you have any questions about anything we have written in this issue, please don’t hesitate to get in touch, at contact@indexinvestor.com
Appendix: Anticipatory Thinking and Forecasting Methodologies
Our process is based on methods and tools developed over the past seven years at our affiliate, Britten Coyne Partners, which provides consulting services and education courses to executive teams and boards on strategic risk governance and management.
At The Index Investor, we engage in both anticipatory thinking to identify what could happen (e.g., different macro regimes and related events), and forecasting, to estimate the probability that events and regimes will happen, and the impact they will have if they do (e.g., on macro variables and broad asset class returns).
With respect to what could happen, we are acutely conscious of the conclusion reached by a 1983 CIA study of failed forecasts: "each involved historical discontinuity, and, in the early stages…unlikely outcomes. The basic problem was…situations in which trend continuity and precedent were of marginal, if not counterproductive value."
When it comes to forecasting, we know that in complex socio-technical systems that are constantly evolving, the accuracy of statistical or machine learning based forecasting methods declines exponentially as the time horizon lengthens, since the historical data set on which they were trained will (depending on the speed and effectiveness of any retraining cycle) bear less and less resemblance to the distribution of outcomes the system is likely to produce in the future.
Under these circumstances, forecast accuracy over longer time horizons depends on causal and counterfactual reasoning about the possible future effects of multiple interacting trends and uncertainties that are hard to quantify.
And we are acutely aware of the economist Rudi Dornbusch's famous warning: "Crises take a much longer time coming than you think, then happen much faster than you would have thought."
Our forecasting process also draws on lessons Tom Coyne learned from spending four years as a member of the Good Judgment Project team, which won the Intelligence Advanced Research Projects Activity’s forecasting tournament with forecast accuracy that was more than 50% better than the tournament's control groups (the team's experience is described in Professor Philip Tetlock's book, “Superforecasting").
Our analysis focuses on the probability of the global macro system being in four possible macro regimes 12 and 36 months from the date of our forecast: (1) Normal Times, where equity asset classes perform well; (2) a High Uncertainty regime that is usually short and transitory, where asset classes like short-term government bonds perform best and equities suffer significant declines; (3) High Inflation (which we deem 5% or more, year-on-year), where commercial property, real return bonds and other traditional hedges are favored; and (4) Persistent Deflation (a year-on-year decline in the US CPI), which up to now has only been seen in Japan, and in which the relative performance of different asset classes remains uncertain, but will likely favor high quality bonds and the consumer staples equity sector.
In response to subscriber requests, we have added a 36-month regime forecast to our existing 12 month forecast. The logic is that, in a complex evolving system like global macro, a longer forecast horizon gets beyond the “detection range” of algorithmic forecasting approaches, and therefore raises probability that a manager/investor can gain an edge in identifying emerging threats and opportunities.
That said, because evolving (i.e., “non-stationary”) complex systems populated by highly connected human agents are also capable of sudden non-linear changes (with which are hard for algorithmic approaches to predict), we are also keeping our 12 month forecast.
Our forecasting methodology starts with base rate/reference case data about the historical probability of large changes in equity and bond valuations. We then analyze the current situation from both a quantitative and qualitative perspective. In the latter, we focus on the key endogenous drivers of macro regime change, including technological, economic, national security, social, and political trends and uncertainties. We also focus on three potential sources of exogenous shocks that could also produce a macro regime change, caused by environmental, disease, and cyber related events.
While most of our attention typically focuses on various flows (e.g., economic growth, change in the price level, sales, earnings, job creation, etc.), endogenously caused regime changes result when those flows push key stocks beyond a critical threshold or tipping point, often setting off non-linear reactions across multiple areas. As noted by Hyman Minsky and others, a classic example is the steady accumulation of outstanding debt until it reaches the point where it can no longer be serviced and triggers a crisis.
Base Rate Data
Since the end of World War Two, there have been fifteen months where a downturn in the US equity market began that eventually reduced asset class value by 20% of more. That is a hazard rate of about 1.75% per month. Put differently, in any given month there is a 98.25% probability that a 20%+ downturn won’t occur, or, in a given year, an 81% probability.
However, as the time without a 20%+ downturn extends, the compound probability that one will not occur shrinks. At the end of August 2018, it is more than nine years since the last equity market decline of 20% or more. The probability of that happening is only 15%.
To estimate the base rate for a 20% fall in bond prices (which historically has been caused by a sharp increase in inflation, as we saw in the late 1970s and early 1980s), we analyzed monthly historical AAA bond yields since 1919. For consistency, we used them to calculate the price of a ten-year zero coupon bond. We then calculated the probability of a price decline of 20% or more over three different holding periods: 12, 18, and 24 months. In any month, the annualized probability of a decline of 20% or more over the subsequent 12 months is 12%; over 18 months, 20%, and over 24 months, 25%.
Market Stress Indicators Methodology
We view financial markets as a complex adaptive system. The size of changes generated by such a system follows a power law rather than a normal (Gaussian) distribution. The critical point is that large changes are much more common in complex adaptive systems than most people’s intuition leads them to believe.
While predicting the behavior of complex adaptive systems remains far more art than a science, various researchers have found that large changes in such systems are often preceded by subtle warning signs, as stress accumulates within them. While this research is not definitive, we believe that five warning signs are worth monitoring as potential indicators of growing stress within financial markets that could suddenly give rise to large changes in asset class valuations.
Our first indicator is the month-to-month autocorrelation of broad asset class returns (i.e., the relationship of this month’s returns to last month’s). A system under increasing stress loses resiliency, causing it to take longer to recover from perturbations; hence, autocorrelation increases as it approaches a critical transition (see, “Early Warning Signals for Critical Transitions” by Scheffer, et al).
The second market stress indicator we monitor is the Economic Policy Uncertainty Index published by the Federal Reserve Bank of St. Louis (via its FRED economic database), which is based on research by Baker, Bloom, and Davis (see their paper, “Measuring Economic Policy Uncertainty”). The index is based on automated text analysis of leading newspapers and magazine publications, to identify the frequency with which words and phrases are used that indicate uncertainty.
In humans’ evolutionary past, when uncertainty increased the probability of survival was enhanced by staying close to a group. All of us still have that instinct. Research has found that as uncertainty increases, we have an unconscious bias towards higher conformity of our own views with those of a larger group (i.e., reduction in cognitive diversity). Behaviorally, heightened uncertainty induces more “social copying” of others, likely due to both conformity bias and the rational belief that others may be acting on the basis of superior information. This increase in conformity and copying makes a social system more ordered as uncertainty increases, and also reduces its responsiveness to perturbations (i.e., increases autocorrelation) because of delays in the social copying process.
The key point is that increasing uncertainty induces more, not less order in social systems, and in so doing primes them for sudden non-linear change.
Our third market stress indicator is the spread between the yield on AAA rated bonds and the 10-year US Treasury. This is a proxy for the level of investor concern about financial system funding liquidity.
Our fourth market stress indicator is the yield spread between speculative BB rated bonds and the ten-year US Treasury. Throughout history, excessive credit growth has been a root cause of many financial crises. An indicator of such growth is falling credit spreads, particularly in the case of riskier borrowers. In contrast, rising BB spreads indicate growing investor concern about the consequences of such growth, and the financial distress lower rated companies could experience in an economic downturn.
Our fifth market stress indicator is what we term the “political risk premium” that is implicit in the price of gold. Our starting point for estimating this premium is the three different roles that gold plays. First, gold is a store of value in a world of fiat currencies. When the rate of money supply growth exceeds the growth of nominal GDP, gold’s price should increase to maintain its purchasing power. Between 2007 and 2017, the US money supply (M2) grew by about 86%, while nominal US GDP grew by 35%. The stock of gold grew by 18%, based on mine production over this period. We therefore infer that 33% of the increase in the price of gold represented the maximum potential gold price change that could be attributed to a desire to hedge inflation risk (86% less 35% less 18%).
Second, gold is a unit of account. We take this to mean that the annual change in GDP expressed in terms of physical gold (i.e., nominal GDP divided by the price of gold) should equal the change in real GDP calculated using the GDP price deflator to account for actual inflation over the period. A key challenge is the point at which to start this calculation.
We chose the price of gold in 1995/1996. In that period, the change in real global GDP measured using the IMF’s price deflator just about equaled the change in GDP measured in terms of physical gold. We interpret that coincidence as indicating that at that point in time, concerns about future inflation and political risk were minimal, and the change in the price of gold was mostly driven by its role as a unit of account. We calculated a subsequent series of gold prices that would produce the same change in “gold GDP” as the actual real GDP as calculated by the IMF. Between 2007 and 2017, “gold as a unit of account” warranted a 21% increase in its price.
Gold’s third role is as a hedge against inflation and what we term “political disaster” risk. We subtract the 21% estimated compensation for actual inflation from the 33% “gross” inflation risk hedge to derive an apparent 12% increase in the gold price that reflected the true risk premium to hedge against possible future inflation. However, between 2007 and 2017 the price of gold actually increased by 81%. This implies that 48% of this (81% less 21% less 12%) represented a premium for some other type of uncertainty at the end of 2017. The interesting question is the nature of the uncertainty for which gold is believed by some investors to be a superior hedge than traditional ports in a storm like short-term US government securities, or similar securities issued by other developed countries.
The logical inference is that the uncertainty in question must reflect a situation in which short term US Treasuries would be a less effective hedge than gold. This could be a world of widespread hyperinflation, capital controls, and/or radical changes in nations’ governments (of course, this would also imply a preference for investing in gold coins rather than bullion, as while the latter may be a store of value, it is far less convenient as a means of paying for transactions).
To put this in further perspective, this gold price “disaster risk” premium sharply increased from 2008 to 2012, then declined before sharply increasing again after 2016. Arguably, a significant part of the former increase reflects concerns about the potential inflationary consequences of dramatic quantitative easing by central banks. But this is not likely to be the case after 2016.