The Index Investor
February 2020
Tactical Asset Allocation Implications of Our Forecasts
Forecast Logic
Forecast Pre-Mortem Analysis
Combining and Extremizing Forecasts to Improve Predictive Accuracy
Feature Article: Civilization Decline and Collapse: What are the Warning Signs?
High Value Information Observed Last Month
Critical System Thresholds/Tipping Points Analysis
Appendix: Anticipatory Thinking and Forecasting Methodologies
Current Macro Forecast
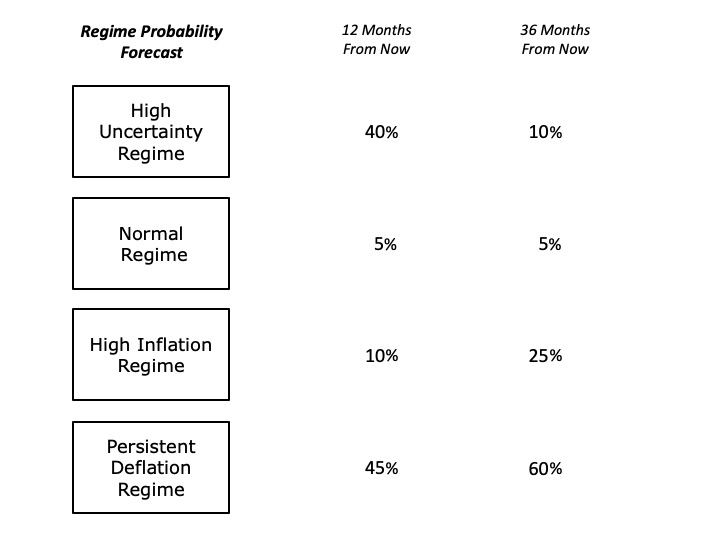
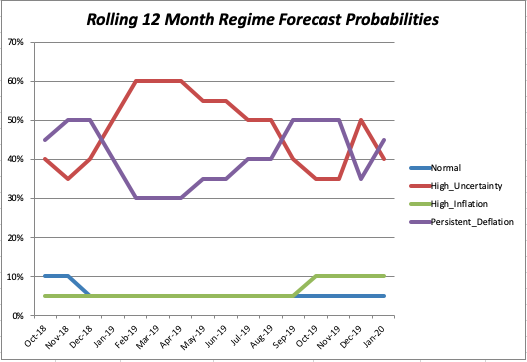
The key driver of the change to our forecast was the body of evidence that emerged over the past month regarding the Wuhan coronavirus, including its Basic Reproduction Number (which measures its ease of transmission) and its Case Fatality Rate. As described in this month’s Evidence File, both are sufficiently high that a critical uncertainty at this point is the effectiveness of public health measures (such as quarantines and travel bans) that other nations have or will put in place to contain its spread. If these measures fail, the negative impact on aggregate demand could be substantial (as already seen in energy and industrial metals prices). Moreover, given high levels of debt in many parts of the global economy, a sharp downturn in economic activity could easily trigger a cascading debt deflation cycle.
The argument for the High Uncertainty Regime prevailing over the next 12 months rests on successful control of the potential coronavirus pandemic. If this happens, it would refocus attention on political and policy uncertainties, including the outcome of the US election and post-Brexit UK trade negotiations with the EU and other nations. Another critical uncertainty might be China’s future behavior, if Xi Jinping is removed from power as a consequence of his party faction’s poor management of the coronavirus outbreak.
There was no change this month to our 36-month forecast probabilities.
We continue to believe that the Persistent Deflation regime is most likely by then because of multiple headwinds restraining aggregate demand growth, including population aging, weak productivity growth, high levels of both inequality and debt, and the threat of job displacement as increasingly capable automation and artificial intelligence technologies are deployed. At the same time, supply capacity in many sectors has increased (e.g., because of automation). In the United States, increases in the Consumer Price Index have been driven by rising prices in sectors insulated from competition, including healthcare, education, and housing. However, even in these sectors drivers of price increases are weakening.
At the 36-month time horizon we view the High Inflation scenario as very unlikely. An increase in the US inflation caused by investor abandonment of US dollar assets presupposes that other markets are deep and liquid enough to absorb large inflows, and are perceived as less risky than the United States. Both of these are very unlikely at this time.
That said, a collapse in investor confidence in all fiat currencies (the most likely cause being substantial and prolonged central bank money creation to finance increasing government fiscal deficits) would certainly lead to an increase in the price of gold and other hard assets (e.g., property and timber). However, absent a major change in relative exchange rates, it would not automatically drive up inflation. What could do this would be a sharp reduction in the supply of goods and services, either because of an external shock (e.g., as happened in the case of the 1973 oil price shock) or an internal shock (e.g., as we have seen in developing countries that mandated increased worker wages while raising taxes on companies to the point they were forced to close down).
Finally, with equity valuation metrics at or near record highs, while spreads on low quality credits are at or near record lows (especially after a ten-year expansion) we believe the least likely outcome is a return to the Normal Regime over either the next 12 or 36 months.
Portfolio Allocation Implications of Our Forecast
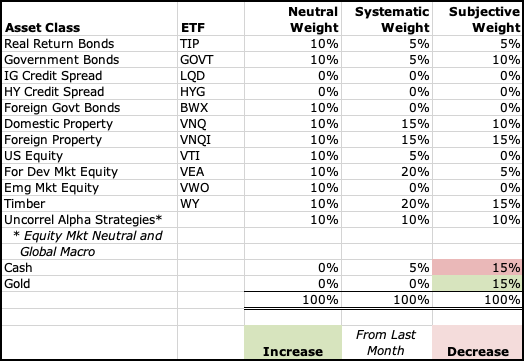
We take two approaches to deriving the tactical asset allocation implications from our analyses. The first takes a systematic approach, and is based on relative asset class valuations. Our starting point is our “neutral” model portfolio, which is equally weighted across nine broad asset classes, and also includes a 10% allocation to alpha strategies (equity market neutral and global macro) that are designed to have a low correlation to returns on broad asset classes. Based on asset class valuations, we systematically vary the asset class weights (but not the active strategy weight), increasing from 10% to 15% when an asset class is likely undervalued, and 15% when it is very likely undervalued. In the case of overvaluations, we go to 5% and then into cash, if there are no undervalued asset classes with room for an increase. In effect, this replicates the systematic rebalancing strategy we used for 15 years in our previous model portfolios.Based on subscriber requests, this month we are re-introducing a feature from the previous version of The Index Investor: Tactical Asset Allocation Implications from our analyses.
The second tactical approach is based on our subjective view not only of current asset class valuations, but also of the implications of the broader macro trends and uncertainties that we analyze each month. Importantly, this subjective view reflects our primary goal of avoiding large downside losses, rather than seeking large upside gains.
Two final notes: First, with respect to US fixed income, we include credit products (investment grade and high yield) in the same asset class as government debt, and will shift into the former when their valuations become attractive. Second, we regard gold not as a separate asset class to be held long-term, but rather as a complement to cash, into which we shift in periods of substantial overvaluation across multiple asset classes.
More information about our investment beliefs, including our core philosophy, approach to asset allocation (including our model portfolios and their long-term track record), and views on various approaches to active and passive management can all be found here.
Here is our latest asset allocation view:
Forecast Logic: Quantitative Indicators
Implications of the Most Recent Three Month Asset Class Returns
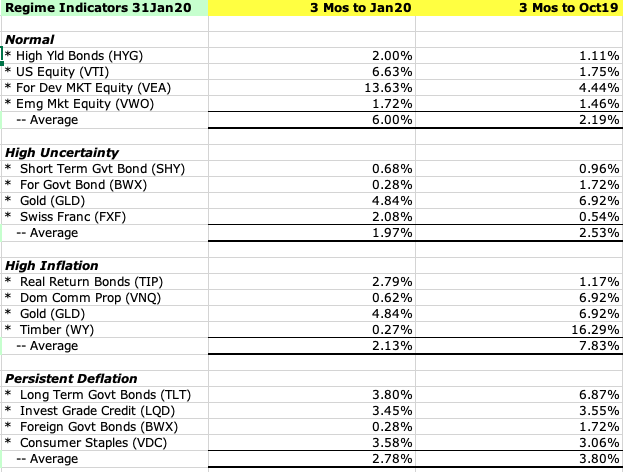
Our quantitative forecast methodology focuses on the level and change in three-month returns, over the most recent and previous three-month periods, for those asset classes, which should perform best under different regimes (in this sense, our regimes can be regarded as macro factors). We assume that relatively higher returns are associated with more widely held investor beliefs in the probability that a given macro regimes will develop in the future.
Over the last three months, there has been a relative strengthening of investors’ belief that the normal times regime lies ahead.
Asset Class Valuation and Momentum Indicators (@31Jan20)
| Asset Class (ETF) | Valuation | 1 Month Return | Conclusion |
| US Real Return Govt Bond (TIP) | Likely Overvalued* | 2.14% | Increasing Overvaluation |
| US Nom Return Govt Bond (GOVT) | Likely Overvalued* | 2.51% | Increasing Overvaluation |
| US Investment Grade Credit (LQD) | Likely Overvalued* | 2.45% | Increasing Overvaluation |
| US High Yield Credit (HYG) | Almost Certainly Overvalued* | (0.47)% | Decreasing Overvaluation |
| US Commercial Property (VNQ) | Likely Undervalued* | 1.23% | Decreasing Undervaluation |
| US Equity (VTI) | Likely Overvalued* | (0.06)% | Decreasing Overvaluation |
| Foreign Devel Mkt Equity (VEA) | Very Likely Undervalued* | 8.35% | Decreasing Undervaluation |
| Emerging Markets Equity (VWO) | Very Likely Overvalued* | (5.53)% | Decreasing Overvaluation |
| Timber (WY) | Almost Certainly Undervalued* | (4.14)% | Increasing Undervaluation |
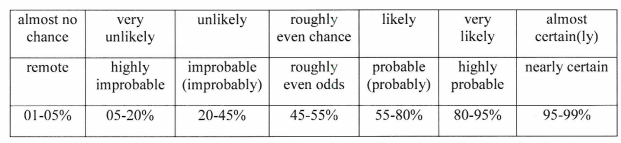
Note: The language we use to describe our estimated likelihood of asset class over or undervaluation is based on US Intelligence Community Directive 203 on Analytic Standards, which includes the following table:
Market Stress Indicators (@31Jan20)
| Market Stress Indicator | This Month vs Last Month |
| Asset Class Returns Autocorrelation (this month versus last month). Higher autocorrelation is an indicator of higher market stress. | .66 vs .12 last month. This indicates a significant increase in the level of market stress. |
| Economic Policy Uncertainty Index (how many days over the last 30 was index in top quartile of values since 1985?). A higher number equals more market stress. | On 8 days last month the index was in the top quartile of daily values since 1985 (the 63rd percentile of all rolling 30-day periods). This is a decrease from 12 last month, indicating less market stress. |
| AAA Rated Bonds Spread over 10 Year Treasury Yield (month end). Higher spreads indicate rising concern about market liquidity. | 1.31% (52nd percentile since 1983), vs 1.12% at the end of Dec18. |
| BB Rated Bonds Spread over 10 Year Treasury Yield (month end). High spreads indicate increasing credit risk. | 2.41%, (22nd percentile) down from 2.02% last month. Still extremely low after ten years without a recession. |
| Gold Price per Ounce in US Dollars (month end). Rising gold prices are an indicator of increasing market uncertainty and stress. | $1,523 vs $1,523, up 4.6% from last month. At the end of 2017, we estimated the “disaster premium” in the gold price was 47% (see our methodology in the Appendix). At the end of last month it was 69%. (see our methodology in the Appendix). |
New Qualitative Evidence
Based on our qualitative analysis of accumulated and new evidence, we are considerably more pessimistic about the future than those investors whose trades have driven the returns on different asset classes. We continue to believe that three years from now the most likely outcome is that the global macro system will be in the persistent deflation regime.
In our forecasting approach, technology and environmental developments tend to precede economic and national security changes, which in turn precede social and political trends and events, whose effects then become visible in financial markets. As covered in more detail in this month’s Evidence File (see below), here are the most important new indicators and surprises that influenced this month’s changes to our regime probability forecasts:
Technology:
- New evidence regarding an underestimate of the impact of automation on labor markets (and the labor share of income) that has already occurred, and new evidence based on patent analysis regarding the future potential impact of artificial intelligence technologies on higher wage work.
Environment:
- New evidence (from McKinsey and the World Bank) that significant financial market impacts from climate change could occur sooner than the prevailing conventional wisdom expects.
Health and Infectious Disease:
- The emergence of Wuhan coronavirus, with initial estimates of a Case Fatality Rate of 2% (based on confirmed cases), which is significantly below SARS and MERS, but still much higher than seasonal influenza (0.1%).
- The transmissibility of infectious disease is measured by the Basic Reproduction Number (the number of other people a contagious person will infect). At an estimated 1.4 to 2.5, Wuhan is in the same range as SARS. This means that containing a potential pandemic will require the imposition of aggressive public health measures, like travel bans and quarantines.
Economy:
- The US Congressional Budget Office projected substantial, continuing increases in the US budget deficit, and ration of government debt to GDP.
National Security:
- January once again saw new articles and papers describing rising problems in China (even before those critical of the government’s response to Wuhan coronavirus), which increases uncertainty about the durability of Xi Jinping’s hold on power and what could happen if he feels in imminent danger of losing it (e.g., more aggressive external action).
- A new wargame report from RAND found that increased use of AI and autonomous systems make conflict escalation much harder to control. Two other analyses criticized the United States’ Defense Department’s AI strategy and skill base.
Society:
- The new Edelman Trust Barometer found that trust in institutions continues to drop, reflecting a growing “crisis of competence” in their perceived ability to effectively respond to a growing range of complex challenges facing the world. In turn, this crisis of competence feeds the decline in the perceived legitimacy of many institutions, and thus the increase we see in support for populists of all stripes.
- A new analysis found that both demand and supply side factors are driving the increasing withdrawal of men from the US labor force.
Politics:
- A global survey found popular satisfaction with democracy is at record lows in many countries.
- After the Iowa caucuses and New Hampshire primary, “Democratic Socialist” Bernie Sanders has emerged as the leading contender for the Democratic Party’s presidential nomination.
Financial Markets:
- A new analysis found widespread investor underestimation of the embedded risks in many structured yield enhancement products.
Pre-Mortem Analysis
One of the most important forecasting disciplines is to ask yourself why your forecast could be wrong. Dr. Gary Klein’s research has shown that a very powerful and insightful way to do this is via a “pre-mortem analysis.” This method asks you to assume that it is a point in the future, and your forecast has been proven wrong (or your strategy or company has failed). You are then asked to look backward from this imagined point in the future, to explain why you failed, what you missed, and what you could have done differently to avoid your fate.
The pre-mortem method takes advantage of the fact that humans reason much more concretely and in more detail when explaining the past than they do when trying to forecast the future.
So let us assume that it is one year from now, and our current forecast has turned out to be wrong.
How did this happen? What developments did we fail to anticipate?
Scenario #1: The leaders of the world’s three major powers – Xi Jinping, Donald Trump, and Vladimir Putin are all facing weakening economies and declining political popularity. History teaches us that this can lead to increased “foreign adventurism” to distract the public from worsening domestic conditions, as a nation rallies around its leader in a period of heightened external conflict. Should a “kinetic” conflict develop between China and the United States, or between Russia and one or more European countries (e.g., due to a Russian incursion into the Baltics), it would generate a very sharp increase in uncertainty that would likely cause an equally sharp economic slowdown which, given high debt levels, would speed the arrival of the Persistent Deflation Regime.
Scenario #2: A supply side shock of some type could produce a sudden increase in inflation – the most likely scenario being a reduction in oil supplies due to a prolonged kinetic conflict between Iran and the US that produced an extended disruption in global oil supplies. A less likely cause could be major crop failures.
Scenario #3: Another route to the high inflation regime (repeatedly noted by Bridgewater’s Ray Dalio) would be a sudden loss of confidence in the US dollar relative to other currencies (driving up import prices), perhaps because of deficit monetization and policy paralysis as a severe downturn continues. However, this would also require that there was relatively more confidence in another currency, with the Euro being the most likely candidate. This currently seems unlikely, given both the Eurozone’s economic and political situation, and the prospect of an intensifying conflict between the West and China. However, if confidence collapsed in all major currencies, a sharp increase in inflation would lead to a dramatic rise in the price of gold.
Note: Combining Our Forecasts with Others From Other Sources and Extremizing the Result Should Increase Your Predictive Accuracy
Research has found that three steps can improve forecast accuracy. The first is seeking forecasts based on different forecasting methodologies, or prepared by forecasters with significantly different backgrounds (as a proxy for different mental models and information). The second is combining those forecasts (using a simple average if few are included, or the median if many are). The final step, which significantly improved the performance of the Good Judgment Project team in the IARPA forecasting tournament, is to “extremize” the average (mean) or median forecast by moving it closer to 0% or 100%.
Forecasts for binary events (e.g., the probability an event will or will not happen within a given time frame) are most useful to decision makers when they are closer to 0% or 100% than the uninformative “coin toss” 50%. As described by Baron et al in “Two Reasons to Make Aggregated Probability Forecasts More Extreme”, forecasters will often shrink their probability estimates towards 50% to take into account their subjective belief about the extent of potentially useful information that they are missing.
When you average multiple forecasters’ estimates, you are including more information, which should increase forecast confidence and push the mean estimate closer to 0% or 100%. However, this doesn’t happen when you use simple averaging. For this reason, forecast accuracy is increased when you employ a structured “extremizing” technique to move the mean estimate closer to 0% or 100%.
You can download an extremizing model from our website to use when combining the forecasts you use in your decision process.
The extremizing factors in our model are those that the Good Judgment Project found maximized the accuracy of combined forecasts. Note that the extremizing factor is lower when average forecaster expertise is higher. This is based on the assumption that a group of expert forecasters will incorporate more of the full amount of potentially useful information than will novice forecasters.
Feature Article: Civilization Decline and Collapse: What are the Warning Signs?
“I think of myself as a historian more than a statesman. As a historian, you have to be conscious of the fact that every civilization that has ever existed has ultimately collapsed. History is a tale of efforts that failed, of aspirations that weren’t realized, of wishes that were fulfilled and then turned out to be different from what one expected. So as a historian, one has to live with a sense of inevitable tragedy. [But] as a statesman one has to act on the assumption that problems must be solved.” -- Henry Kissinger
In the three years since Brexit and the election of Donald Trump, an increasing number of commentators have openly wondered if the decline of Western Civilization is upon us, and whether that decline will ultimately end in a collapse. For example, writing in New York magazine on 7Aug19 (“Can the Country Come Back from Trump? The Republic Already Looks Like Rome in Ruins”), Andrew Sullivan observed that, “It’s impossible to review the demise of the Roman Republic and not be struck by the parallel dynamics in America in 2019.”
“We now live, as the Romans did, in an economy of massive wealth increasingly monopolized by the very rich, in which the whole notion of principled public service has been eclipsed by the pursuit of private wealth and reality-show fame. Cynicism about the system is endemic, as in Rome. The concept of public service has evaporated as swiftly as trust in government had collapsed. When the republican virtues of a Robert Mueller collided this year with the populist pathologies of Donald Trump, we saw how easily a culture that gave us Cicero could turn into a culture that gave us Caesar. Class conflict — which, in America, has merged with a profound cultural clash — has split the country into two core interests: the largely white lower and middle classes in the middle of the country, roughly equivalent to Rome’s populares and susceptible to populist appeals by powerful men and women; and the multicultural coastal elites, whose wealth has soared as it has stagnated for the rest, and who pride themselves on their openness and meritocracy: the optimates.
“And just as in late-republican Rome, each side has begun not to complement but to delegitimize the other. The result, as in Rome, is a form of deepening deadlock, a political conflict in which many on both sides profoundly fear their opponents’ power, and in which compromise through the existing republican institutions, particularly Congress, has become close to impossible. Think of Pompey’s and Caesar’s armies not as actual soldiers but as today’s political-party members and activists, mobilized for nonviolent electoral battle and dissatisfied with anything less than total victory.”
Similarly, writing in January 2020 on the WaronTheRocks.com website, Francis Gavin questioned whether we are “Asking the Right Questions About the Past and Future of World Order”.
He began by noting that, “there are two great challenges to the contemporary world order — the dramatic rise of China and the consequences of the profound transformation of the global economy and international system, a revolutionary change on par with the Industrial Revolution. Most of the current debates on world order focus on the capabilities and intentions of a growing China. This is understandably important; in the past, rapidly-rising powers have challenged global arrangements, with calamitous military conflicts as the result. These two stories, however — the rise of China and the global dynamics of technology, demographics, and socio-economics — are intertwined and cannot be understood, or dealt with, separately.
“[However], the second challenge — which has transformed everything from demographics to governance to how people live and work and self-identify to calculations about war and peace — is the key challenge, and the one that people aren’t focusing on enough. Beginning in the United States in 1960s, accelerating in the 1970s, and spreading and intensifying in recent decades, how the global system operates has been completely upended. It is, to a great extent, the reason for China’s rise. The consequences of this revolution are impossible to overstate and hard to fully accommodate under current arrangements…There is an overriding sense of anxiety, dread, worry, and concern, a sense that world order is trending in the wrong direction. The elements that underpinned the postwar order in the second half of the 20th century may not be relevant to these issues…
“The problems that we faced in the past were based on scarcity. Wealth was scarce, resources scarce, information was scarce, security was scarce, health was scarce, and with populations increasing by leaps and bounds in the 19th and first part of the 20th century, intense competition for these scarce resources was bound to be violent. The problems we face now — the explosion of information and disinformation, unthinkably large global financial flows, the large movement of people, climate change generated largely by world-wide economic success, anxiety and uncertainty due, in some measures, to the dizzying increase in individual freedoms — these might be called the problems of plenty…
“Neither our intellectual tools nor our governing institutions were constructed to deal with these problems of plenty…The postwar, state-based international order was built to handle great-power war and old-timey economic crises like currency depreciations. They are completely overwhelmed when dealing with the issues we are currently facing and, in fact, often respond to these new problems with old solutions. The same goes for our scholarly models, whether in international relations or economics, which are based on scarcity models and don’t always do well dealing with the problems of plenty. The types of insecurity we face look nothing like those that worried order-builders in the middle of the 20th century. This has generated a legitimacy crisis for governance, both nationally and internationally.”
For years, the cause of civilization decline has been a popular topic. As Martin Scheffera wrote in “Anticipating Societal Collapse: Hints from the Stone Age”, “Few aspects of human history are as mindboggling as the sudden disintegration of advanced societies. It is tempting to seek common patterns or even draw some lessons for modern times from the many ancient cases of societal disintegration.”
In this month’s feature article, we will pursue these questions, beginning with what theory tells us about possible causes of civilizational decline and collapse, then moving on the conclusions reached by various historians. We will then synthesize these findings, and use them to develop a set of early warning indicators to help you better discriminate between the normal ups and downs of social, economic, and political cycles, and signs of more dangerous structural decline that could accelerate and produce some form of collapse.
However, before we start on this journey, it is important to distinguish between potential natural and man-made sources of civilizational collapse or extinction.
Potential “natural” existential risks include events that have or could be subjects of disaster films, such as:
• An asteroid strike,
• Supervolcano eruptions,
• Alien invasion,
• Naturally occurring pandemics,
• A massive solar storm or gamma ray burst from a supernova.
Potential human driven causes include extremely large destructive events caused by:
• Particle physics research (e.g., “Review of Speculative Disaster Scenarios at RHIC” by Jaffe et al),
• Artificial intelligence,
• Cyber war or malicious actions,
• Nuclear war (including widespread use of electro-magnetic pulse weapons),
• Accidental or intentional misuse of synthetic biology research,
• Accidental or intentional misuse of nanotechnology (e.g., uncontrolled, self-perpetuating processes, like molecular manufacturing),
• Climate change that severely disrupts food supply,
• Severe depletion of critical resources.
There is no shortage of analyses on the potential risks posed by all of these events (e.g., see, “Existential Risks: Analyzing Human Extinction Scenarios and Related Hazards” by Nick Bostrom). Hence, that will not be our focus here. Instead we will focus on perhaps the most difficult source of civilizational decline: the interaction over time of complex processes that can suddenly produce an emergent collapse.
As Scheffera notes, “there are at times striking parallels between stories of collapse even if they happened in entirely different periods…Perhaps the single most-intriguing aspect across stories of collapse is the speed with which massive change can be precipitated. This rapidity is also the aspect that makes such events feel so relevant from a modern perspective. How is it that a once-thriving society can so suddenly fall apart? Could it happen again? If so, is there any way we can foresee where and when? If collapse is just driven by extreme events, such as epidemics or monster droughts, it may be entirely unforeseeable. However, if the underlying cause is a gradual loss of resilience, causing societies to become fragile, we might be able to predict where collapse is most likely.”
What We Can Learn from Theory
A number of theories from different disciplines describe how system collapse can occur.
The most fundamental of these is the Second Law of Thermodynamics, which tells us that the level of disorder (entropy) in an open system will naturally increase over time in the absence of injections of energy and/or information. As Harvard’s Eric Chaisson describes in “The Natural Science Underlying Big History”, “Energy is a principal facilitator of the rising complexity of ordered systems within the expanding Universe; energy flows are as central to life and society as they are to stars and galaxies. In particular, energy rate density—contrasting with information content or entropy production—is an objective metric suitable to gauge relative degrees of complexity among a hierarchy of widely assorted systems observed throughout the material Universe.”
Looking at recent history, the remarkable increase in global growth and material wellbeing from the 19th century onward coincided with the dramatic increase in energy rate density associated with the use of fossil fuels. In the absence of a similar fuel source, the exhaustion or banning of fossil fuel use could produce a sharp decline in economic output, which would very likely trigger substantial (and highly uncertain) negative social and political effects (see also “Thermodynamics of Long Run Economic Innovation and Growth” by Timothy Garrett, and John Greer’s “How Civilizations Fall: A Theory of Catabolic Collapse”).
Complexity and Complex Adaptive Systems theory also describes how sudden collapse can occur. The simplest formulation of this assumes that systems fail when their fitness falls below the selection threshold in their environment. A system is composed of “N” different agents, with “K” connections between them. These agents seek to increase the overall fitness of the system to avoid it being selected out of existence. In each period, every agent recommends a step that will improve its individual fitness. However, via the network of “K” connections to other agents, these individual changes may cause the fitness of other agents to decline. If all, or even a majority of agents must approve a given set of system changes (i.e., the changes each agent wants to make), self-interested agents whose fitness will decline are unlikely to agree, even if the overall fitness of the system as a whole would increase.
As you can see, as the number of connections between agents (“K”) increases, it becomes less likely that the system will be able to improve its fitness, even as external changes in its environment cause it to move closer to the section threshold. This is known as “complexity catastrophe.” An applied example of this concept is Mancur Olson’s writing on how an increasing number of interest groups can lead to national decline (see his book, “The Rise and Decline of Nations”). Similar to this is Francis Fukuyama’s concept of “vetocracy” – “a dysfunctional system of governance whereby no single entity can acquire enough power to make decisions and take effective charge” (see his book, “Political Order and Political Decay: From the French Revolution to the Present”).
Complex adaptive socio-technical systems are made up of many interacting subsystems – e.g., technology development, the economy, society, politics, and financial markets. Each of these is characterized by a dense network of cause/effect relationships, many of which act with either time delays and/or in a non-linear manner. Moreover, the agents in these systems (e.g., individuals, organizations, nations, etc.) are constantly adapting their relationships and behavior in response to its effectiveness in achieving their goals, which themselves sometimes change. Hence over time the very nature of a complex adaptive system is constantly evolving.
Due to both their complexity and their adaptive nature, it is impossible to accurately predict the behavior of these systems, particularly as the forecast time horizon lengthens. At best, you can attempt to develop a “coarse-grained” understanding of the system’s critical dynamics, from which observed effects – successes and failures – are said to “emerge.” Critically, the distribution of the effects produced by complex adaptive systems tends to follow a power-law distribution, with many relatively small changes and a few very large ones.
Systems Dynamics theory describes one way such effects can occur. It is based on the relationship between flows, stocks, and feedback mechanisms. Flows go into and out of stocks, which have a finite carrying capacity. When that capacity is exceeded, the system can experience a catastrophic event and/or change in function. For example, if the flow of water into a bathtub exceeds the flow out the drain, the tub will overflow, which can trigger an electrical short-circuit that burns down a house. Feedback mechanisms should regulate flows and prevent catastrophes from occurring. But sometimes they fail.
Another relevant body of theory focuses how to avoid sharp declines in organizational effectiveness and efficiency by designing and operating systems that are robust, resilient, and adaptive. Robust strategies have a high probability of achieving their goals under a wide range of possible future scenarios. When they fail to do this, and/or when an unanticipated external shock occurs, resilient systems continue operating with only a minimal initial reduction in their effectiveness and efficiency.
System resiliency usually requires a redundancy in critical systems, maintenance of some slack resources (i.e., extremely high efficiency tends to reduce resiliency), and agility (i.e., the ability to quicky assess dynamic situations, develop courses of action, decide which one(s) to pursue, and implement them with urgency). After absorbing and initially responding to the negative shock, adaptive organizations identify and implement more permanent changes to sustain effectiveness and efficiency at or above their pre-shock levels.
Robustness, resiliency, and adaptiveness don’t happen by accident. They depend on the constant cultivation of organizational ability to make sense of complex systems and anticipate some, if not all, of the outcomes that can emerge from them; having sufficient resources, redundancy, and organizational flexibility to be resilient in the face of negative shocks; and the culture and capacity to adapt to severe changes in their external environment. When these underlying organizational capacities are allowed to atrophy, systems become increasingly vulnerable to sudden collapse in response to even small shocks.
A final theory that is relevant to system collapse is known as the “OODA” loop, which was first defined by US Air Force Colonel John Boyd, in the context of improving air combat performance. The first “O” stands for “Observation”, or paying attention to the most critical factors in a dynamically evolving environment. The second “O” stands for “Orientation”, which means making sense of the key factors on which you have focused your attention.
Sensemaking gives rise to “situation awareness”, which Mica Ensley (former Chief Scientist of the US Air Force) has found exists at three increasingly difficult levels. The first, and lowest (L1), is perception of the most important elements in a given situation. The second (L2) is understanding the relationships between these elements. The highest level (L3) of situation awareness is the ability to use your understanding of L1 and L2 to project in time how a situation is likely to evolve in response to different actions you could take.
In the OODA mode, “D” stands for “Decide” – the ability to generate alternative courses of action, mentally simulate their expected results, and select the one with the highest probability of achieving your goal(s).
“A” stands for “Act” – the ability to quickly and effectively implement the course of action you have decided to pursue.
The core of Boyd’s OODA theory is that if an individual or organization can complete the OODA cycle (sometimes called the OODA loop) more quickly than an adversary or competitor in a dynamically evolving environment, the opposing party will become increasingly confused. As more OODA cycles are completed, the exponential degradation of its understanding of its situation will eventually cause its capacity for effective action to collapse. Of course, the same problem can exist if the environment in which an individual or organization seeks to survive and thrive is changing faster than the time they require to complete their own OODA cycles.
What We Can Learn from History
For centuries, analyses of the causes of national and civilizational decline and collapse have been a staple of historical writing. What follows is a far from exhaustive review of key conclusions reached by a broad sample of authors.
Edward Gibbon wrote his “History of the Decline and Fall of the Roman Empire” between 1776 and 1788, which he mainly attributed to the multiple effects flowing from the decline of traditional values.
Between 1918 and 1922, German historian Oswald Spengler wrote “The Decline of the West”, which identified the gradual corruption of culture as a central driver of long-term decline.
Written between 1934 and 1961, Arnold Toynbee’s “A Study of History” observes that over time societies develop great expertise in problem solving. However, at some point their capacity for solving new problems declines because of constraints imposed on possible solutions by the structures created so solve previous problems.
In “Tragedy and Hope” (1966), Georgetown’s Carroll Quigley identified as a key cause of civilizational decline the transformation of institutions from organizations that solve real social needs to ones that focus on serving their own needs.
Writing in 1978, Sir John Glubb (“The Fate of Empires and Search for Survival”), cited growing decadence as a key cause of empires’ decline. “Decadence is the disintegration of a system, not of its individual members. The habits of the members of the community have been corrupted by the enjoyment of too much money and too much power for too long a period. The result has been, in the framework of their national life, to make them selfish and idle. A community of selfish and idle people declines, internal quarrels develop in the division of its dwindling wealth, and pessimism follows, which some of them endeavour to drown in sensuality or frivolity. In their own surroundings, they are unable to redirect their thoughts and their energies into new channels.”
In “The Rise and Fall of the Great Powers” (1987), Paul Kennedy attributes decline to “imperial overstretch” – the overextension of military and other external commitments relative to the economy’s ability to support them.
Written a year later (1988), in “The Collapse of Complex Societies” Joseph Tainter identifies diminishing returns to increasing complexity as the source of decline and eventual collapse. “As societies become larger, more complex control structures are needed to maintain the cohesion of society and solve the problems that appear along their path. These structures can be described in terms of governments, the nobility, armies, bureaucracy, and the like. As these structures become larger, they become less efficient, to the point that the economic returns they provide are smaller than their cost. At this point, society becomes unable to cope with the challenges it faces and must decline, or even collapse [defined as the sudden loss of complexity].” In 2006, Thomas Homer Dixon synthesized the complex adaptive systems and thermodynamic perspectives in his book “The Upside of Down.”
In 2008, Jared Diamond identified environmental crises as a central cause of decline in his book, “Collapse: How Societies Choose to Fail or Succeed.”
In “Empires on the Edge of Chaos” (2010), Niall Ferguson echoes some of Tainter’s themes, asking, “What if history is not cyclical and slow moving but arrhythmic -- at times almost stationary, but also capable of accelerating suddenly, like a sports car? What if collapse does not arrive over a number of centuries but comes suddenly, like a thief in the night?” Ferguson writes that, “Great powers and empires are, I would suggest, complex systems, made up of a very large number of interacting components that are asymmetrically organized, which means their construction more resembles a termite hill than an Egyptian pyramid. They operate somewhere between order and disorder -- on "the edge of chaos. Such systems can appear to operate quite stably for some time; they seem to be in equilibrium but are, in fact, constantly adapting.”
“But there comes a moment when complex systems "go critical." A very small trigger can set off a "phase transition" from a benign equilibrium to a crisis -- a single grain of sand causes a whole pile to collapse…In reality, the proximate triggers of a crisis are often sufficient to explain the sudden shift from a good equilibrium to a bad mess…Most of the fat-tail phenomena that historians study are not the climaxes of prolonged and deterministic story lines; instead, they represent perturbations, and sometimes the complete breakdowns, of complex systems….Empires exhibit many of the characteristics of other complex adaptive systems -- including the tendency to move from stability to instability quite suddenly. But this fact is rarely recognized because of the collective addiction to cyclical theories of history.”
Another rich source of historical material is the many studies of the rise and fall of various Chinese dynasties. For example, in “New Perspectives on the Collapse and Regeneration of the Han Dynasty”, Kidder et al write that, “Although an environmental disaster [massive flooding] triggered its fall, the Western Han dynasty’s failure has no single cause. The weakening East Asian monsoon resulted in greater aridity with increasing variability in the amplitude and frequency of floods and droughts, while population growth coupled to agricultural and technological intensification led to significantly enlarged demands on natural resources.”
“Assertions of authority by the central government and resistance to these claims by rival elites created domestic political strife at the same time that imperial expansion caused political, military, and economic crises at home and along the frontiers. These factors produced major structural contradictions that the state and society could not absorb. Thus, a complex interplay of climatic, environmental, demographic, and technological factors that accumulated over a long period of time led to a rapid cascade of ruptures in social, political, and economic structures that undermined the Western Han hold on government.”
More broadly, a repeating pattern is often noted in analyses of the rise and fall of Chinese dynasties:
1. A new ruler unites China, founds a new dynasty, and gains the Mandate of Heaven.
2. China, under the new dynasty, achieves prosperity.
3. The population increases.
4. Corruption becomes rampant in the imperial court, and the empire begins to enter decline and instability.
5. A natural disaster wipes out farm land. The disaster normally would not have been a problem; however, together with corruption and overpopulation, it causes famine.
6. The famine causes the population to rebel and a civil war ensues.
7. The ruler loses the Mandate of Heaven.
8. The population decreases because of the violence.
9. China goes through a warring states period.
10. One state emerges victorious.
11. The state starts a new empire.
12. The empire gains the Mandate of Heaven.
Peter Turchin (author of “Cliodynamics: History as Science”, “Historical Dynamics: Why States Rise and Fall”, and “Secular Cycles”) is a leader in the application of artificial intelligence and other advanced quantitative analytical techniques to the study of history, and episodes of decline and collapse. He has concluded that there are recurring “secular cycles” that last two or three centuries. Such cycles “start with a fairly equal society, then, as the population grows, the supply of labour begins to outstrip demand and so becomes cheap. Wealthy elites form, while the living standards of the workers fall. As the society becomes more unequal, the cycle enters a more destructive phase, in which the misery of the lowest strata and infighting between elites contribute to social turbulence and, eventually, collapse.”
Safa Motesharrei is a mathematician at the University of Maryland who has also applied quantitative analytical techniques to the study of collapse. In “Human and Nature Dynamics (HANDY): Modeling Inequality and Use of Resources in the Collapse of Sustainable Societies”, he notes that “there are widespread concerns that current trends in population and resource-use are unsustainable, but the possibilities of an overshoot and collapse remain unclear and controversial. How real is the possibility of a societal collapse? Can complex, advanced civilizations really collapse?”
Like other authors, he provides plenty of evidence that they can. “It is common to portray human history as a relentless and inevitable trend toward greater levels of social complexity, political organization, and economic specialization, with the development of more complex and capable technologies supporting ever-growing population, all sustained by the mobilization of ever-increasing quantities of material, energy, and information. Yet this is not inevitable. In fact, cases where this seemingly near-universal, long-term trend has been severely disrupted by a precipitous collapse – often lasting centuries – have been quite common…The process of rise-and-collapse is actually a recurrent cycle found throughout history, making it important to establish a general explanation of this process” …
“With both natural disasters and external threats, identifying a specific cause compels one to ask, “yes, but why did this particular instance of this factor produce the collapse?” Other processes must be involved, and, in fact, the political, economic, ecological, and technological conditions under which civilizations have collapsed have varied widely. Individual collapses may have involved an array of specific factors, with particular triggers, but a general explanation remains elusive. Individual explanations may seem appropriate in their particular case, but the very universal nature of the phenomenon implies a mechanism that is not specific to a particular time period of human history, nor a particular culture, technology, or natural disaster.”
Motesharrei seeks to identify this mechanism by analyzing collapse mathematically. He finds that he can reproduce the dynamics of many collapses “by simultaneously modeling two separate important features which seem to appear across so many societies that have collapsed: (1) the stretching of resources due to the strain placed on the ecological carrying capacity and (2) the economic stratification of society into rich Elites and poor Masses”.
Ian Morris is a Stanford historian who in 2010 wrote “Why the West Rules – For Now”. Writing in Forbes in 2016 (“The Dawn of a New Dark Age”), He observed that, “in every case where we have enough evidence, we see the same five causal factors, which I like to call the Five Horsemen of the Apocalypse”…
“The first, which is always prominent, is mass migration, on a scale that the societies of the time cannot control. Just how many immigrants it took to destabilize borderlands and spread violence across entire empires must have varied, although DNA seems to suggest that in the wrong circumstances even a group less than one-tenth the size of the host population could bring the roof crashing in…
“The second factor, often coming on the back of the first, is disease. Long-distance mass movements sometimes merged what had previously been separate disease pools, producing new infections to which hardly anyone was immune. Steppe nomads migrating across thousands of kilometers were probably the main vector for the Black Death, which killed perhaps a quarter of the world's population between 1350 and 1400…
“The third force, regularly linked to the first two, is state failure. Collapsing borders and shrinking populations often bring down governments too, and as chaos spreads, even states that have not been directly hit by invasion and plague can be sucked into the whirlpool…
“Fourth, and strongly linked to the first three forces, is the collapse of trade. When failing states can no longer protect merchants, long-distance exchange networks break down, bringing starvation and yet more rounds of migration, disease and violence. Many historians think that the tipping point in the fall of the Roman Empire came when the Vandals invaded North Africa and cut off grain shipments to Italy from what is now Tunisia in 439. The city of Rome lost three-quarters of its population across the next two decades, and in 476 the Western Empire was officially declared defunct.
“The fifth factor, always present but never in a straightforward way, is climate change. Some great collapses, such as that in the Eastern Mediterranean after 1200 B.C., coincide with rising temperatures; others, such as the Roman and Han Chinese breakdowns in the early first millennium, coincide with global cooling. The direction of climate change seems to matter less than the fact that any big change puts stress on farming, which — when everything else is already going wrong — might be enough to push people over the edge.”
Writing in 2016, Marten Scheffera drew on a growing body of research on ecosystem collapse, and focused on the important role that the loss of resilience plays in episodes of societal collapse. Morris’ observations are similar to those made by Marten Scheffera, in “Anticipating Societal Collapse, Hints from the Stone Age”, he notes that “it has become clear over the past years that loss of resilience may be inferred from subtle changes in dynamics in a wide range of complex systems as they approach a tipping point. The underlying generic phenomenon is that recovery from small perturbations becomes slow if resilience becomes small, resulting in elevated temporal autocorrelation (memory) and variance under natural fluctuating conditions…
“One theory is that societies tend to resist change until it is too late for smooth adjustments. Indeed, some fundamental mechanisms that hamper our capacity for change have been well documented. There is the “sunk-cost effect” preventing people from abandoning acquired property (or ways of living or beliefs) even if that would rationally be better. Then there is the “bystander effect,” leading one to copy the behavior of others in case of doubt. This effect is known for explaining why often no-one in a crowd of by-standers comes to the rescue. Finally, elites may have a vested interest in maintaining the status quo, thus delaying societal change. Certainly, such mechanisms are not specific to the Stone Age. Indeed, it may be argued that in more sophisticated societies with more elaborate physical structures and social systems, some of those mechanisms that prevent change might become stronger rather than weaker.”
Finally, in “The Collapse of Civilizations” (2018), Malcolm Wiener found that “major episodes of climate change have had profound impacts upon cultural continuity, and that the interactions between climate change, famines, migrations, pandemics, and major innovations in the means of transport and warfare are critical in understanding the collapse of past civilizations.
Conclusion
The theoretical and historical research we have reviewed highlights the complex root causes of civilizational decline and collapse.
In the final stage, public order, economic growth, energy and food supplies are all often sharply reduced.
Before this point, there is often a precipitating event that triggers this final decline. Such events include severe military defeats, famines, mass migrations, pandemics, and similar large-scale man-made and natural catastrophes.
Yet history is also full of nations and civilizations that did not collapse after these same shocks. What deeper root causes can help explain why failures occurred?
Prominent in both theory and in many historical cases are losses of both resilience and the capacity for adaptation (including large-scale collective action) on many levels, including economic, social, and political.
Yet what caused these losses?
In many historical cases, the loss of resilience was marked by worsening fiscal and monetary conditions, including ballooning government deficits (sometimes caused by Kennedy’s imperial overstretch, and other times by a growing focus on redistribution rather than creation of wealth), weak tax collections, weak economic growth, rising debt levels, and government debasement of the currency.
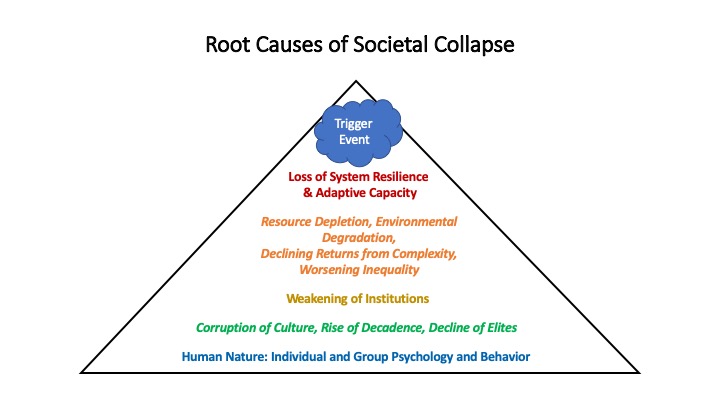
Yet these too are symptoms of even deeper root causes. Depletion of resources and/or environmental degradation is a theme that often comes up in cases studies of decline, whether caused by poor human decisions or natural events. Declining returns from increasing complexity, and rising inequality are other common themes. To some extent, all of these reflect the failure of institutions to address these problems before they emerged as dangerous threats to a society’s survival. But that begs the question of why this happens.
This brings us to an even deeper root cause, which various authors have termed the “decline of values”, “corruption of culture”, “rise of decadence”, and the “decline of elites”. But what causes this?
Perhaps the deepest root causes of civilization collapse lie deep our evolutionary past, and how that has conditioned most of us to think, feel, and behave, both individually and in groups.
As individuals, we are naturally prone to over-optimism and overconfidence. We are poor at using information to update our beliefs, paying more attention to, and better remembering new evidence that confirms them, and doing the opposite to information that does not cohere with them.
As uncertainty increases (as it naturally does with rising complexity), we feel a stronger urge to conform to the views of our group, clan, or tribe, and to copy their beliefs and behaviors.
But as social animals, our most dangerous trait may be our drive for status. Unlike the accumulation of material wealth, the achievement of elite status is a zero-sum game. And once it has been achieved, both individuals and groups are almost always loath to lose it, and will go to great lengths to preserve their high position in the social pecking order (e.g., popularization of the Darwinian concept of meritocracy, that enables elites to see the mass as failures). It isn’t hard to see how this fundamental and very powerful drive to preserve status can undermine the functioning of institutions, and allow the underlying stresses on a society from resource depletion or rising inequality to exponentially increase.
The following graphic summarizes the root causes of collapse:
This analysis raises a painful question: How many of the symptoms of potential civilizational decline and collapse do we see around us today?
Signs of increasing status competition, and increased conflict as groups perceive their social status is a risk?
Elites accused of being decadent and corrupt, out of touch with the masses and apparently unable (or unwilling) to develop solutions to worsening problems facing a society, nation, or even civilization?
Institutions that the masses increasingly see as serving their own and/or elite interests, rather than effectively implementing solutions to problems the masses see as critical?
Rising inequality, resource depletion, and/or environmental degradation?
Weak economic growth, widening gaps between government spending and tax collections, and increasing monetization of a rising issuance of government debt?
Signs that the system is becoming less resilient (e.g., a series of weak recoveries from economic downturns, despite increasingly strong monetary and fiscal stimulus, and a rising number of “deaths of despair”)?
Signs that the system’s capacity for adaptation to challenging circumstances has weakened (e.g., political polarization, policy gridlock, and increasing evidence of poor policy implementation by institutions)?
The good news is that our weakening resilience and adaptive capacity have not yet been tested by severe shocks, such as military defeats, natural disasters, or pandemics (though the Wuhan Coronavirus may soon do this).
The bad news is that too many of the conditions which in the past have enabled a severe shock to trigger a collapse are today either developing or perhaps already in place.
The essential nature of complex adaptive systems is that accurate prediction of their future behavior is either extremely difficult or impossible, depending on how far into the future your forecasting horizon extends. The best we can do is develop a “coarse grained” sense of their underlying dynamics, and the range of outcomes they could produce.
Our civilization is not yet doomed to collapse. But there are a growing number of reasons to fear where current trends are heading if it they do not change.
High Value Information Observed In January 2020
In our model of the complex global macro system, change drivers are arrayed across a roughly chronological process (albeit one with many feedback loops), in which technological and environmental changes precede changes in the economy and national security, which in turn lead to changes in society and politics, all of which produce the effects we observe in investor behavior and financial market valuations and returns.
In our methodology, we classify new information as significant and highly valuable if either it (1) is an “indicator”, which reduces our uncertainty about the value of a parameter in our mental model for making sense of the dynamic macro system, or (2) it is a “surprise” which increases our uncertainty about either the range of potential values for a parameter or the structure of our model. With respect to indicators, the higher our priori probability is for a regime, the more we look for indicators that it will not occur, and the lower our prior probability for a regime, the more we look for indicators that it will occur. Put differently, we tend to look for high value indicators that disconfirm our prior views.
| New Technology Information: Indicators and Surprises | Why Is This Information Valuable? |
| “Researchers: Are we on the cusp of an AI winter?”, by Sam Shead in Technology Review | “Hype surrounding AI has peaked and troughed over the years as the abilities of the technology get overestimated and then re-evaluated… “The peaks are known as AI summers, and the troughs AI winters. The 2010s were arguably the hottest AI summer on record with tech giants repeatedly touting AI’s abilities…There are signs, however, that the hype might be about to start cooling off…At the end of 2019, the smartest computers could still only excel at a "narrow" selection of tasks… “Gary Marcus, an AI researcher at New York University, said: ‘By the end of the decade there was a growing realisation that current techniques can only carry us so far.’ He thinks the industry needs some "real innovation" to go further… “Another researcher noted that, ‘One of the biggest challenges is to develop methods that are much more efficient in terms of the data and compute power required to learn to solve a problem well. In the past decade, we've seen impressive advances made by increasing the scale of data and computation available, but that's not appropriate or scalable for every problem. ‘If we want to scale to more complex behaviour, we need to do better with less data, and we need to generalise more.’" |
| “The Unavoidable” by Eric Hanushek from Stanford (in our experience, one of the most astute observers of the true state of K12 education in the United States) | Few people appreciate the size of the negative second and third order effects that will result from the cumulative impact of an education system that is improving slowly, if at all, while labor replacing automation and artificial intelligence technologies continue to exponentially improve. As Hanushek writes, “education strongly affects the future economic returns that individuals see. It also dictates where the US economy will go in the future. Unfortunately, students in the United States are not competitive with students from much of the developed world… “The results of the 2019 National Assessment of Educational Progress (NAEP) underscore the serious (and frustrating) achievement problems facing the United States. They represent real problems that affect not only the children of this generation but also the future economies of all states. “These are not problems that can be put off. The burden on the United States will increase over time, any solutions will necessarily take time, and delay will exacerbate the problems…Not dealing effectively with these problems will cause increasing economic displacement as new technologies continue to replace workers with automation”. |
| “The Impact of Artificial Intelligence on the Labor Market”, by Michael Webb | SUPRRISE “Artificial intelligence, or machine learning, refers to algorithms that learn to complete tasks by identifying statistical patterns in data, rather than following instructions provided by humans…At a time when rising inequality is a major social and political issue, it is unclear whether AI will increase inequality by, say, further displacing production workers, or reduce it by displacing doctors and lawyers.” The author “develops a new method for identifying which tasks can be automated by any particular technology…based on the following key idea. The text of patents contains information about what technologies do, and the text of job descriptions contains information about the tasks people do in their jobs. "These two text corpuses can be combined to quantify how much patenting in a particular technology has been directed at the tasks of any particular occupation. This is therefore a measure of the tasks from which labor may be displaced”… “Patents describe artificial intelligence performing tasks such as predicting prognosis and treatment, detecting cancer, identifying damage, and detecting fraud. These are tasks involved in medical imaging and treatment, insurance adjusting, and fraud analysis, all areas that are currently seeing high levels of AI research and development. “Notice that these activities are of a very different kind to those identified for robots and software. Whereas robots perform “muscle” tasks and software performs routine information processing, AI performs tasks that involve detecting patterns, making judgments, and optimization… Webb finds that, “high-skill occupations are most exposed to AI, with exposure peaking at about the ninetieth percentile. While individuals with low levels of education are somewhat exposed to AI, it is those with college degrees, including Master’s degrees, who are most exposed. Moreover, as might be expected from the fact that AI-exposed jobs are predominantly those involving high levels of education and accumulated experience, it is older workers who are most exposed to AI, with younger workers much less so… “These descriptive results clearly indicate that AI will affect very different occupations, and so different kinds of people, than software and robots.” |
| “Extending the Race Between Education and Technology”, by Autor et al | Two phenomena are affecting relative wages in the United States. The first is the “race between education and technology” – can the US education system provide enough skilled graduates (and reskilled workers) to either stave off automation and/or to fill the new jobs exponentially improving technology will create, which have significantly different skill requirements? The authors note that, “the race between education and technology [RBET] provides a canonical framework that does an excellent job of explaining US wage structure changes across the twentieth century. The framework involves secular increases in the demand for more-educated workers from skill-biased technological change, combined with variations in the supply of skills from changes in educational access… “Increased educational wage differentials explain 75 percent of the rise of U.S. wage inequality from 1980 to 2000 as compared to 38 percent for 2000 to 2017… “A great economic divide has emerged between college-educated workers and those with less than a college degree. Ever since 1980, educational wage differentials have greatly expanded, and soaring income inequality has deeply marked the US economy… “Educational wage gains and overall wage and income inequality have closely followed changes in educational attainment against a backdrop of increased relative demand for more-educated workers from skill-biased technological change (SBTC). The implicit framework is one of a race between education and technology (RBET)… The idea is that there is secular growth in the demand for more-educated workers from SBTC at the same time there is rapid, but variable, growth of the relative supply of more-educated workers [and the relative capabilities of potentially labor displacing technology]… From 1980 to 2005, a slowdown in relative education supply growth contributed to a soaring college wage premium. That’s the saga of educational wage differentials from the 1890s to 2005… [However], “most of the recent rise in wage inequality has occurred within, rather than between, education groups. In fact, the largest part of increased wage variance in the twenty-first century comes from rising inequality among college graduates. There is almost no change in wage inequality for non-college workers since 2000. Such a pattern is consistent with the continuing, rapid rise of the 90-50 [percentile] wage differential and soaring top end inequality, combined with stability in the 50-10 wage differential in the 2000s. “Comprehending rising wage inequality in the 2000s requires a better understanding of growing wage inequality among college graduates, the rise in the return to post-BA education, and stagnant earnings of middle-wage workers (the upper half of non-college and lower half of college workers). The RBET framework remains relevant in the twenty-first century, but needs some tweaks.” |
| “Artificial Intelligence and the Manufacturing of Reality” by Paul and Posard from RAND | “In 2016, a third of surveyed Americans told researchers they believed the government was concealing what they knew about the “North Dakota Crash,” a conspiracy made up for the purposes of the survey by the researchers themselves. This crash never happened, but it highlights the flaws humans carry with them in deciding what is or is not real. “The internet and other technologies have made it easier to weaponize and exploit these flaws, beguiling more people faster and more compellingly than ever before. It is likely artificial intelligence will be used to exploit the weaknesses inherent in human nature at a scale, speed, and level of effectiveness previously unseen. “Adversaries like Russia could pursue goals for using these manipulations to subtly reshape how targets view the world around them, effectively manufacturing their reality. If even some of our predictions are accurate, all governance reliant on public opinion, mass perception, or citizen participation is at risk… “One characteristic human foible is how easily we can falsely redefine what we experience. This flaw, called the ‘Thomas Theorem’, suggests, ‘If men define situations as real, they are real in their consequences.’ Put another way, humans not only respond to the objective features of their situations but also to their own subjective interpretations of those situations, even when these beliefs are factually wrong. “Other shortcomings include our willingness to believe information that is not true and a propensity to be as easily influenced by emotional appeals as reason, as demonstrated by the ‘North Dakota Crash’ falsehood. “Machines can also be taught to exploit these flaws more effectively than humans: Artificial intelligence algorithms can test what content works and what does not over and over again on millions of people at high speed, until their targets react as desired… “Defending against such massive manipulation will be particularly tricky given the current social media landscape, which allows for the easy multiplication of inauthentic individuals, personas, and accounts through the use of bots or other forms of automation.” |
| | |
| | |
| | |
| | |
| | |
| | |
| | |
| | |
| New Energy and Environment Information: Indicators and Surprises | Why Is This Information Valuable? |
| “Climate Risk and Response”, by the McKinsey Global Institute | SURPRISE This analysis focuses “on understanding the nature and extent of physical risk from a changing climate over the next three decades, exploring physical risk as it is the basis of both transition and liability risks. McKinsey “estimates inherent physical risk, absent adaptation and mitigation, to dimension the magnitude of the challenge… “The socioeconomic impacts of climate change will likely be nonlinear as system thresholds are breached and have knock-on effects. Most of the past increase in direct impact from hazards has come from greater exposure to hazards versus increases in their mean and tail intensity. In the future, hazard intensification will likely assume a greater role… “Financial markets could bring forward risk recognition in affected regions, with consequences for capital allocation and insurance. Greater understanding of climate risk could make long-duration borrowing unavailable, impact insurance cost and availability, and reduce terminal values. This could trigger capital reallocation and asset repricing… “Financial markets could bring forward risk recognition in affected regions, with consequences for capital allocation and insurance. Greater understanding of climate risk could make long-duration borrowing unavailable, impact insurance cost and availability, and reduce terminal values. This could trigger capital reallocation and asset repricing… “Our research suggests an increase in global agricultural yield volatility that skews toward worse outcomes. For example, by 2050, the annual probability of a greater than 10 percent reduction in yields for wheat, corn, soy, and rice in a given year is projected to increase from 6 to 18 percent. The annual probability of a greater than 10 percent increase in yield in a given year is expected to rise from 1 percent to 6 percent. “These trends are not uniform across countries and, importantly, some could see improved agricultural yields, while others could suffer negative impacts. For example, the average breadbasket region of Europe and Russia is expected to experience a 4 percent increase in average yields by 2050”. |
| “Offshore forecast fears blow through European wind farms”, by Nathalie Thomas in the FT 5Jan20 | SURPRISE “Two wind effects are known as ‘wake’ and ‘blockage’. The wake effect describes how wind slows after hitting a turbine, affecting those situated further downstream. Blockage is where wind slows down as it approaches a turbine… ‘Both effects have long been recognised by the renewables industry their scope and complexity have been underestimated. “It has long been understood that there is an “individual” blockage effect for every single turbine but researchers have now identified a “global” blockage effect that is greater than the sum of the individual effects. “This arises from individual turbine losses also affecting neighbouring turbines…As more offshore wind farms are built, there could be higher wake effects from neighbouring wind farms.” |
| “Macro Financial Aspects of Climate Change”, by Feyen et al from the World Bank | SURPRISE This paper examines the interaction between macro-financial and climate-related risks. It brings together different strands of the literature on climate-related risks and how these relate to macro-financial management and risks. “Physical impacts of climate change as well as the transition toward a resilient low-carbon economy pose significant challenges for macro-financial management, as they can damage the balance sheets of governments, households, firms, and financial institutions due to the adverse and possibly abrupt impacts on investment and economic growth, fiscal revenue and expenditure, debt sustainability, and the valuation of financial assets. “In turn, macro-financial risks translate into weakened resilience to physical climate risks and constrained capacity for climate adaptation and mitigation efforts. The paper finds that many countries face the “double jeopardy” of simultaneous elevated climate-related and macro-financial risks.” |
| “How Populism Will Heat Up the Climate Fight”, by Philip Stephens in the 22Jan20 FT | SURPRISE “The success of the populist movements that have destabilised Europe’s ancien regimes is rooted in a perception, more than half-true, that those near the bottom of the pile were burdened with bailing out the elites responsible for the financial crisis. The left-behinds rather than the bankers bore the brunt of austerity. Now think about cutting carbon emissions. The same group — low earners living in provincial towns and villages — are first in the line of fire”. |
| “China, Not America, Will Decide the Fate of the Planet”, by Gideon Rachan in the 27Jan20 FT | “If you look at the numbers — as opposed to the theatre — it becomes clear that the battle to control climate change now depends much more on what happens in China than in America. According to the Union of Concerned Scientists, China now accounts for 29 per cent of global carbon dioxide emissions generation — compared with 16 per cent for the US, about 10 per cent for the EU and 7 per cent for India… "The bad news for the planet is that the continued growth of the Chinese and Indian middle classes will increase demands for cars, electricity, meat and foreign travel, all of which will generate more greenhouse gases…China’s coal addiction and authoritarian system mean that it will struggle to provide a global lead on the climate.” |
| “Japan Races to Build New Coal-Burning Power Plants, Despite the Climate Risks”, New York Times 3Feb20 | SUPRRISE “It is one unintended consequence of the Fukushima nuclear disaster almost a decade ago, which forced Japan to all but close its nuclear power program. Japan now plans to build as many as 22 new coal-burning power plants — one of the dirtiest sources of electricity — at 17 different sites in the next five years, just at a time when the world needs to slash carbon dioxide emissions to fight global warming… Together the 22 power plants would emit almost as much carbon dioxide annually as all the passenger cars sold each year in the United States.” |
| “Modeling migration patterns in the USA under sea level rise”, by Robinson et al | “Sea level rise in the United States will lead to large scale migration in the future…The effects of sea level rise are pervasive, expanding beyond coastal areas via increased migration, and disproportionately affecting some areas of the United States… “In the United States alone, 123.3 million people, or 39% of the total population, lived in coastal counties in 2010, with a predicted 8% increase by the year 2020 [By the year 2100, a projected 13.1 million people in the United States alone would be living on land that will be considered flooded with a SLR of 6 feet (1.8 m).” |
| | |
| | |
| | |
| | |
| | |
| | |
| New Economic Information: Indicators and Surprises | Why Is This Information Valuable? |
| “The Budget and Economic Outlook: 2020 to 2030” by the Congressional Budget Office | This latest report forecasts continuing large deficit and a sharp rise in the ratio of outstanding US Government debt to GDP. If aggregated demand growth remains weak, it is almost certain that a substantial portion of newly issued debt will be monetized by the Federal Reserve. A critical uncertainty is whether this can be done without triggering increased inflation. The case of Japan provides evidence that this is possible when underlying deflationary forces are strong. However, whether this would be possible in the case of the world’s dominant reserve currency remains to be seen, particularly if there is no demonstrable progress on critical issues like low productivity growth. “In CBO’s projections, the federal budget deficit is $1.0 trillion in 2020 and averages $1.3 trillion between 2021 and 2030. Projected deficits rise from 4.6 percent of gross domestic product (GDP) in 2020 to 5.4 percent in 2030.” “Other than a six-year period during and immediately after World War II, the deficit over the past century has not exceeded 4.0 percent for more than five consecutive years. And during the past 50 years, deficits have averaged 1.5 percent of GDP when the economy was relatively strong (as it is now).” “Because of the large deficits, federal debt held by the public is projected to grow, from 81 percent of GDP in 2020 to 98 percent in 2030 (its highest percentage since 1946). By 2050, debt would be 180 percent of GDP—far higher than it has ever been.” |
| “Capital Composition and Declining Labor Share” by Eden and Gaggl | SURPRISE In a 2019 paper, “How the Wealth Was Won: Factor Shares as Market Fundamentals”, Greenwald et al observed that, “From the beginning of 1989 to the end of 2017, 23 trillion dollars of real equity wealth was created by the non-financial corporate sector. We estimate that 54% of this increase was attributable to a reallocation of [profits from labor compensation to] shareholders in a decelerating economy. Economic growth accounts for just 24%, followed by lower interest rates (11%) and a lower risk premium (11%). From 1952 to 1988 less than half as much wealth was created, but economic growth accounted for 92% of it.” The critical question is what drove this reallocation of economic profits from labor to capital. In “Capital Composition and Declining Labor Share”, Eden and Gaggl find that, “Though information and communications (ICT) capital is a small fraction of the capital stock, it is highly substitutable with labor, and its user cost declined sharply over the last few decades. A framework that distinguishes between ICT and non-ICT capital is empirically plausible and suggests that automation accounts for more than one quarter of the global decline in the labor share…In the United States it accounts for 40 percent.” |
| “Unpacking Skill Bias: Automation and New Tasks”, by Acemoglu and Restrepo | SURPRISE The authors find that “automation: (i) powerfully impacts inequality; (ii) can reduce real wages; and (iii) can generate realistic changes in inequality with small changes in productivity.” They also note that, “New tasks, on the other hand, can increase or reduce inequality depending on whether it is skilled or unskilled workers that have a comparative advantage in these new activities. Using industry-level estimates of displacement driven by automation and reinstatement [into the workforce] due to new tasks.” The authors “show that displacement is associated with significant increases in industry demand for skills both before 1987 and after 1987, while reinstatement reduced the demand for skills before 1987, but generated higher demand for skills after 1987. The combined effects of displacement and reinstatement after 1987 explain a significant part of the shift towards greater demand for skills in the US economy”. In sum, “a primary reason for the increase in the skill premium (and the decline in the real wages of less skilled workers) has been rapid automation that has replaced tasks previously performed by less skilled workers”. |
| “Competing with Robots: Firm-Level Evidence from France”, by Acemoglu et al | SUPRRISE “Consistent with theory, robot adopters experience significant declines in labor share and the share of production workers in employment, and increases in value added and productivity. “They expand their overall employment as well. However, this expansion comes at the expense of their competitors (as automation reduces their relative costs)...” “The overall impact of robot adoption on industry employment is negative…the impact of robots on overall labor share is greater than their firm-level effects because robot adopters are larger and grow faster than their competitors”. |
| “Cyber Risk and the U.S. Financial System: A Pre-Mortem Analysis”, by Eisenbach et al from the Federal Reserve Bank of New York | SURPRISE “Our analysis demonstrates how cyber attacks on a single large bank, a group of smaller banks or a common service provider can be transmitted through the payments system… "A cyber attack on any of the most active U.S. banks that impairs any of those banks’ ability to send payments would likely be amplified to affect the liquidity of many other banks in the system. The extent of the amplification would be even greater if banks respond strategically, which they are likely to do if there is uncertainty about the attack... “The impact on geographies with concentrated banks may be even larger…[There are also] other ways that the system may become impaired that highlight the importance of all banks in the network, not just the largest banks. “First, if a number of small or midsize banks are connected through a shared vulnerability, such as a significant service provider, this would likely result in the transmission of a shock throughout the network. Similarly, banks with a relatively small amount of assets but large payment flows also have the potential to impair the system… “While the shock we assume is extreme in some ways — a complete inability to send payments—it is conservative in others. We currently do not model spillovers outside the payment network such as to short term creditors that provide liquidity to impaired banks… We also focus primarily on the impact that a cyber attack may have within a single day. However, if a cyber attack were to compromise the integrity of banks’ systems, the reconciliation and recuperation process would be an unprecedented task. This could have severe implications on the stability of the broader financial system vis-à-vis spillovers to investors, creditors, and other financial market participants.” |
| “Systemic Risk in the Broad Economy”, by Welburn et al from RAND And “Skewed Business Cycles” by Salgado et al | SURPRISE “In the years since 2008, “The ability of small, seemingly isolated risks to grow and spread across heavily interconnected systems—a problem summarized by the term systemic risk—has emerged as a central focus for research and policy change.” … “However, despite the increased attention on systemic risks, surprisingly little attention has spilled over beyond financial networks into systemic risks in the broad economy.” The authors document “a sparse network of supplier-customer linkages with a dense center composed of heavily interconnected firms with numerous customer and supplier linkages. Using network analysis, [they] explore the distribution of interconnectivity across firms, finding that of the most heavily interconnected firms, many of the most heavily interconnected firms come from several different sectors of the economy. In particular, in addition to financial sector firms, [they find] many firms in technology and telecommunications with high levels of interconnectivity in observed firm networks.” They then use their network model to “estimate the potential aggregate impact of an isolated shock on each individual firm, exploring the systemic risk of individual firms”… They conclude that, “growth in the technology sector over the past decade has contributed to new forms of systemic risk. No firm epitomizes the shift in systemic risk more than Amazon and its increasingly widespread cloud computing service, Amazon Web Services (AWS), a point illustrated through the efforts of this report. Amazon’s centrality in traditional production networks was just emerging at the time of the 2008 crisis. Now, its centrality in digital networks underpinning diverse firms and even public institutions provides an example of the potential of systemic risk in the broad economy… More broadly, “the majority of the most-central firms [in the network] lie outside the financial sector (the traditional focus of systemic risk conversations), and they vary across diverse business sectors…firms posing systemic risk have more heterogeneity than the focus on financial firms has led many to believe. Instead, many of the most central firms—and thereby firms posing the risk of largest aggregate losses following an idiosyncratic shock—are of varying sizes and in varying industries.” In “Skewed Business Cycles”, Salgado et al describe how these negative network effects and cascades can be triggered. A small number of firms represent a disproportionate number of the losses incurred during a recession. which they describe as a drop in the “skewness” (asymmetry) with an important number of firms experiencing substantial declines in sales, hiring, and productivity — i.e., an increase in the risk of a disaster at the firm level. During economic downturns, “a subset of firms does extremely badly, leading to a left tail of large negative outcomes.” |
| “Why is the Euro Punching Well Below Its Weight?” By Ilzetski, Reinhart, and Rogoff | “On the twentieth anniversary of its inception, the euro has yet to expand its role as an international currency…By some measures, it plays no larger a role than the Deutschemark and French franc that it replaced… A number of factors have limited the euro’s reach, including lack of financial center, limited geopolitical reach, and US and Chinese dominance in technology research. Most important, in our view, is the comparatively scarce supply of (safe) euro-denominated assets. The European Central Bank’ lack of policy clarity may have also played a role.” |
| “What if the economists are all wrong on productivity?” By Glenn Hutchins, Financial Times 28Jan20 | SURPRISE “There has been considerable hand-wringing about why productivity growth is anaemic and inflation is stubbornly low. This is important because productivity gains, which allow an economy to grow faster than its population, determine increases in national wealth… “There is today a ‘dialogue of the deaf’ between Silicon Valley and the economics profession… Economists point to longitudinal data that shows productivity has been rising at a lethargic pace and say it shows the lack of true technology breakthroughs such as flying cars…. "But the tech industry looks at a world economy that is rapidly transforming from industrial to digital and argues that the changes must be causing productivity to hurtle forward at warp speed, creating widespread financial benefits. Tech leaders also point out that they are on a mission to eradicate costs from everything, everywhere… "Techies believe we live in an economy with rapid productivity growth, burgeoning output and relentless price drops… "With that in mind, let’s go back to the question of why the global economy proved allergic to a modest tightening of interest rates. If the traditional economists are right, and real interest rates (actual levels minus inflation) are in fact hovering near zero, history would suggest that rates could have increased materially without a hitch. “Now consider the view of the techies that we do not live in an economy characterised by little productivity growth, low inflation and modest increases in gross domestic product. What if they are right?... “If actual deflation was running at around 2 per cent today, real interest rates would be roughly equal to historic levels and the stubborn resistance of economic activity to increases would be unsurprising. Does this alternative view fit reality better? … That suggests that the negative nominal rates now common in much of the world may be normal and could be with us for a long time.” |
| | |
| | |
| | |
| | |
| New National Security Information: Indicators and Surprises | Why Is This Information Valuable? |
| “Deterrence in the Age of Thinking Machines”, by Wong et al from RAND | SURPRISE The authors, “present a wargame in which several countries with AI and advanced autonomous systems confronted one another, AND offer potential implications that these technologies have for deterrence and escalation… “The wargame began with China attempting to exert greater control in the region and the United States and Japan resisting this attempt. The game escalated at several points, first into conflict between unmanned systems, then eventually into one in which Chinese and U.S. military personnel were killed. There was both intentional and inadvertent escalation… “The game ended with the crisis still escalating… Although this was only a single wargame, there were several interesting, initial insights: Manned systems may be better for deterrence than unmanned ones. Replacing manned systems with unmanned ones might not be seen as a reduced security commitment. "Players put their systems on different autonomous settings to signal resolve and commitment during the conflict. Deliberately taking actions and decisions out of human hands and going to “full auto” emerged as a way to show that players were willing to use force. "The speed of autonomous systems led to inadvertent escalation in the wargame. Setting forces on “full auto” to signal resolve did in one case lead to inadvertent escalation. Systems set to autonomous mode reacted with force to an unanticipated situation in which the humans did not intend to use force.” |
| “The Drone Beats Of War: The U.S. Vulnerability To Targeted Killings”, by Barno and Bensahel | SURPRISE “The fiery explosions from the recent U.S. drone attack that killed Iranian general Qassem Soleimani have sent shock waves reverberating across the Middle East. Those same shocks should now be rippling through the American national security establishment too. The strike against the man widely considered the second-most powerful leader of a long-standing U.S. adversary was unprecedented, and its ultimate effects remain unknown”. “But regardless of what happens next, one thing is certain: The United States has now made it even more likely that American military and civilian leaders will be targeted by future U.S. foes” |
| “The AI Literacy Gap Hobbling American Officialdom” by Horowitz and Kahn on Warontherocks.com 14Jan20 | SURPRISE “Rarely is there as much agreement about the importance of an emerging technology as exists today about artificial intelligence (AI)… Because AI is a general-purpose technology, the corresponding adoption challenges may prove especially difficult. There is a great deal of emphasis at present on how the United States can more effectively recruit and retain AI talent to work for the national security community and the government as a whole. This is critical, but the people making decisions about the use of algorithms from the situation room to the battlefield will not necessarily be informed about current developments in AI, let alone be AI experts, but military leaders and policymakers. “Thus, a vital challenge is familiarizing and educating government leaders and policymakers about AI. This is a different challenge than that of incentivizing those with AI expertise to work for the U.S. government. Instead, it is about AI education for the policy community… Top policymakers — who are generally not technically trained — are at an increasing risk of being “black boxed” as technological complexity increases. “This is especially true given questions even at the vanguard of AI research about the “explainability” of algorithms… Without baseline knowledge, policymakers won’t know what questions to ask, will be unable to frame what issues they are trying to solve as an “AI problem,” and might be overconfident in their understanding of AI and therefore what is feasible or practical.” |
| “The Department of Defense Posture for Artificial Intelligence” by RAND | SURPRISE This report was mandated by the US Congress as part of the 2019 National Defense Authorization Act. Among its Key Findings: “DoD AI strategy lacks baselines and metrics to meaningfully assess progress toward its vision.” “DoD failed to provide the new Joint Artificial Intelligence Center with visibility, authorities, and resource commitments, making it exceedingly difficult for the JAIC to succeed in its assigned mandate.” “The current state of AI Verification, Validation, Testing, and Evaluation (VVT&E) is nowhere close to ensuring the performance and safety of AI applications, particularly where safety-critical systems are concerned.” “DoD lacks clear mechanisms for growing, tracking, and cultivating AI talent, even as it faces a very tight AI job market.” |
| “Taking Back the Seas” by Clark and Walton from the Center for Strategic and Budgetary Assessments | “Naval surface warfare is undergoing a period of rapid technological and operational change. During the nearly 30 years since the end of the Cold War, navies encountered relatively permissive environments, and the threats they did face could largely be defeated by improved defensive systems. A new generation of challenges has emerged, however, including ubiquitous passive sensors, quiet submarines, supersonic and hypersonic anti-ship missiles (ASM), “smart” mines, and the increasing use of paramilitary forces in naval operations. As a result, many fleets are revising their concepts and capabilities for traditional surface missions such as air defense, anti-submarine warfare (ASW), maritime and land strike, and mine warfare (MIW)”… “The U.S. Navy has been slow to address the changing threat environment. As a result, today’s surface force lacks the size, resilience, and offensive capacity to effectively support the U.S. National Defense Strategy’s approach of deterring aggression by degrading, delaying, or defeating enemy attacks. The surface fleet is weighted toward large combatants that are too expensive and manpower-intensive to achieve the numbers needed for distributed operations. They also rely on sensors that will likely be unavailable or create unacceptable vulnerabilities during combat against a great power like China. Perhaps of most concern is the fact that the current fleet is fiscally unsustainable due to the escalating costs to crew, operate, and maintain today’s highly integrated manned surface combatants… “The surface fleet’s shortfalls are especially problematic because the role of surface forces in Navy offensive operations will likely expand over the next few decades.” |
| “China bond investors battle to claim cash after defaults”, FT 9Jan20 | “Bond defaults across the world’s second-biggest economy are rising, with more borrowers failing either to repay creditors’ initial investments, or make regular interest payments… “In 2016, 46 per cent of borrowers in default made some sort of principal or interest payments to bondholders, according to Wind, a financial information provider. Last year, that total dropped to 13 per cent”… “China has laws to protect investors when borrowers fail to repay, but enforcement is patchy. Communist party-controlled courts often rule in favour of defaulters that play a major role in the local economy, rather than backing investors who are owed money.” |
| Tsai Ing-wen was reelected President of Taiwan “China’s dream of using Hong Kong as model for Taiwan’s future is dead”, by Jamil Anderlini, FT 11Jan20 | As the FT notes, “Almost as soon as Hong Kong’s massive pro-democracy protests erupted into violent confrontations between demonstrators and police in June, Ms Tsai began to rise in the polls”... The FT concludes, “It is clear the Communist party’s dream of using the former British colony as a model for Taiwan’s political future is now completely dead. But that raises the question of whether Beijing would at some point try to take the island by force, something it has vowed to do if ‘necessary’… "There is no doubt Ms Tsai’s landslide is a victory for the forces of liberal democracy. But it has probably also made the region just a bit more dangerous." |
| “India’s Economy Faces Severe Challenges”, by Arvind Subramanian, FT 14Jan20 | “For several years, analysts and organisations such as the IMF and World Bank have touted India as the fastest-growing major economy, with the world’s brightest medium-term outlook. But in December the Reserve Bank of India, the central bank, cut its forecast for 2019 growth in gross domestic product to 5 per cent. “That headline figure actually understates the slowdown. High-frequency indicators show that in the first eight months of the current fiscal year, non-oil exports and imports have fallen, as has production of investment goods. Production of consumer goods and real government tax receipts have both grown by only 1 per cent. And a savage credit crunch has reduced commercial lending to less than Rs1tn in the first six months of this fiscal year, one-seventh its level the previous year.” |
| | |
| | |
| | |
| | |
| | |
| | |
| New Health and Disease Information: Indicators and Surprises | Why Is This Information Valuable? |
| January saw the widespread outbreak of a new variant of the coronavirus in China, spreading from its epicenter in Wuhan. | SUPRRISE There are two critical uncertainties to resolve with more evidence: (1) the transmissibility of the Wuhan strain, which so far appears to be high, and (2) the pathogenicity (CFR), which at this point still appears to be relatively low. And when you hear an estimated CFR, always remember to check the denominator on which it is based (lab confirmed or just symptomatic cases). When it comes to contagious viral diseases, there is usually a tradeoff between their transmissibility (how easily they spread) and their pathogenicity (how many people who become infected die). Viruses that quickly kill their infected hosts effectively limit their own spread. The number of infected people who die is measured by the "Case Fatality Rate." However, this is a noisy estimate, because the denominator can be based on lab confirmed cases (which increases CFR) or just symptomatic cases (which lowers estimated CFR). Early estimates (based on very noisy reporting) have reported a preliminary CFR for the Wuhan strain of around 2%. However, this will likely change as more evidence becomes available. To put Wuhan in perspective, the CFRs for Ebola and highly pathogenic H5N1 influenza are >60%. The 1918 pandemic flu was estimated at 10% to 20% (this strain was also relatively transmissible which is why it killed so many). The 2009 H1N1 "swine" flu CFR was estimated at 5% to 9%. By comparison, typical seasonal influenza has a CFR of one tenth of one percent or less (0.1%). For other coronaviruses, SARS' CFR was estimated to be around 10%, while MERS' was 35%. Transimissibility is measured using the “Basic Reproduction Number” (known as “R0” or “R-naught”), which is the number of people who will become infected by contact with one contagious person. If R is less than one (e.g., because of a high CFR), an epidemic will quickly “burn itself out”. In contrast, when R is greater than 1, a virus will spread exponentially. Initial estimates of R for the Wuhan Novel Coronavirus are very noisy at this point. The World Health Organization has published a range of 1.4 to 2.5 For comparison, here are some historic estimated Basic Reproduction Numbers: 1918 Spanish Flu = 2.3 to 3.4 (95% confidence interval) SARS Coronavirus = 1.9 1968 Flu = 1.80 2009 Swine Flu = 1.46 Seasonal Influenza = 1.28 MERS Coronavirus = <1.0 Highly Pathogenic H5N1 Influenza = .90 Ebola = .70 |
| The most concerning finding about the Wuhan Coronavirus are claims that it may be capable of infecting other people before a patient becomes symptomatic (i.e., shows signs that he/she has contracted the virus). | SURPRISE An article in the Lancet (“Nowcasting and Forecasting the Potential Domestic and International Spread of the 2019-nCoV Outbreak Originating in Wuhan, China”) found that, “Independent self-sustaining outbreaks in major cities globally could become inevitable because of substantial exportation of presymptomatic cases & the absence of large-scale public health interventions." If it is supported by subsequent research, this initial finding will almost certainly lead to the imposition of more travel bans and quarantine measures in an attempt to limit transmission of the virus. |
| The Wuhan coronavirus will almost certainly depress global economic growth, but by an amount that is highly uncertain at this point. | SURPRISE Global aggregate demand has already been weakening. A worsening slowdown (or growth turning negative) will very likely be reinforced by mounting debt servicing problems in our highly leveraged global economy. |
| Politically, failure to control the coronavirus could have substantial and highly uncertain effects in China, including, in one scenario, Xi Jinping’s loss of power. | SUPRRISE In “Xi Jinping Faces China’s Chernobyl Moment "(FT, 10Jan20), Jamil Anderlini writes that, “Throughout Chinese history, the reign of an imperial line was believed to follow a pattern known as the dynastic cycle. A strong, unifying leader establishes an empire that would rise, flourish but eventually decline, lose the “mandate of heaven” and be overthrown by the next dynasty... “Similar to Europe’s “divine right of kings”, the mandate of heaven differed in that it did not unconditionally entitle an emperor to rule the Celestial Empire. While on the dragon throne, the “son of heaven” had total power over his subjects. "But he did not have to be of noble birth and he could lose his heavenly mandate for being unworthy, unjust or plain incompetent. The right of the populace to rebel was implicitly guaranteed if the heavens were seen to be displeased. Natural disasters, famine, plague, invasion and even armed rebellion were all regarded as signs the mandate of heaven had been withdrawn”… “The fact that China’s authoritarian system is particularly poor at dealing with public health emergencies that require timely, transparent and accurate information makes this far more significant than any other challenge Mr Xi has faced so far… “Outspoken academics and intellectuals have braved imprisonment to lambast the Communist party’s failure of performance legitimacy. Some have explicitly referred to the mandate of heaven and pointed to numerous examples of late-stage dynastic decay. "But the defining moment of this crisis — the moment when it went from being a serious challenge to a potentially existential problem for the party — was the death last Thursday of a 33-year-old Wuhan ophthalmologist called Li Wenliang. “In the early days of the crisis, Dr Li had raised the alarm in online chat groups with his medical school classmates after witnessing numerous cases of a strange new pneumonia that did not respond to normal treatment. For that he was reprimanded by his hospital and summoned in the middle of the night by the police, who forced him and at least seven other doctors to sign confessions and pledges to cease spreading “rumours”. “When Dr. Li contracted the disease himself, ordinary Chinese were outraged. Even the Supreme People’s Court in Beijing reprimanded the police and praised the doctors who first raised the alarm. But when Dr Li died on Friday the response was volcanic… “Dr. Li’s story is so powerful in part because it fits neatly into another ancient archetype in Chinese history. The incorruptible Confucian scholar who speaks truth to the emperor but is persecuted, and ultimately dies for his honesty, holds a special place in China’s scholarly tradition. Dr. Li fits the role perfectly. |
| “Global, regional, and national sepsis incidence and mortality, 1990–2017: Analysis for the Global Burden of Disease Study”, by Rudd et al | SURPRISE While the world focused on Wuhan, another very significant study was published, which found that deaths from sepsis infections are twice as high as previous estimates. “In 2017, an estimated 48·9 million (95% uncertainty interval 38·9–62·9) incident cases of sepsis were recorded worldwide and 11·0 million (10·1–12·0) sepsis-related deaths were reported, representing 19·7% (18·2–21·4) of all global deaths.” By comparison, the World Health Organization estimates that 9.6 million people around the world die each year from various cancers. |
| | |
| New Social Information: Indicators and Surprises | Why Is This Information Valuable? |
| “Beware of Tech Bubbles: Long-Term Earnings of the Dot-Com Bubble Generation”, by Hombert and Matray | The authors “examine the long-term earnings of French high-skilled workers who started their career during the last tech boom in the late 1990s.” They find “an ‘ICT boom cohort discount’, with high-skilled workers who started in the sector ending up earning almost 7% less than workers who started careers outside of ICT. “One potential explanation for this is that human capital accumulated by high-skilled workers in a booming tech sector depreciates faster than usual because of accelerating technological change.” |
| “Dream Jobs? Teenagers’ Career Aspirations and the Future of Work” by Mann et al from the OECD | SURPRISE “Across the world, the young people who leave education today are, on average, more highly qualified than any preceding generation in history. They often enter the working world with considerably more years of schooling than their parents or grandparents… “And yet, in spite of completing an unprecedented number of years of formal education, young people continue to struggle in the job market, and governments continue to worry about the mismatch between what societies and economies demand and education systems supply. The coexistence of unemployed university graduates and employers who say they cannot find people with the skills they need, shows that more education does not automatically mean better jobs and better lives. “For many young people, academic success alone has proved an insufficient means of ensuring a smooth transition into good employment”… The authors find “that the career expectations of young people have changed little [since 2000]. If anything, they have become more concentrated in fewer occupations. "In the 2018 PISA survey, 47% of 15-year-old boys and 53% of 15-year-old girls from 41 countries and economies (those that also took part in PISA 2000) said they expect to work in one of just 10 jobs by the age of 30 – an increase of 8 percentage points for boys and 4 percentage points for girls since the start of the century. “Importantly, the growing concentration in career expectations is driven by changes in the expectations of young people from more disadvantaged backgrounds and by those who were weaker performers on the PISA tests in reading, mathematics and science… “It is clear that it is overwhelmingly jobs with origins in the 20th century or earlier that are most attractive to young people. In many ways, it seems that labour market signals are failing to reach young people: accessible, well-paying jobs with a future do not seem to capture the imagination of teenagers. Many young people, particularly boys and teenagers from the most disadvantaged backgrounds, anticipate pursuing jobs that are at high risk of being automated.” |
| Edelman Global Trust Barometer 2020 Report | Trust in institutions continues to drop, reflecting a growing “crisis of competence” in their perceived ability to effectively respond to a growing range of complex challenges facing the world. In turn, this crisis of competence feeds the decline in the perceived legitimacy of many institutions, and thus the increase we see in support for populists of all stripes. According to Edelman’s latest survey data, inequality now has a bigger impact on trust in government than the rate of GDP growth. 57% believe government serves the interests of only the few. The latest report found a record gap between elites and the masses trust in government, business, and the media. In 21 out of 28 nations surveyed, a majority of respondents agreed with the statement “I worry about people like me losing the respect and dignity I once enjoyed in this country.” (Notable exceptions: Ireland, the UK, and Canada). Also, 61% of employees fear losing their job to freelancers, 60% due to recession, 58% due to lack of training and skills, and 53% to automation. |
| “Education and Men Without Work” by Nicholas Eberstadt | SURPRISE “America today is in the grip of a gradually building crisis that, despite its manifest importance, somehow managed to remain more or less invisible for decades — at least, until the political earthquake of 2016. That crisis is the collapse of work for adult men, and the retreat from the world of work of growing numbers of men of conventional working age… “What economists call "demand-side effects" cannot plausibly account for America's overall men-without-work predicament — and might not even account for most of it. While more education may always be better than less, we cannot expect more education to solve a problem that a lack of education did not cause, and it is clear that male worklessness is due to much more than just a shortage of kills and training… “To start, although discussion of family structure and its consequences is held to be in poor taste or even off-limits completely in some academic and political circles these days, the strong relationship between family structure and employment status for men is undeniable. Simply stated, family structure is a powerful predictor of male labor-force participation rates (among other things). Overall, labor force participation rates in 2018 were 10 percentage points lower for never-married prime-age men than for their currently married counterparts… “Unfortunately, American family structure has been transformed over the past generation, and in ways that incontrovertibly created severe downward pressure on prime-age male labor-force participation rates. In 1965, 85% of prime-age men were married; by 2015, that share had dropped by nearly 30 percentage points… “The second factor contributing to 'worklessness' that must be considered is dependence on government benefit programs, including disability programs intended to provide income, goods, and services to working-age men and women who are prevented from working or seeking work due to physical or mental impairment… "Though they were designed as social-insurance platforms, evidence suggests they are increasingly used as income-support mechanism for men on a work-free life track." |
| “Who Signs Up to Fight? Makeup of U.S. Recruits Shows Glaring Disparity”, New York Times, 10Jan20 | “For years, military leaders have been sounding the alarm over the growing gulf between communities that serve and those that do not, warning that relying on a small number of counties that reliably produce soldiers is unsustainable”… Serving in the military is “increasingly a family business. The men and women who sign up overwhelmingly come from counties in the South and a scattering of communities at the gates of military bases…where the tradition of military service is deeply ingrained”… “More and more, new recruits are the children of old recruits. In 2019, 79 percent of Army recruits reported having a family member who served. For nearly 30 percent, it was a parent — a striking point in a nation where less than 1 percent of the population serves in the military.” |
| | |
| | |
| | |
| | |
| | |
| | |
| | |
| | |
| New Political Information: Indicators and Surprises | Why Is This Information Valuable? |
| “Most Americans Say There Is Too Much Economic Inequality in the U.S., But Fewer Than Half Call It a Top Priority”, by Pew Research 9Jan20 | As a top priority for the federal government, reducing economic inequality (42%) was outranked by making healthcare more affordable (72%), dealing with terrorism (65%), reducing gun violence (58%), and addressing climate change (49%). However, among lower income adults, it ranked higher, with 52% agreeing it should be a top priority for the federal government. Democrats and Republicans tend to disagree on the factors that contribute a great deal to inequality. The one that generates the most agreement from partisans from both parties is “problems with the education system”, which, along with the tax system, is also the one cited by the most adults (44%). In a separate study published on 13Jan20, Gallup found that the top five issues that voters rank as extremely important this election year are healthcare (35%), terrorism and national security (34%), gun policy (34%), education (33%), and the economy (30%). Note that Gallup interprets “extremely important” responses as indicating “intense concern” with an issue, while the sum of “extremely” plus “very important” responses measures “broader but shallower importance”. |
| “The U.S. Remained Center-Right, Ideologically, in 2019”, by Gallup 9Jan20 | At the end of 2019, 25% of Americans identified their political views as liberal (versus 17% in 1992), 35% as moderate (43%), and 37% as conservative (36%). In terms of party identification, 28% of Americans identify as Democrat, 28% as Republican, and 41% as Independent. “Democratic partisans are more ideologically diverse than Republicans, with 49% in 2019 identifying as liberal, 36% as moderate and 14% as conservative.” In 2019, 73% of Republicans identified themselves as conservative and 21% as moderates. In contrast, “the liberal wing of the Democratic Party has about doubled in size over the past quarter century, rising from 25% in 1994 to 51% in 2018. The slip to 49% in 2019 suggests that trend may be slowing or leveling off, at least temporarily”… “Independents typically mirror the country as a whole, but in this case they are more centrist than center-right. A large plurality identify as politically moderate (45%), whereas 30% call themselves conservatives, and only slightly fewer are liberal (21%).” |
| “America is Still Waiting for a True Populist”, by Janan Ganesh, FT 22Jan20 | “In a vaunted age of populism, the US does not have a true populist. No politician of national clout stands for both the economic and cultural sides of the creed… The marginal voter appears to crave universal healthcare and higher taxes on the rich, but also tighter borders and less strident identity politics. “That “but” is a slander, of course, as no theoretical conflict exists here. It all adds up to a coherent belief in social cohesion under paternalist government. A European would recognise it as Christian Democracy or One Nation Toryism or even Gaullism, but it is just the politics of mid-20th century America, when immigration was low and the welfare state filled out”… “The mystery is why politicians are so much better at sensing this demand than at meeting it… "When someone eventually goes there, the mix of policies will feel jarring, even improper, and then the most natural thing in the world”. |
| “Boris Johnson is reinventing one nation Conservatism”, The Economist, 2Jan20 | “One-nation Conservatism has in fact had many meanings over the decades…At its simplest, [Boris Johnson’s] version of one-nation Conservatism means an amalgam of leftwing policies on economics and right-wing policies on culture—the exact reverse of Mr Cameron’s approach.” From a US perspective, this is a fascinating and very logical move. From as early as Maddox and Lilie’s “Beyond Liberal and Conservative” (published in 1984), analysts have segmented the US electorate based on their views on social and economic issues. In recent years, the positioning apparently chosen by Boris Johnson has had the largest number of voters. In the United States, an argument can be made that “Reagan Democrats” fit this description, as did a substantial percentage of swing voters that Trump won in key states in 2016. However, while it has had a large number of adherents, this liberal on economics/conservative on social issue positioning has also been the one least represented by the dominant views in the major US parties (a point also made by Michael Lind in his excellent new book, “The New Class War”). Democrats have espoused liberal views on both social and economic issues, Republican conservative views on both, and Libertarians have tended toward liberal views on social issues and conservative views on economic ones (Note that some analysts have substituted “favoring/not favoring” government intervention for the liberal versus conservative dichotomy. For example, Libertarians are opposed to government intervention in either policy area). |
| “The Twitter Electorate Isn’t the Real Electorate” by Helen Lewis, in The Atlantic, 13Jan20 | “Does Twitter matter? The temptation is to say no. Its user base is small compared with Facebook—321 million monthly active users versus more than 2 billion—and a quick glance at the trending topics reveals its fractious, claustrophobic atmosphere… “But Twitter has become journalists’ easiest and most reliable source of cor-blimey (or OMG, to American readers) stories, because all of human life is there, and it’s searchable. It is also the world’s wire service: Just look at Donald Trump, who drops his unfiltered thoughts straight onto Twitter, confident that they will be picked up by journalists… “All of this gives the social network—and its most active users—outsize power to shape the political conversation.” |
| “Global Satisfaction with Democracy 2020” by Klassen et al, from the Centre for the Future of Democracy, University of Cambridge | The authors, “use a new dataset combining more than 25 data sources, 3,500 country surveys, and 4 million respondents between 1973 and 2020 asking citizens whether they are satisfied or dissatisfied with democracy in their countries… “Using this combined, pooled dataset, [they] are able to present a time-series for almost 50 years in Western Europe, and 25 years for the rest of the world”. The authors “find that dissatisfaction with democracy has risen over time, and is reaching an all-time global high [since 1995], in particular in developed democracies. The rise in democratic dissatisfaction has been especially sharp since 2005.” |
| “Resurgent Marine Le Pen revels in Macron’s woes”, FT 30Jan20 | SURPRISE “When Marine Le Pen was crushed by Emmanuel Macron in France’s 2017 presidential election, the far-right leader looked as if she had suffered permanent political damage. But with Mr Macron deeply unpopular and French party politics in a state of upheaval, Ms Le Pen has bounced back — and polls suggest she has a strong chance of taking her comeback all the way to the Elysée Palace… “Ms Le Pen has tapped into the anger of France’s anti-establishment gilets jaunes protesters, many of whom share her views on everything from the dangers of mass immigration to the dominance of Paris over the rest of France… “Above all, she has profited politically from Mr Macron’s success in crushing the traditional parties of left and right, and portraying elections henceforth as Manichean struggles between progressives and nationalists — a restructuring of politics that she says changes everything.” |
| “The Great Divide: Drivers of Polarization in the US Public”, by Bottcher and Gersbach from ETH Zurich | SURPRISE Sometimes a foreigner’s perspective provides a clearer view of a country than its own citizens. This thought-provoking, quantitative paper studies the evolution of polarization in the United States between 1994 and 2017. The authors conclude that, “political polarization in the U.S. is mainly driven by strong and more left-leaning policy/cultural innovations in the Democratic party.” To be sure, it is not as though the United States has not seen such movements before; consider the Great Awakenings/Revival and anti-slavery movements in the 19th century, and the prohibitionists/temperance movement in the early 20th. What is different this time around is that this movement is based in the Democratic Party, and is far more secular in nature than its predecessors. That said, it does seem to represent just the latest manifestation of a cyclical trend in American social life and politics. |
| | |
| | |
| New Financial Markets and Investor Behavior: Indicators and Surprises | Why Is This Information Valuable? |
| “Squaring Venture Capital Valuations with Reality” by Strebulaev and Gornall | The authors “develop a valuation model for venture capital–backed companies and apply it to 135 US unicorns, that is, private companies with reported valuations above $1 billion.” They find that reported unicorn post–money valuations average 48% above fair value, with 14 being more than 100% above. |
| “Wall Street banks ramp up research into quantum finance”, by Richard Waters, FT 5Jan20 | “Some of Wall Street’s biggest banks have stepped up their research into quantum computing, signaling growing confidence that recent breakthroughs in the field have laid the foundation for the first practical applications of the revolutionary new computing technology… “The banks’ research efforts centre on trying to design new types of algorithms capable of being run on quantum machines. The first of these involve a class of optimisation problems… "Banks hope quantum machines will greatly reduce the time it takes to analyse complex risk positions, making it possible to adjust on the fly rather than relying on an overnight calculation… “Further in the future, the banks also hope to use quantum computing to speed up the machine learning systems that lie at the heart of their push into artificial intelligence. That could make it possible to spot anomalies in markets more quickly, or identify opportunities that were not apparent at all before. However, that research has yet to begin and will require techniques that go well beyond optimization”. |
| “The Economic Effects of Private Equity Buyouts”, by Davis et al | The authors, “examine thousands of U.S. private equity (PE) buyouts from 1980 to 2013, a period that saw huge swings in credit market tightness and GDP growth. [Their] results show striking, systematic differences in the real-side effects of PE buyouts, depending on buyout type and external conditions... “Employment at target firms shrinks 13% over two years in buyouts of publicly listed firms but expands 13% in buyouts of privately held firms, both relative to contemporaneous outcomes at control firms. Labor productivity rises 8% at targets over two years post buyout (again, relative to controls), with large gains for both public-to-private and private-to-private buyouts. Target productivity gains are larger yet for deals executed amidst tight credit conditions.” |
| “Zooming In on Equity Factor Crowding”, by Volpati et al | “Investors in a purportedly crowded strategy may face three related predicaments. One is that of increased competition for the same excess returns, leading to an erosion of the performance of the strategy… “Second is increased transaction costs: maintaining similar portfolios leads to similar trade flows. This amplifies the effective market impact suffered by all investors following the same strategy – an effect called ‘co-impact’... "This in turn leads to a deterioration of performance even under normal conditions... “Finally, if the portfolios of different competitors largely overlap, systemic risk may arise as the liquidation of one of these portfolios can trigger further liquidations and even severe cascading losses for all investors who shared similar positions”… “Crowding is most likely an important factor in the deterioration of strategy performance, the increase of trading costs and the development of systemic risk”… The authors “identify significant signs of crowding in well-known equity signals, such as Fama-French factors and especially Momentum. We show that the rebalancing of a Momentum portfolio can explain between 1% to 2% of order flow, and that this percentage has been significantly increasing in recent years.” |
| “Structured Finance and Correlation Risk”, by Chesney et al | SURPRISE The authors, “study the relation between the inherent complexity of structured products and their endogenous issuer margins. First, using a sample of 4,460 yield enhancement products (YEP), [they] document a shift towards more complex payoff structures. Margins for more complex products are twice as high relative to their less complex counterparts, while the former's realized investor returns are lower and negative on average… [They] “identify uncompensated correlation risk as the main mechanism behind this discrepancy…[and find that investors] systematically underestimate the embedded correlation risk of more complex products. The resulting relative overpricing is increasing in the underlying volatility and in subjects' overconfidence.” |
| “ESG rating disagreement and stock returns”, by Gibson et al | SURPRISE The authors find that rating providers in civil law countries “are more apt at identifying material social information” while rating providers in common law countries are better at identifying governance issues. They also find that “disagreement by such rating providers results in overvaluation and thus lower subsequent stock returns”. |
| “Associative Memory and Belief Formation”, by Enke et al | SURPRISE One of the great mysteries of financial markets (and group dynamics more broadly) is why certain narratives persist, and even become more widely held, despite accumulating evidence that they are inaccurate. As we have noted in the past, part of the reason lies in human beings’ increased tendency towards conformity and copying the beliefs and behavior of others (“social learning”) when uncertainty increases. This new research highlights another reason that has been hardwired into us by evolution. The authors experimentally study the role of associative memory (Kahneman’s System 1) for belief formation. “Real world information signals are often embedded in memorable contexts. Thus, today’s news, and the contexts they are embedded in, may cue the selective retrieval of similar past news and hence contribute to the widely documented pattern of expectation overreaction”. The authors experimentally find support for this hypothesis. “Once today’s news is associated with the stories and images of previous opposite news, expectations systematically underreact. By exogenously manipulating the scope for imperfect and associative recall in our setup, we further provide direct causal evidence for the role of memory in belief formation and overreaction.” |
| | |
System Tipping Points/Critical Threshold Analysis
Like Professors Andrew Lo, Doyne Farmer and others, we regard financial markets as a complex adaptive system (CAS), that exist as part of a larger macro system comprised of other CAS between which there are multiple feedback loops. These other systems include those that produce technology innovations, and economic, environmental, national security (including cyber), social, demographic, and political outcomes.
We also find that these systems tend to operate and generate effects in a rough chronological sequence, albeit with many feedback loops between them. The following chart highlights that the changes we observe in different areas at any point in time are actually part of a much more complex evolutionary process.
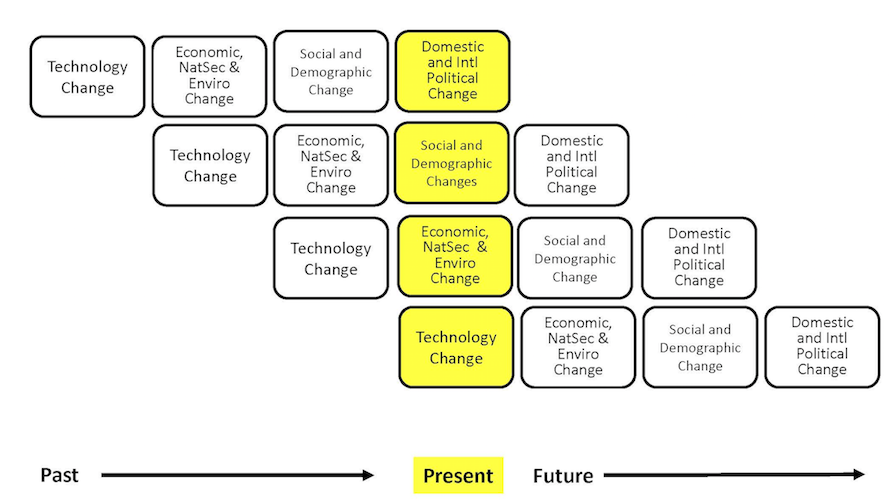
While most media coverage of these systems focused on flows (e.g., the size of the government deficit), rapid non-linear change in complex adaptive systems is often caused by a key stock (e.g., the amount of outstanding government debt) exceeding a critical threshold.
The next table highlights the key macro system stocks that we monitor.
In the next section, we will discuss information received over the past month that is related to these stocks, and which we believe is significant to our assessment of the probabilities that a critical threshold will be reached and a regime change will occur. We will conclude with our estimate, at the end of this month, of how close the macro system is to these critical thresholds, and the implications for financial market regime change probabilities.
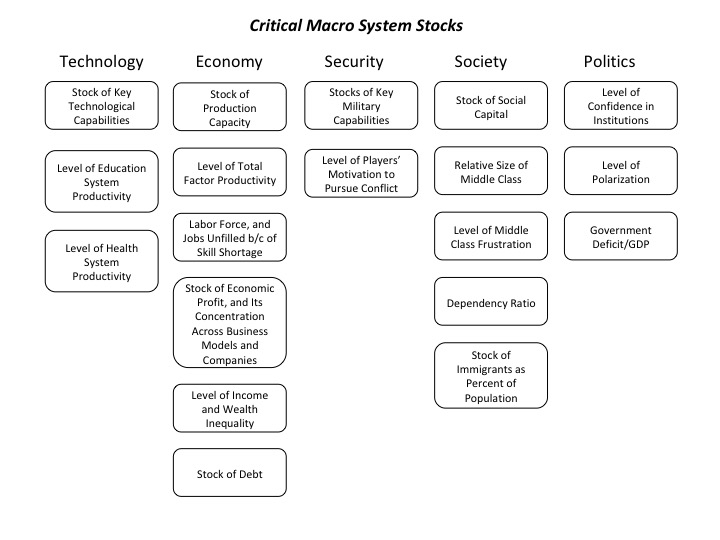
How Close is the Macro System to One or More Critical Thresholds?
As we have noted, the macro drivers of financial market regime changes typically follow a rough chronological sequence, from technology to economic, security, social, and political causes and effects. Yet there are many feedbacks loops between them, creating complex root causes for many of the critical thresholds we have identified.
Understanding the time dynamics in this complex system is critical to avoiding substantial downside investment risk.
We use the UK Met Office Warning Model to communicate our assessment of these time dynamics. We estimate the time remaining before a critical macro system threshold is reached that could trigger a regime change, which is usually accompanied by substantial changes in asset class valuations.
The model uses three increasingly serious levels of warning, from “Be Aware” (condition yellow), to “Be Prepared” (condition orange), to “Take Action” (condition red).
For our purposes, we denote as “Be Aware” (yellow) critical thresholds that we assess to be three or more years away. We estimate that “Be Prepared” (orange) thresholds could be reached within 1 to 3 years. “Take Action” thresholds are very likely to be reached within one year.
Given their nature, we also note that in our three “wildcard” areas (Environment and Energy related; Disease and Human Caused Bioevents; and Cyber and Electromagnetic Events), our forecasts have higher levels of uncertainty.
The following charts summarize our current estimate of the time remaining before different critical thresholds will be reached.
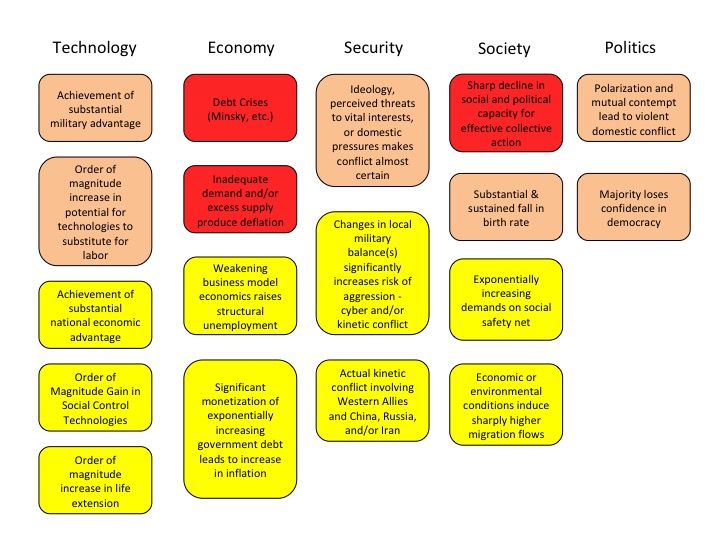
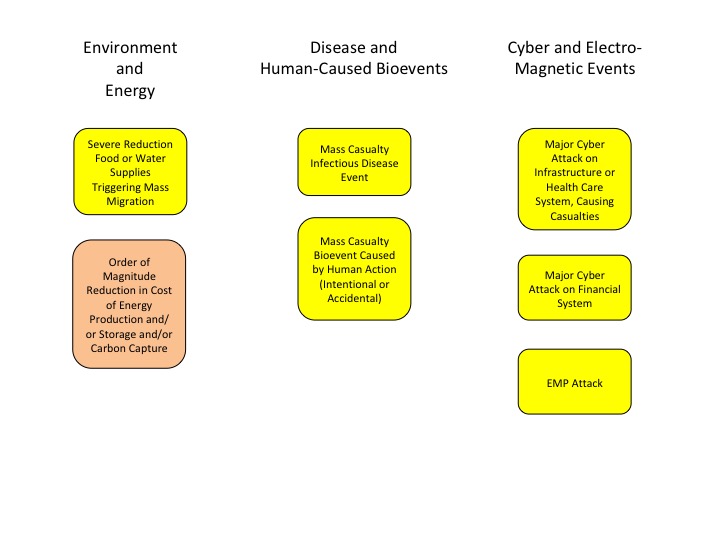
At the highest level, we believe the complex adaptive global macro system can be in one of four states, based on its degree of order versus disorder, and degree of social cooperation versus conflict. A very coarse-grained reading of history suggests that these states evolve in a predictable cycle, from ordered/cooperative, to disordered/cooperative, to disordered/conflicted, to ordered/conflicted.
We believe that the system is currently in its most uncertain state, characterized by high degrees of underlying disorder and social conflict, both domestically and internationally. Beyond some point, intensifying conflict eventually increases the degree of order in the system. That appears to be happening now, via the increasing conflict between China, Russia, and Iran and the United States and other Western nations.
If you have any questions about anything we have written in this issue, please don’t hesitate to get in touch, at contact@indexinvestor.com
Appendix: Anticipatory Thinking and Forecasting Methodologies
Our process is based on methods and tools developed over the past seven years at our affiliate, Britten Coyne Partners, which provides consulting services and education courses to executive teams and boards on strategic risk governance and management.
At The Index Investor, we engage in both anticipatory thinking to identify what could happen (e.g., different macro regimes and related events), and forecasting, to estimate the probability that events and regimes will happen, and the impact they will have if they do (e.g., on macro variables and broad asset class returns).
With respect to what could happen, we are acutely conscious of the conclusion reached by a 1983 CIA study of failed forecasts: "each involved historical discontinuity, and, in the early stages…unlikely outcomes. The basic problem was…situations in which trend continuity and precedent were of marginal, if not counterproductive value."
When it comes to forecasting, we know that in complex socio-technical systems that are constantly evolving, the accuracy of statistical or machine learning based forecasting methods declines exponentially as the time horizon lengthens, since the historical data set on which they were trained will (depending on the speed and effectiveness of any retraining cycle) bear less and less resemblance to the distribution of outcomes the system is likely to produce in the future.
Under these circumstances, forecast accuracy over longer time horizons depends on causal and counterfactual reasoning about the possible future effects of multiple interacting trends and uncertainties that are hard to quantify.
And we are acutely aware of the economist Rudi Dornbusch's famous warning: "Crises take a much longer time coming than you think, then happen much faster than you would have thought."
Our forecasting process also draws on lessons Tom Coyne learned from spending four years as a member of the Good Judgment Project team, which won the Intelligence Advanced Research Projects Activity’s forecasting tournament with forecast accuracy that was more than 50% better than the tournament's control groups (the team's experience is described in Professor Philip Tetlock's book, “Superforecasting").
Our analysis focuses on the probability of the global macro system being in four possible macro regimes 12 and 36 months from the date of our forecast: (1) Normal Times, where equity asset classes perform well; (2) a High Uncertainty regime that is usually short and transitory, where asset classes like short-term government bonds perform best and equities suffer significant declines; (3) High Inflation (which we deem 5% or more, year-on-year), where commercial property, real return bonds and other traditional hedges are favored; and (4) Persistent Deflation (a year-on-year decline in the US CPI), which up to now has only been seen in Japan, and in which the relative performance of different asset classes remains uncertain, but will likely favor high quality bonds and the consumer staples equity sector.
In response to subscriber requests, we have added a 36-month regime forecast to our existing 12 month forecast. The logic is that, in a complex evolving system like global macro, a longer forecast horizon gets beyond the “detection range” of algorithmic forecasting approaches, and therefore raises probability that a manager/investor can gain an edge in identifying emerging threats and opportunities.
That said, because evolving (i.e., “non-stationary”) complex systems populated by highly connected human agents are also capable of sudden non-linear changes (with which are hard for algorithmic approaches to predict), we are also keeping our 12 month forecast.
Our forecasting methodology starts with base rate/reference case data about the historical probability of large changes in equity and bond valuations. We then analyze the current situation from both a quantitative and qualitative perspective. In the latter, we focus on the key endogenous drivers of macro regime change, including technological, economic, national security, social, and political trends and uncertainties. We also focus on three potential sources of exogenous shocks that could also produce a macro regime change, caused by environmental, disease, and cyber related events.
While most of our attention typically focuses on various flows (e.g., economic growth, change in the price level, sales, earnings, job creation, etc.), endogenously caused regime changes result when those flows push key stocks beyond a critical threshold or tipping point, often setting off non-linear reactions across multiple areas. As noted by Hyman Minsky and others, a classic example is the steady accumulation of outstanding debt until it reaches the point where it can no longer be serviced and triggers a crisis.
Base Rate Data
Since the end of World War Two, there have been fifteen months where a downturn in the US equity market began that eventually reduced asset class value by 20% of more. That is a hazard rate of about 1.75% per month. Put differently, in any given month there is a 98.25% probability that a 20%+ downturn won’t occur, or, in a given year, an 81% probability.
However, as the time without a 20%+ downturn extends, the compound probability that one will not occur shrinks. At the end of August 2018, it is more than nine years since the last equity market decline of 20% or more. The probability of that happening is only 15%.
To estimate the base rate for a 20% fall in bond prices (which historically has been caused by a sharp increase in inflation, as we saw in the late 1970s and early 1980s), we analyzed monthly historical AAA bond yields since 1919. For consistency, we used them to calculate the price of a ten-year zero coupon bond. We then calculated the probability of a price decline of 20% or more over three different holding periods: 12, 18, and 24 months. In any month, the annualized probability of a decline of 20% or more over the subsequent 12 months is 12%; over 18 months, 20%, and over 24 months, 25%.
Market Stress Indicators Methodology
We view financial markets as a complex adaptive system. The size of changes generated by such a system follows a power law rather than a normal (Gaussian) distribution. The critical point is that large changes are much more common in complex adaptive systems than most people’s intuition leads them to believe.
While predicting the behavior of complex adaptive systems remains far more art than a science, various researchers have found that large changes in such systems are often preceded by subtle warning signs, as stress accumulates within them. While this research is not definitive, we believe that five warning signs are worth monitoring as potential indicators of growing stress within financial markets that could suddenly give rise to large changes in asset class valuations.
Our first indicator is the month-to-month autocorrelation of broad asset class returns (i.e., the relationship of this month’s returns to last month’s). A system under increasing stress loses resiliency, causing it to take longer to recover from perturbations; hence, autocorrelation increases as it approaches a critical transition (see, “Early Warning Signals for Critical Transitions” by Scheffer, et al).
The second market stress indicator we monitor is the Economic Policy Uncertainty Index published by the Federal Reserve Bank of St. Louis (via its FRED economic database), which is based on research by Baker, Bloom, and Davis (see their paper, “Measuring Economic Policy Uncertainty”). The index is based on automated text analysis of leading newspapers and magazine publications, to identify the frequency with which words and phrases are used that indicate uncertainty.
In humans’ evolutionary past, when uncertainty increased the probability of survival was enhanced by staying close to a group. All of us still have that instinct. Research has found that as uncertainty increases, we have an unconscious bias towards higher conformity of our own views with those of a larger group (i.e., reduction in cognitive diversity). Behaviorally, heightened uncertainty induces more “social copying” of others, likely due to both conformity bias and the rational belief that others may be acting on the basis of superior information. This increase in conformity and copying makes a social system more ordered as uncertainty increases, and also reduces its responsiveness to perturbations (i.e., increases autocorrelation) because of delays in the social copying process.
The key point is that increasing uncertainty induces more, not less order in social systems, and in so doing primes them for sudden non-linear change.
Our third market stress indicator is the spread between the yield on AAA rated bonds and the 10-year US Treasury. This is a proxy for the level of investor concern about financial system funding liquidity.
Our fourth market stress indicator is the yield spread between speculative BB rated bonds and the ten-year US Treasury. Throughout history, excessive credit growth has been a root cause of many financial crises. An indicator of such growth is falling credit spreads, particularly in the case of riskier borrowers. In contrast, rising BB spreads indicate growing investor concern about the consequences of such growth, and the financial distress lower rated companies could experience in an economic downturn.
Our fifth market stress indicator is what we term the “political risk premium” that is implicit in the price of gold. Our starting point for estimating this premium is the three different roles that gold plays. First, gold is a store of value in a world of fiat currencies. When the rate of money supply growth exceeds the growth of nominal GDP, gold’s price should increase to maintain its purchasing power. Between 2007 and 2017, the US money supply (M2) grew by about 86%, while nominal US GDP grew by 35%. The stock of gold grew by 18%, based on mine production over this period. We therefore infer that 33% of the increase in the price of gold represented the maximum potential gold price change that could be attributed to a desire to hedge inflation risk (86% less 35% less 18%).
Second, gold is a unit of account. We take this to mean that the annual change in GDP expressed in terms of physical gold (i.e., nominal GDP divided by the price of gold) should equal the change in real GDP calculated using the GDP price deflator to account for actual inflation over the period. A key challenge is the point at which to start this calculation.
We chose the price of gold in 1995/1996. In that period, the change in real global GDP measured using the IMF’s price deflator just about equaled the change in GDP measured in terms of physical gold. We interpret that coincidence as indicating that at that point in time, concerns about future inflation and political risk were minimal, and the change in the price of gold was mostly driven by its role as a unit of account. We calculated a subsequent series of gold prices that would produce the same change in “gold GDP” as the actual real GDP as calculated by the IMF. Between 2007 and 2017, “gold as a unit of account” warranted a 21% increase in its price.
Gold’s third role is as a hedge against inflation and what we term “political disaster” risk. We subtract the 21% estimated compensation for actual inflation from the 33% “gross” inflation risk hedge to derive an apparent 12% increase in the gold price that reflected the true risk premium to hedge against possible future inflation. However, between 2007 and 2017 the price of gold actually increased by 81%. This implies that 48% of this (81% less 21% less 12%) represented a premium for some other type of uncertainty at the end of 2017. The interesting question is the nature of the uncertainty for which gold is believed by some investors to be a superior hedge than traditional ports in a storm like short-term US government securities, or similar securities issued by other developed countries.
The logical inference is that the uncertainty in question must reflect a situation in which short term US Treasuries would be a less effective hedge than gold. This could be a world of widespread hyperinflation, capital controls, and/or radical changes in nations’ governments (of course, this would also imply a preference for investing in gold coins rather than bullion, as while the latter may be a store of value, it is far less convenient as a means of paying for transactions).
To put this in further perspective, this gold price “disaster risk” premium sharply increased from 2008 to 2012, then declined before sharply increasing again after 2016. Arguably, a significant part of the former increase reflects concerns about the potential inflationary consequences of dramatic quantitative easing by central banks. But this is not likely to be the case after 2016.