The Index Investor
December 2020
Recent Quantitative Indicators
Tactical Asset Allocation Implications of Our Forecasts
Forecast Pre-Mortem Analysis
Combining and Extremizing Forecasts to Improve Predictive Accuracy
Feature Article: The Case Against Bitcoin
High Value Information Observed Last Month:
- Technology
- Energy and Environment
- Health and Disease
- Economy
- National Security
- Society
- Politics
- Financial Markets and Investor Behavior
Critical System Thresholds/Tipping Points Analysis
Appendix: Anticipatory Thinking and Forecasting Methodologies
Current Macro Forecast
How the Persistent Deflation Regime Could Emerge
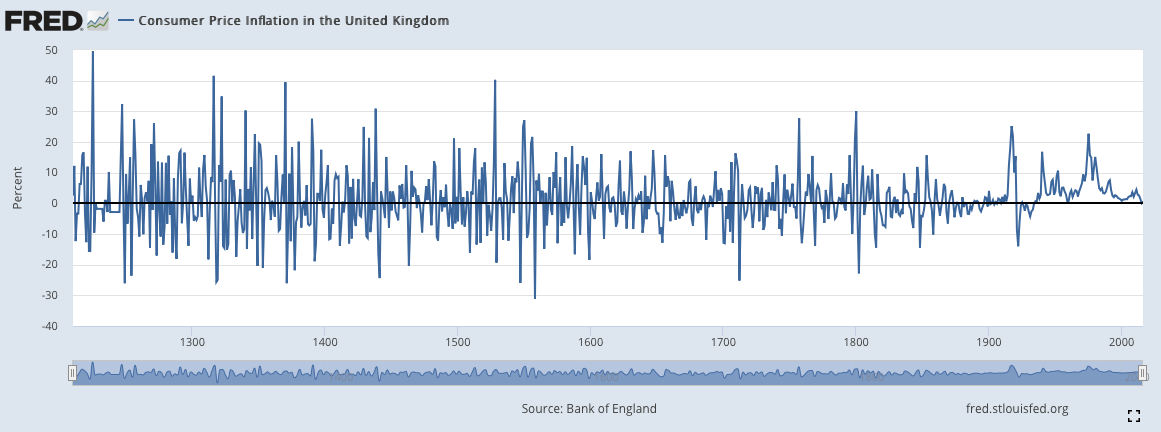
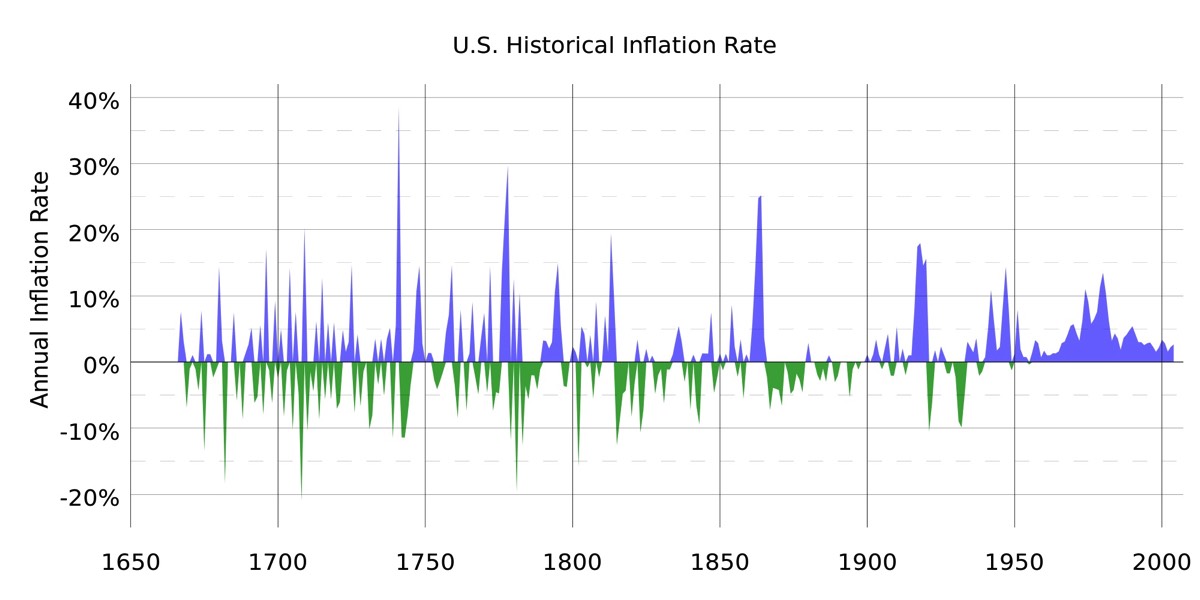
As we wrote in last December’s feature article (“What Do We Know About Escaping the Persistent Deflation Regime?”), periods of deflation have occurred throughout the economic history. For example, this chart shows UK inflation between 1210 and 2016:
In contrast, the major deflations that occurred in the 20th century (during the Great Depression in the 1930s and in Japan after 1995) have been “bad or debt deflations” caused by a collapse of demand relative to supply as companies and households cut spending to pay down debt, or went out of business due to bankruptcy.
Before COVID arrived, many developed countries faced growing demand headwinds that were raising the probability of an eventual debt deflation. These included:
• An aging population (retirees spend less);
• Worsening income inequality (more income concentrated in households that save a greater fraction of it);
• Higher debt burdens on younger people (due to student loans);
• An accelerating net loss of jobs to offshoring and automation; and
• High levels of corporate debt (that depress investment).
COVID has not weakened or reversed these intensifying deflationary forces; rather, it may accelerate some of them:
• Many consumers have lost jobs and now have less income to spend. And many of those who didn’t are more uncertain than before (e.g., about going to restaurants or traveling), and also reluctant to spend.
• Corporates have taken on more debt, and reduced investment because of higher uncertainty;
• Working from home may lead to the offshoring of more high-skill jobs, and significant reduction in demand for business travel;
• Students with loans who are unable to work will see their debt burden increase;
• When boomers seeking to sell their homes and downsize may find fewer buyers and realize lower capital gains than they expected, leading to lower consumption spending.
Note that, as was the case in Japan, deeply rooted structural, not cyclical causes underlie these trends. Unfortunately, the increasing polarization of politics in many countries makes these structural causes even more difficult to address. As a result, deflation may persist, as it did in Japan.
How the High Inflation Regime Could Emerge
As you can see from the charts above, in the 20th century episodes of high inflation were much more common than they were in previous periods. Yet they haven’t reappeared since the last great inflation was broken in the early 1980s.
This begs the question of what caused this, and whether those anti-inflationary causes are likely to persist.
One school of thought points to a series of favorable changes that boosted supply relative to demand, and in do doing minimized upward pressure on prices. These included:
• The entry of baby boomers into the workforce;
• The fall of the Soviet Union, and integration of Eastern European countries into the global economy;
• The entry of China into the World Trade Organization with its immense production capacity;
• The creation of low cost global supply chains facilitated by the advance of information and communications technologies;
• The automation of manufacturing;
• The digitization of an increasing share of the economy, since the marginal cost of providing an additional unit of a digital product (e.g., a movie download) is essentially zero.
However, most of these changes were “one-offs”; while others may reverse (e.g., global supply chains), or have less impact (e.g., automation outside manufacturing is more difficult). So the first point to note is that the supply side forces that have contributed to lower inflation since the 1980s are weakening.
Another school of thought points to fiscal and monetary policy changes as a cause of lower inflation over the past 40 years. Central banks around the world have become more independent and strongly committed to keeping inflation under control, which in turn has kept the public’s inflationary expectations quite low.
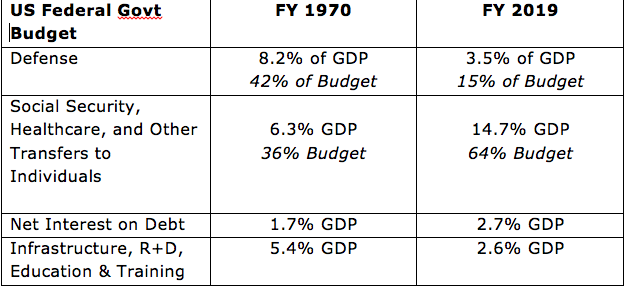
Other trends, however, were more concerning. The United States has been running deeper fiscal deficits:
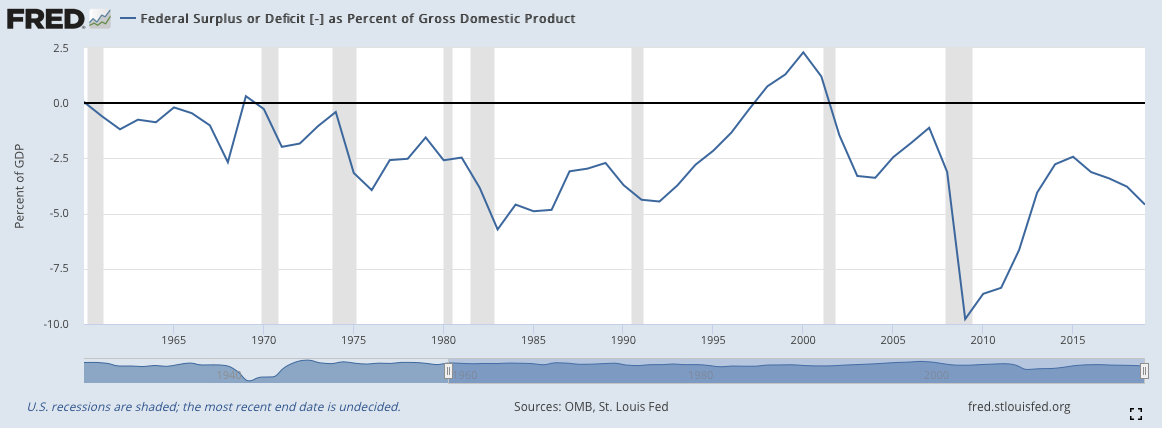
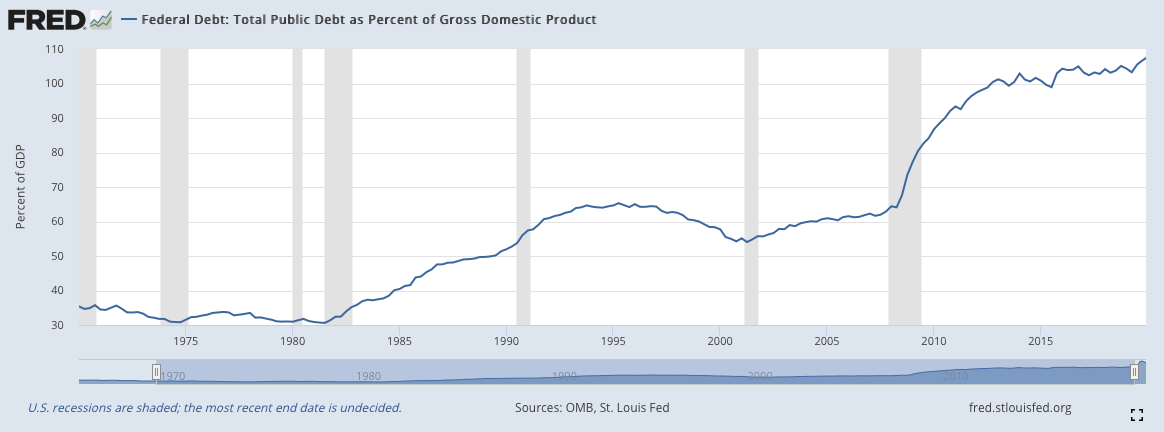
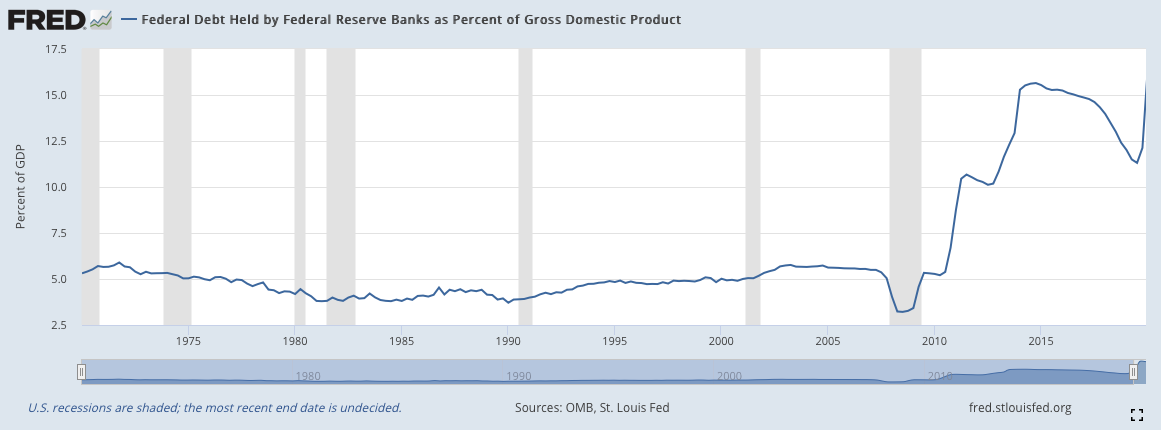
In “Do Enlarged Fiscal Deficits Cause Inflation: The Historical Record”, Bordo and Levy “survey the historical record for over two centuries on the connection between expansionary fiscal policy and inflation.” They find that, “in the post-World War II era a detailed examination of the Great Inflation in the 1960s and 1970s in the U.S. and the U.K. suggests that fiscal influences on monetary policy was a key factor.” More specifically, fiscal and monetary policy increased demand relative to supply, while politically driven swings in monetary policy allowed the public’s of higher future inflation to rise. This was further compounded by the failed attempt to contain inflation through the use of wage and price controls.
The authors contrast this experience with the aggressive use of fiscal and monetary policy following the Great Financial Crisis of 2008. Their key point is that despite this stimulus demand remained weak relative to supply, limiting the inflationary impact of the stimulus (and testifying to the strength of the deflationary forces at work).
A critical uncertainty is how the balance between demand and supply will change as a result of COVID. On the one hand, social isolation has led to the build up of household savings, and, undoubtedly, some personal consumption demand. But due to behavioral changes, it may also have led to permanent reduction in demand in other areas (e.g., as working from home using Zoom and other technologies replace demand for office space and business travel).
COVID has also caused the destruction of significant supply capacity in some areas. Thus far, this seems to limited in scope – e.g., the permanent closing of restaurants and other small businesses. In these areas, spending accumulated savings on consumption will almost certainly produce a short-term increase in prices. However, in the US Consumer Price Index these services have only a 12.3% weight (including Food and Beverage Away from Home; and Recreation and Personal Services).
From this perspective, it seems very likely that, in the short-term at least, the forces of deflation will dominate those of inflation.
To be sure, there is always the potential for an even larger supply side shock that could lead to inflation, including for example, a US War with China or Iran that reduces global trade and energy supplies, or large crop failures that disrupt food supplies.
But the more likely medium term threat lies elsewhere, in the interacting dynamics between economic trends, government deficits, and accumulating debt.
We know that aging is going to put growing pressure on federal social spending. If automation and offshoring continue to destroy jobs without replacing them with others that offer the same or better compensation, then other forms of government social safety net spending will increase. At the same time, rising tensions with China will almost certainly lead to higher defense spending.
To stabilize (and eventually reverse) growth in the United States’ government debt/GDP ratio, structural changes will be required to offset deflationary forces and increase tax revenue (e.g., via faster GDP growth, higher income tax rates, and/or new carbon, consumption, and wealth taxes). In turn, this requires the political will to overcome longstanding obstacles and successfully address many of the economy’s structural problems (e.g., education, healthcare, infrastructure, basic research funding, barriers to competition, offshoring, high debt levels, etc).
So what happens if these changes don’t happen, economic growth remains weak, and deficits, outstanding federal debt, and the percentage of it owned by the Federal Reserve all continue to grow?
According to advocates of Modern Monetary Theory (MMT), nothing. They believe the Federal Reserve can keep creating money and buying government debt to fund federal deficits forever, with no negative consequences. They have found the economic Fountain of Youth.
In support of their beliefs, they point to Japan, where the central bank has bought government debt for years, and the nation’s debt/GDP ratio now stands at 223%, with nary a hint of inflation.
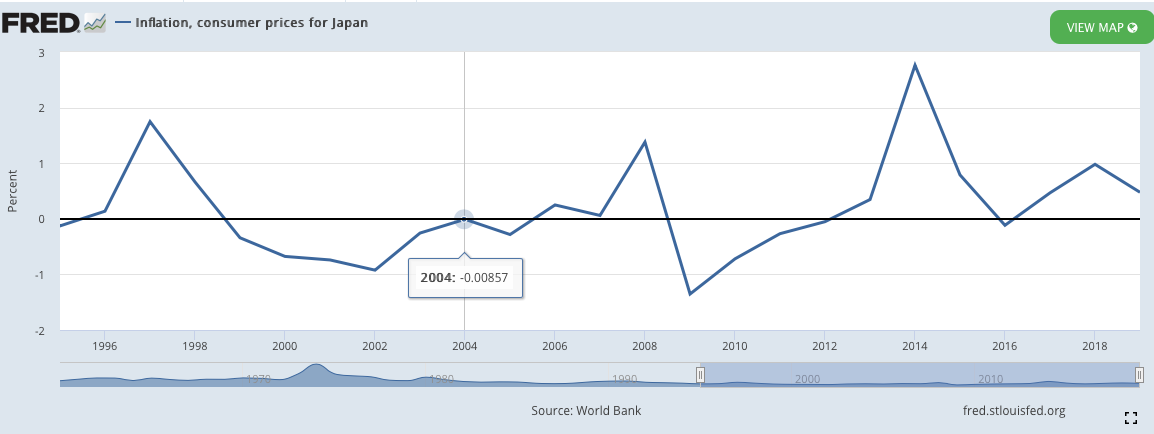
If that is the case, then the risk for investors holding government debt is that at some point, a critical threshold or tipping point is passed, and the narrative changes.
The value of government debt equals the prevent value of the government’s forecasted future primary surpluses (revenue less expenses before interest payments), discounted at an appropriate rate. As the probability of future primary surpluses declines, the probability increases of a bad outcome at some point in the future (default or high inflation).
In exchange for bearing this risk, investors will demand a higher interest rate to hold US government debt. But that only makes the deficit worse, by increasing interest expense, setting off an accelerating vicious cycle, which also includes a falling dollar exchange rate, which raises inflation through the import cost channel. Once this tipping point is reached, the only way to avoid an exponential increase in outstanding debt is through very large spending cuts and/or tax increases.
To hedge against this this scenario coming to pass, the US government should borrow at much longer terms and lock in the very cost at which this can be done today (e.g., the 30 year Treasury Bond yields just 1.63%). For example, the average maturity of US government debt today is about 6 years, compared to 16 years in the UK (where the yield on 30 year Gilts is just 0.76%). If high inflation should one day come, longer average debt maturity will produce a larger reduction in the real value of government debt.
So, to summarize: In broad terms, we are looking at two possible trajectories.
The first is a virtuous circle, in which the US and other developed countries successfully confront the structural challenges that are the root causes of growing deflationary headwinds. This leads to stronger demand growth, which leads to increasing government revenues, a slower increase in government costs, and a gradual reduction in the ratio of government debt/GDP.
In the second trajectory, political obstacles block changes to the structural drivers of deflation, leading to exponentially increasing government deficits, which are monetized by central banks and at some unknown point trigger a vicious cycle that ends in high inflation and/or default, with all its attendant (and unpredictable) national security, economic, social, and political consequences.
The key indicator to watch is whether the Biden administration (and leaders in other nations) can successfully address the deflationary headwinds we face. If they can, we’re on our way back towards the Normal Times Regime. If they can’t, the most likely outcome is the Persistent Deflation Regime, followed (at some unknown point) by what will likely be a sudden transition to the High Inflation Regime.
This Month’s Regime Forecasts
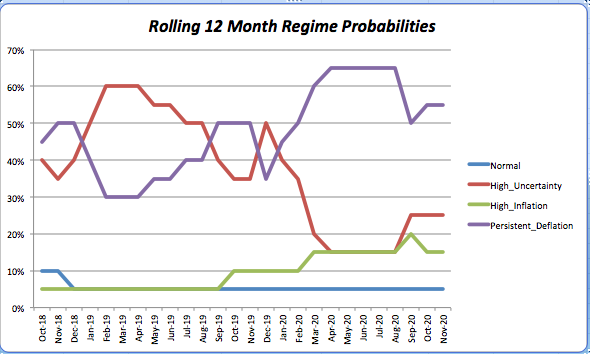
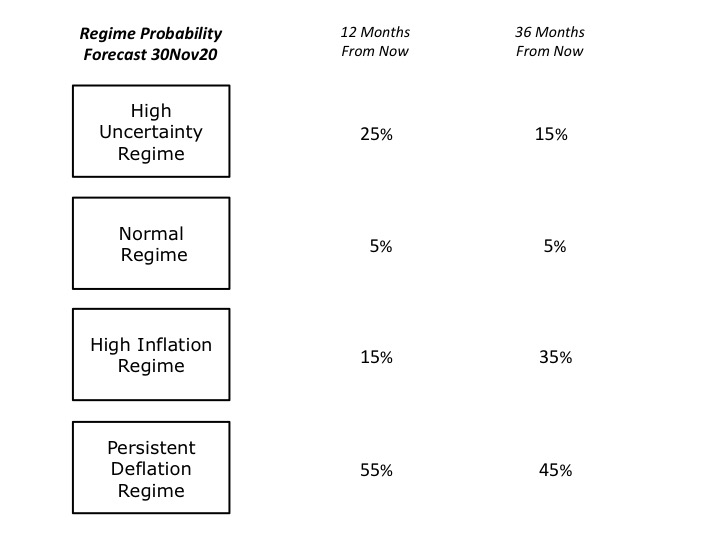
Our 12-month regime forecast probabilities did not change this month. The estimated probability of the Persistent Deflation Regime is still 55%. The probability of being in the High Uncertainty Regime remained at 25%. The probability of the High Inflation Regime is 15%. And the estimated probability of being in the Normal Regime remained unchanged at 5%.
The only change to our 36-month time horizon forecast is an increase in the probability of the High Inflation Regime from 30% to 35%, and a decrease in the probability of the Persistent Deflation Regime from 50% to 45%. The probability of being in the High Uncertainty Regime remains 15%, and the probability of being in the Normal Regime remains 5%.
In assessing the current situation, we again emphasize that uncertainty remains very high. Under these conditions, people rely more heavily on social learning and copying what others are doing than they do on their own private information and views.
This not only slows the diffusion of new information throughout social systems like economies and financial markets, but also causes these systems to coalesce around a small number of narratives. However, as tension increases on various fault lines in the system, the dominant narrative or narrative grows increasingly fragile.
Under these conditions, rapid, non-linear changes are very likely to occur, that are out of proportion to the apparent trigger that sets them off.
Forecast Logic: Quantitative Indicators
Implications of the Most Recent Three Month Asset Class Returns
Our forecasting methodology also includes quantitative analyses of asset class valuations, market stress indicators, and the level and change in three-month returns, over the most recent and previous three-month periods, for those asset classes, which should perform best under different regimes (in this sense, our regimes can be regarded as macro factors).
We assume that that the rolling three month returns reflect investors’ views regarding the relative probability that a given macro regime will develop in the future.
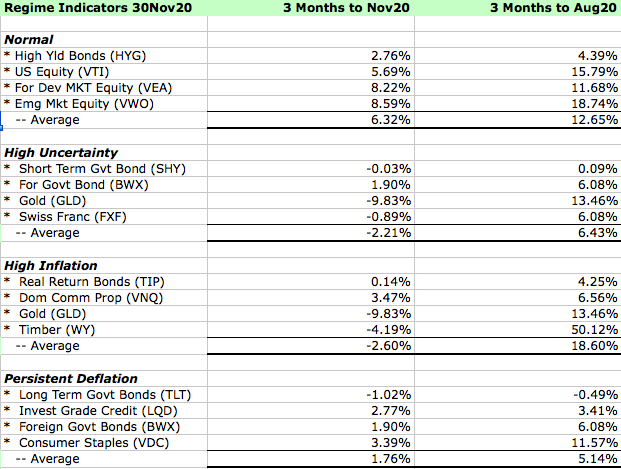
At the end of last month, rolling three-month returns on different asset classes implied that the dominant investor narrative still favors a return to the Normal Regime. However, this narrative has weakened over the most recent three month window, as has the narrative supporting the High Inflation Regime In relative terms the narrative supporting the Persistent Deflation Regime has strengthened.
Asset Class Valuation and Momentum Indicators (@30Nov20)
| Asset Class (ETF) | Valuation | 1 Month Return | Conclusion |
| US Real Return Govt Bond (TIP) | Almost Certainly Overpriced* | 1.20% | Increasing Overvaluation |
| US Nom Return Govt Bond (GOVT) | Likely Overpriced* | 0.51% | Increasing Overvaluation |
| US Investment Grade Credit (LQD) | Within Fairly Priced Range* | 3.76% | Fairly Valued |
| US High Yield Credit (HYG) | Almost Certainly Overpriced* | 3.34% | Increasing Overvaluation |
| US Commercial Property (VNQ) | Within Fairly Priced Range* | 9.67% | Fairly Valued |
| US Equity (VTI) | Almost Certainly Overpriced* | 11.80% | Increasing Overvaluation |
| Foreign Devel Mkt Equity (VEA) | Likely Overpriced* | 14.30% | Increasing Overvaluation |
| Emerging Markets Equity (VWO) | Almost Certainly Overpriced* | 8.56% | Increasing Overvaluation |
| Timber (WY) | Within Fairly Priced Range (Dividend has Resumed) | 6.41% | Fairly Valued |
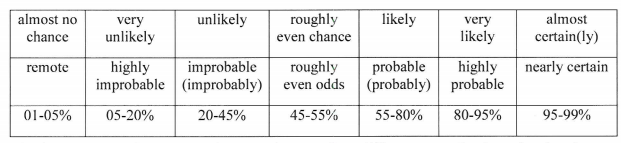
Note: The language we use to describe our estimated likelihood of asset class over or undervaluation is based on US Intelligence Community Directive 203 on Analytic Standards, which includes the following table:
Market Stress Indicators (@30Nov20)
| Market Stress Indicator | This Month vs Last Month |
| Asset Class Returns Autocorrelation (this month versus last month). Higher autocorrelation is an indicator of more tightly coupled and fragile markets. | .54 vs .41 the previous month. This indicates an increase in the level of market stress. |
| Economic Policy Uncertainty Index (how many days over the last 30 was index in top quartile of values since 1985?). A higher number equals more market stress. | On 29 days last month the index was in the top quartile of daily values since 1985 (the 99th percentile of all rolling 30-day periods). |
| AAA Rated Bonds Spread over 10 Year Treasury Yield (month end). Higher spreads indicate rising concern about market liquidity. | 1.36% (54th percentile since 1983), vs 1.51% (64th) at the end of the previous month, indicating a decreasing level of market stress. |
| BB Rated Bonds Spread over 10 Year Treasury Yield (month end). High spreads indicate increasing credit risk. | 3.08%, (45th percentile) down from 3.84% (61st) last month, indicating a decreasing level of stress. Given our Regime forecast, this is almost certainly inadequate compensation for the risk being taken with BB rated bonds. |
| Gold Price per Ounce in US Dollars (month end). Rising gold prices are an indicator of increasing market uncertainty and stress. | $1,772 vs $1,876, essentially unchanged from the previous month. At the end of 2017, we estimated the “disaster premium” in the gold price was 47% (see our methodology in the Appendix). At the end of last month it was 84%, down from 92% the previous month. |
Portfolio Allocation Implications of Our Forecast
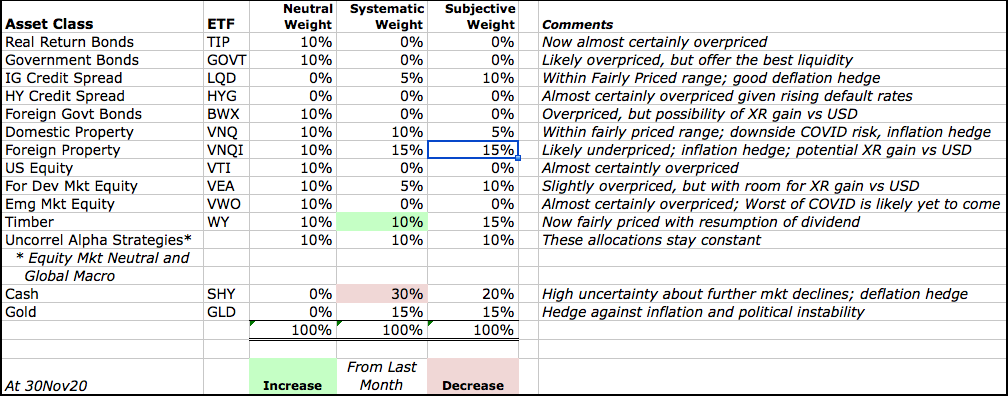
We take two approaches to deriving the tactical asset allocation implications from our analyses (i.e., deviations from our "neutral" or base case model portfolio).
The first takes a systematic approach, and is based on relative asset class valuations. Our starting point is our neutral model portfolio, which is equally weighted across nine broad asset classes, and also includes 5% allocations to alpha strategies (equity market neutral and global macro) that are designed to have a low correlation to returns on broad asset classes.
Based on asset class valuations, we systematically vary the asset class weights (but not the active strategy weight), increasing from 10% to 15% when an asset class is likely undervalued, and 15% when it is very likely undervalued. In the case of overvaluations, we go to 5% and then into cash, if there are no undervalued asset classes with room for an increase. In effect, this replicates the systematic rebalancing strategy we used for 15 years in our previous model portfolios.Based on subscriber requests, this month we are re-introducing a feature from the previous version of The Index Investor: Tactical Asset Allocation Implications from our analyses.
The second tactical approach is based on our subjective view not only of current asset class valuations, but also of the implications of the broader macro trends and uncertainties that we analyze each month. Importantly, this subjective view reflects our primary goal of avoiding large downside losses, rather than seeking large upside gains.
Three final notes: First, with respect to US fixed income, we include credit products (investment grade and high yield) in the same asset class as government debt, and will shift into the former when their valuations become attractive.
Second, we regard gold not as a separate asset class to be held long-term, but rather as a complement to cash, into which we shift in periods of substantial overvaluation across multiple asset classes.
Third, we continue to be deeply concerned by the distortion in asset class valuations that have been created by negative real interest rates on sovereign bonds, which are the foundation of most asset pricing models. In August, we decided to address this distortion by using in our asset class valuation models our estimate of the economically logical real yield on inflation protected US government bonds (TIPs). This brings our quantitative valuation conclusions much closer to those based on our qualitative analysis.
More information about our investment beliefs, including our core philosophy, approach to asset allocation (including our model portfolios and their long-term track record), and views on various approaches to active and passive management can all be found here.
Here is our latest asset allocation view:
Pre-Mortem Analysis
One of the most important forecasting disciplines is to ask yourself why your forecast could be wrong. Dr. Gary Klein’s research has shown that a very powerful and insightful way to do this is via a “pre-mortem analysis.” This method asks you to assume that it is a point in the future, and your forecast has been proven wrong (or your strategy or company has failed). You are then asked to look backward from this imagined point in the future, to explain why you failed, what you missed, and what you could have done differently to avoid your fate.
The pre-mortem method takes advantage of the fact that humans reason much more concretely and in more detail when explaining the past than they do when trying to forecast the future.
So let us assume that it is one year from now, and our current forecast has turned out to be wrong.
How did this happen? What developments did we fail to anticipate?
- A number of world leaders – Xi Jinping and to a lesser extent Vladimir Putin and Ali Khamenei are all facing sharply weakened economies and declining political popularity. History teaches us that this can lead to increased “foreign adventurism” to distract the public from worsening domestic conditions, as a nation rallies around its leader in a period of heightened external conflict. Should a “kinetic” conflict develop between China and the United States, or Iran and Israel, Saudi Arabia, and/ or the US, or between Russia and one or more European countries (e.g., due to a Russian incursion into the Baltics), it would generate a very sharp increase in uncertainty that would likely accelerate the already sharp COVID-19 economic slowdown. Given given high debt levels, this would very likely accelerate the arrival of the Persistent Deflation Regime.
- On the other hand, following the election of Joe Biden, the removal from office Xi Jinping could lead to a reduction in the dangerously growing conflict between the US and China. The impact of this surprise seems uncertain. To the extent that reduced external threat reduces the perceived urgency of implementing structural reforms in the US, it would increase the probability of the High Inflation Regime. Yet at the same time, it could accelerate economic and political reforms in China, which would increase economic growth there, creating a more dangerous medium term situation for the United States.
- A supply side shock of some type – beyond the disruption of global supply chains caused by COVID-19 -- could produce a sudden increase in inflation. The most likely scenario is a reduction in oil supplies due to a prolonged kinetic conflict between Iran and the US. An unlikely scenario could be major crop failures associated with the next solar cycle, which NASA forecasts will be the weakest in 200 years. McKinsey recently concluded that the probability of such a failure has increased due to changes in the environment, and now stands at about 10% over the next five years ("Will the World’s Breadbaskets Become Less Reliable?”).
Note: Combining Our Forecasts with Others From Other Sources and Extremizing the Result Should Increase Your Predictive Accuracy
Research has found that three steps can improve forecast accuracy. The first is seeking forecasts based on different forecasting methodologies, or prepared by forecasters with significantly different backgrounds (as a proxy for different mental models and information). The second is combining those forecasts (using a simple average if few are included, or the median if many are). The final step, which significantly improved the performance of the Good Judgment Project team in the IARPA forecasting tournament, is to “extremize” the average (mean) or median forecast by moving it closer to 0% or 100%.
Forecasts for binary events (e.g., the probability an event will or will not happen within a given time frame) are most useful to decision makers when they are closer to 0% or 100% than the uninformative “coin toss” 50%. As described by Baron et al in “Two Reasons to Make Aggregated Probability Forecasts More Extreme”, forecasters will often shrink their probability estimates towards 50% to take into account their subjective belief about the extent of potentially useful information that they are missing.
When you average multiple forecasters’ estimates, you are including more information, which should increase forecast confidence and push the mean estimate closer to 0% or 100%. However, this doesn’t happen when you use simple averaging. For this reason, forecast accuracy is increased when you employ a structured “extremizing” technique to move the mean estimate closer to 0% or 100%.
You can download an extremizing model from our website to use when combining the forecasts you use in your decision process.
The extremizing factors in our model are those that the Good Judgment Project found maximized the accuracy of combined forecasts. Note that the extremizing factor is lower when average forecaster expertise is higher. This is based on the assumption that a group of expert forecasters will incorporate more of the full amount of potentially useful information than will novice forecasters.
Feature Article: The Case Against Bitcoin
Last month, Nate Horsey, our guest analyst, presented the case in favor of investing in Bitcoin (BTC). This month, we present the case against BTC, either as money or an asset class.
A common definition of money meets three tests:
• It is a means of payment
• It is a store of value
• It is a unit of account.
Does Bitcoin meet them?
As a means of payment, BTC transactions and take longer to finalize than payments made with currency, debit and credit cards, and digital means like Apple Pay, Google Wallet, or PayPal (which are linked to default card or bank account). Moreover, most merchants do not accept payments in Bitcoin today.
Bitcoin transaction costs are also much higher that those for other means of payment, and there appear to be substantial barriers to reducing them (e.g., “Beyond The Doomsday Economics Of “Proof-Of-Work” In Cryptocurrencies”, by Raphael Auer of the Bank for International Settlements).
On the other hand, Bitcoin does have one attractive feature as a means of payment: Privacy. For this reason, it has become a favorite means of payment for money launderers, illicit transactions on the dark web, and ransom payments of various types (e.g., to cyber hackers who have taken control of an organization’s computer system).
Bitcoin as a store of value suffers from the very high volatility of its price (which also limits its utility as a means of payment, given the cost to retailers of constantly adjusting prices specified in BTC). Bitcoing is therefore better described as an investable asset than as money.
High price volatility also restricts the usefulness of BTS as a unit of account.
This is similar to the problems that arise in countries experiencing hyperinflation – once inflation rises above a certain level, accounting (and staying solvent) become fulltime, high anxiety challenges for governments, businesses, and individuals. It is for this reason that at some point, “dollarization” occurs, either officially or unofficially. Businesses start to keep two sets of books, one in dollars and one in local currency, and to the extent possible try to price their cash flows in dollars to maintain an accurate understanding of the economic condition of the business.
On the other hand, there is sometimes insight to be gained by measuring financial flows and stocks using something other than fiat money (e.g., the US Dollar or Euro) as a unit of account.
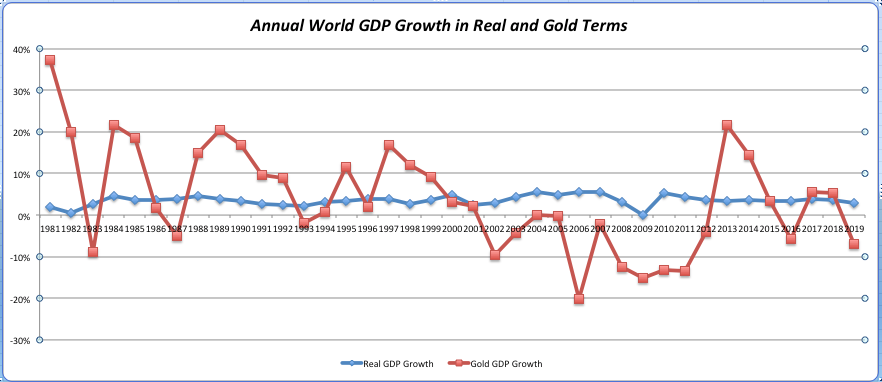
For example, the chart below shows annual world GDP growth expressed in both inflation-adjusted US dollar terms (i.e., real GDP growth) and in terms of gold. The latter calculation is divides each year’s nominal world GDP by the average price of gold for that year, producing World GDP expressed in gold ounces, and annual change in “gold GDP”.
While real GDP adjusts nominal GDP for changes in inflation, gold GDP adjusts if for changes not just in inflation (which is one driver of the price of gold), but also for changes in the perceived risk of future “tail event” or catastrophic risks (which is another driver of the price of gold).
To be sure, “gold GDP growth” is a noisy measure. But as you can see from the chart, it is also one that has been a useful early warning indicator.
At this point, almost certainly not.
To be sure, neither BTC nor gold provides any current return, which effectively makes it impossible to determine either one’s fundamental value. Yet gold has a much longer price history than BTC, and factors affecting its price are much better understood (e.g., changes in and cost of supply, availability of substitutes, demand drivers like industrial and jewelry uses, central bank, and investor demand, etc.).
In contrast, the price of BTC is far less anchored to any aspect of either history or the real economy. As a result, the BTC’s price almost certainly reflects the state of speculation, rather than a forward looking assessment of certain tail risks.
On balance, the weight of evidence supports the conclusion that Bitcoin is not money, as traditionally defined (e.g., “Bitcoin Is Not a New Type of Money”, by Lee and Martin from the Federal Reserve Bank of New York).
Now let’s turn to BTC as an asset class.
Technically, the asset class is more accurately described as cryptocurrencies or cryptoassets, as there are others besides Bitcoin (e.g., Ethereum). BTC currently accounts for about two thirds of the total market cap of all cryptoassets.
The most important problem with cryptoassets as an asset class is the challenge in valuing them.
A number of approaches have been tried.
The first is classic discounted cash flow valuation. Unfortunately, this requires both a stream of cash flows, and some estimate of terminal value that can be discounted to the present using an appropriate discount rate. As in the case of fine art and gold, these don’t exist.
The second is relative valuation. This involves dividing some numerator by the maximum of 21 million bitcoins that can exist to arrive at an estimate of a bitcoin’s value. There are multiple problems with this approach. What is the right numerator to use? I’ve seen valuations based on the total value of global fiat money supply (using various definitions of that quantity), the market value of the world’s gold supply, and the estimated value of annual illegal transactions for which Bitcoin is the preferred means of payment. As you would expect, that yields a range of BTC valuation estimates that are all over the map.
Another problems with this approach lies in its assumption of a fixed denominator. In reality, while the total amount of Bitcoins may be fixed, there is no limit on growth in the supply of similar crytoasses, like Etherium.
The third starts with the assumption that, because of the impossibility of fundamentally valuing it, Bitcoin is a purely speculative asset, whose value is determined solely by social interactions, as in the classic Keynesian “Beauty Contest” game. Given this assumption, a variety of machine learning and social network methods can be used to try to predict BTC’s future booms, busts, and prices over different time horizons.
Even if it is hard/impossible to value with any degree of accuracy, another claim that has been advanced in favor of Bitcoin as an asset class is its value in hedging certain risks.
The first is an unexpected increase in inflation. However, no evidence has been advanced to show that BTC provides superior protection against this contingency, especially in comparison to equities, property, and (especially when inflation is above 5% annually), gold.
The second is a catastrophic breakdown in confidence in fiat currencies issued by governments, as would occur in the case of widespread hyperinflation. Again, no evidence has been put forward to show why cryptoassets would provide better protection than traditional refuges from catastrophe risk, like physical gold and directly owned property. In fact, because of its dependence on functioning global information technology and communications (ITC) systems, one can make the argument that BTC is an inferior hedge against extreme catastrophe risks (e.g., a solar storm or cyberattack that knocks out much of Earth’s ITC infrastructure).
So, to conclude.
Bitcoin is not money.
Bitcoin (and crypto assets more generally) is not an asset class.
In essence, BTC is a vehicle for pure speculation and betting on human nature, similar to a classical Keynesian “beauty contest”.
As such, Bitcoin offers the opportunity for significant active management profits (and losses), assuming an investor can predict the future beliefs, feelings, and decision of the crowd with a degree of skill that goes beyond simple luck, the skills of other humans, and the capabilities of algorithms.
High Value Information Observed In November 2020
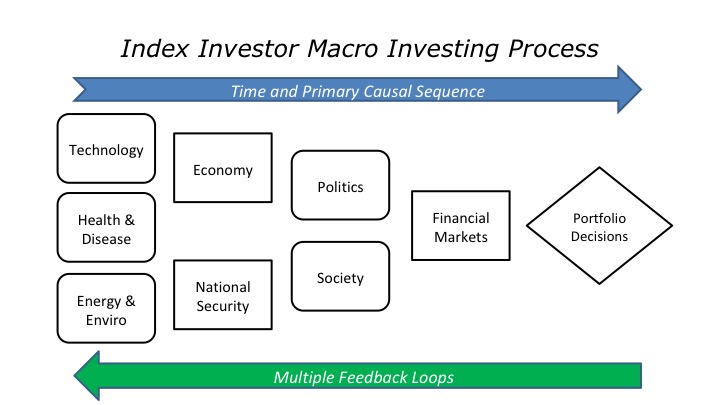
In our model of the complex global macro system, change drivers are arrayed across a roughly chronological process (albeit one with many feedback loops), in which technological, health, and environmental changes precede changes in the economy and national security, which in turn lead to changes in society and politics, all of which produce (albeit with multiple feedback loops) the effects we observe in investor behavior and financial market valuations and returns.
To generate alternative future scenarios and critical forecasting questions,we use this framework to identify multiple paths across these issue areas, including alternative outcomes for critical uncertainties.
In our methodology, we take a Bayesian approach, and classify new information as significant and highly valuable if either it (1) is an “indicator”, which reduces our uncertainty about the value of a parameter in our mental model for making sense of the dynamic macro system, or (2) it is a “surprise” which increases our uncertainty about either the range of potential values for a parameter or the structure of our model.
With respect to indicators, the higher our priori probability is for a regime, the more we look for indicators that it will not occur, and the lower our prior probability for a regime, the more we look for indicators that it will occur. Put differently, try to systematically search for high value indicators that disconfirm our prior views.
| New Technology Information: Indicators and Surprises | Why Is This Information Valuable? |
| “Smart Home Revolution Tests Legal Liability Regimes”, by Adam Green in the Financial Times | “When technology goes wrong — such as smart doorbells catching fire — the legal ramifications can be hazy. Many consumer products are not merely internet-connected but also have the ability to adapt, thanks to algorithms and machine learning. “’Autonomy and self-learning mean smart products are designed to evolve,’ says Rod Freeman, a product liability lawyer at law firm Cooley. The definition of a product is becoming fuzzier as layers of software are woven into devices, and it may be unclear who is at fault for an accident or failure, he says.” Anybody who has ever managed a high-risk project with multiple subcontractors (examples from my experience include large LNG projects and drilling complicated gas wells) knows that allocating responsibility for the liability associated with different risks is a very non-trivial issue. The potential obstacles this poses for deployment of the Internet-of-Things (IoT) is almost certainly underestimated by many companies and customers. |
| “Inductive Biases for Deep Learning of Higher-Level Cognition” by Goyal and Bengio | The authors are two leading AI theorist/practitioners, who have written an important paper about challenges still to be met on the way to artificial general intelligence. They note, “deep learning brought remarkable progress but needs to be extended in qualitative and not just quantitative ways (larger datasets and more computing resources). We argue that having larger and more diverse datasets is important but insufficient… “We make the case that evolutionary forces, the interactions between multiple agents, the non-stationary and competition systems put pressure on the learner to achieve the kind of flexibility, robustness and ability to adapt quickly which humans seem to have when they are faced with new environments. “In addition to thinking about the learning advantage, this paper focuses on knowledge representation in neural networks, with the idea that by decomposing knowledge in small pieces which can be recomposed dynamically as needed (to reason, imagine or explain at an explicit level), one may achieve the kind of systematic generalization which humans enjoy and is obvious in natural language.” |
| “What AI Can Do for Football [Soccer] and What Football Can Do for AI”, by Tuyls et al from DeepMind | Many people lack a familiar context within which they can understand the profound impact that artificial intelligence as a general purpose technology will almost certainly have in the coming years. This paper provides that context (sports) and shows how the application of multiple AI and other advanced technologies are already having a profound impact. |
| “Underspecification Presents Challenges for Credibility in Modern Machine Learning”, by D’Amour et al, and “A Review of Uncertainty Quantification in Deep Learning: Techniques, Applications, and Challenges”, by Abdar et al | It is one thing to develop and deploy AI tools; it is another for human beings to trust them in actual use. These two papers approach the trust in AI issue by opening up the black box, so to speak. D’Amour and his colleagues highlight the sources of imperfect categorization and prediction in current machine learning models. Abdar and his colleagues focus on a critical issue related to human trust in AI models – the extent to which they quantify the degree (and ideally the sources) of uncertainty associated with their results. |
| | |
| | |
| | |
| | |
| | |
| | |
| | |
| | |
| | |
| New Energy and Environment Information: Indicators and Surprises | Why Is This Information Valuable? |
| “From Passive To Active: Flexibility From Electric Vehicles In The Context Of Transmission System Development”, by Gunkel et al “Molehills Into Mountains: Transitional Pressures From Household PV Battery Adoption Under Flat Retail And Feed-In Tariffs”, by Say and John “Energy Suppliers Search for ‘Inertia’ to Power a Greener Future”, by John Dizard in the Financial Times | SURPRISE Increasing electrification of the transport sector, though greater penetration of electric vehicles (EVs), is not only increasing electricity demand (a typical EV doubles household electricity usage), but also shifting its distribution over time (e.g., due to greater demand for vehicle charging overnight). This paper finds that, given current charging patterns, EV penetration of 30% or more will create significant problems for control of electrical grids. The second paper makes a similar point about the grid control issues that are emerging due to increasing growth of household combined photovoltaic and battery storage (PVS) systems. Finally, the FT’s John Dizard offers this typically pithy observation: “It is deeply moving to hear announcements of aggressive decarbonisation targets, and it must be deeply gratifying for politicians, such as Boris Johnson, to make them. It is also deeply disturbing to find how little the political and financial leadership understands about what it will take to hit them.” In his column, Dizard delves into the details of why grid stability becomes exponentially more difficult to maintain as more variable renewable generation (e.g., solar and wind) is added to it. For a more technical review of grid control issues when the share of variable renewable generation is high, see, “Modeling The Dynamics And Control Of Power Systems With High Share Of Renewable Energies”, by Auer and Kittel. |
| “How PV-Plus-Storage [PVS] Will Compete With Gas Generation in the US”, by Bloomberg New Energy Finance | This new report paints an optimistic picture of PVS replacing a substantial portion of the current fleet of natural gas generation plants that only come online to meet peak electricity demand. However, it is based on two sets of quite optimistic assumptions: (1) the speed of development and deployment of reliable grid-scale battery storage; and (2) the speed at which various grid control issues created by deployment of variable renewable generation (including battery storage) will be resolved at an acceptable price – e.g., see Dizard’s article noted above, and our August 2020 feature: “Joe Biden Wants to Remove Carbon From US Electricity Generation by 2035. Is That Realistic?” |
| “Banking On Coal? Drivers Of Demand For Chinese Overseas Investments In Coal In Bangladesh, India, Indonesia And Vietnam”, by Gallagher et al | SURPRISE As many observers have pointed out, it is essentially impossible to limit the growth of global emissions as long as China keeps building coal fired electricity generation plants at a torrid pace. The authors of this paper observe that this problem extends beyond China. They “investigate why new coal-fired power plants are being financed and built in South and Southeast Asia, given that new coal plants without carbon capture and storage are incompatible with a 1.5 ◦C temperature goal. The paper particularly focuses on developing countries where these coal-fired power plants are being built that are recipients of Chinese government-backed finance” … “Field research was conducted in four recipient countries: India, Indonesia, Vietnam, and Bangladesh. We find that the demand for Chinese-backed coal plants in the four recipient countries is mainly driven by domestic policy that embraces a growth of coal-fired power in their economies. “Recipient country demand is well matched by China’s willingness to finance and export equipment and services to build new coal-fired power plants overseas. “In every case, there are explicit, preferential domestic policies for coal, and in at least one case renewables are disallowed by regulation from competing with coal on a level-playing field. None have environmental policies that would require cleaner or more efficient plants to be constructed and operated.” |
| “Ambient Heat and Human Sleep”, by Minor et al “The 2020 Report Of The Lancet Countdown On Health and Climate Change: Responding to Converging Crises”, by Watts et al in The Lancet | SURPRISE Minor et al note that, “rising nighttime temperatures shorten within-person sleep duration primarily through delayed onset, increasing the probability of insufficient sleep. The effect of temperature on sleep loss is substantially larger for residents from lower income countries and older adults, and females are affected more than are males. Nighttime temperature increases inflict the greatest sleep loss during summer and fall months, and we do not find evidence of short-term acclimatization.” Among other conclusions, Watts et all find that, “Vulnerable populations were exposed to an additional 475 million heatwave events globally in 2019, which was, in turn, reflected in excess morbidity and mortality. During the past 20 years, there has been a 53·7% increase in heat-related mortality in people older than 65 years… “The high cost in terms of human lives and suffering is associated with effects on economic output, with 302 billion hours of potential labour capacity lost in 2019. India and Indonesia were among the worst affected countries, seeing losses of potential labour capacity equivalent to 4–6% of their annual gross domestic product. “In Europe in 2018, the monetised cost of heat-related mortality was equivalent to 1·2% of regional gross national income.” |
| | |
| | |
| | |
| | |
| | |
| | |
| | |
| | |
| | |
| New Economic Information: Indicators and Surprises | Why Is This Information Valuable? |
| “ECB warns banks are ‘all over the place’ on bad loan preparations”, by Arnold and Vincent in the Financial Times | SURPRISE “Europe’s top banking supervisor is writing to the region’s biggest lenders to warn that many of them are failing to do enough to prepare for a likely increase in bad loans due to the fallout from the coronavirus pandemic.” And that doesn’t include the extent to which they are prepared for another Eurozone sovereign debt crisis, especially one involving Italy, whose government bonds are owned by many banks, and which carry no capital requirement (because they are in theory “riskless”). Note too that holdings of Italian government bonds now amount to more than 11% of Italian banks’ total assets, and that by the end of the year, Italy’s debt/GDP ratio is projected to reach 160% (e.g., see, “Italy Debt Could Spin Out of Control Unless Growth Picks Up” by Albanese and Follain). For an in-depth discussion of the many challenges facing the Italian economy, see “Will Italy Recover?” by Papadimitriou et al. |
| In “Why economics needs to wake up to aging populations”, the FT’s Diane Coyle reviewed a new book, The Great Demographic Reversal, by Goodhart and Pradhan | Coyle begins with an observation with which we strongly agree: “Economics generally pays surprisingly little attention to demography, even though the ageing and shrinking of the population in so many parts of the world is a striking and new phenomenon in human history. “Take Italy. Last year the country recorded the smallest annual number of births since the Risorgimento of the mid-19th century and nearly a third of its population is over 60. There has been an absolute decline in the number of people in Italy since 2015, even accounting for net inward migration. It is an extreme case, but the rest of the west, most of eastern Europe and China will follow. “Yet in economics, humans are abstracted as “labour input”, substitutable by machines, while demographic trends occur beyond the time horizon of macroeconomic models” … If a nation wants to both service its debt and provide a rising standard of living to its residents, a declining working age population leaves it with three choices: (1) Increase the rate of workforce participation; (2) Increase immigration; and/or (3) Increase labor force productivity. None of these is easy. Coyle notes that Goodhart and Pradhan “make some strong predictions: The old, at their late stage in the life cycle, don’t save, but spend, so savings “gluts” of the kind thought to have paved the way for today’s low interest rates will vanish as populations age. Nominal interest rates will rise and so will inflation — mainly because of labour shortages and wage pressures.” However, Coyle also notes that the authors “don’t engage much with the scope for a turnaround in productivity growth, or with the deflationary tendencies clearly associated with technologies as they bring down prices of many goods and services.” |
| “Evidence of Accelerating Mismeasurement of Growth and Inflation in the U.S. in the 21st Century”, by Leonard Nakamura from the Federal Reserve Bank of Philadelphia | SURPRISE In this fascinating paper, the author notes that, “a central problem that we face in measuring the economy is the rising economic importance of knowledge and creativity, as the economy focuses on intangible assets, and that these are increasingly digitizable due to the Internet. Once in digital form, reproduction of many products is virtually costless. In a modeled economy in which prices represent marginal resource costs, such goods have zero prices and disappear from GDP. In practice, new business models that accommodate these products make the quantification of consumer welfare and productivity more difficult.” This means that, “increasingly, economic progress is taking forms that are not readily measured in the U.S. gross domestic product (GDP) accounts. Consequently, Nakaumura “seeks to explore the possibility that economic growth in the U.S. is substantially faster in the 21st century than currently measured in U.S. national income accounts data, and that inflation is substantially slower, indeed, that the U.S. has generally been deflating since the Great Recession”, in the manner of the “healthy” productivity and supply growth led “good deflations” of the 19th century. He “points to evidence across many product areas that rapid progress is occurring. This raises the possibility that not only did U.S. growth and productivity accelerate after 1995, they have possibly continued strongly after 2005 and there has been no secular stagnation.” |
| Multiple articles have noted the challenges facing economies after the temporary support programs put in place for COVID run out. | For many companies, already high debt loads have further increased (e.g., see, “Global Waves of Debt” by the World Bank, and “Pandemic Fuels Global Debt Tsunami” by Jonathan Wheatley in the Financial Times). Many businesses have already closed and jobs have been permanently lost. In the case of small businesses, the owner’s equity – often reflecting their lifetime savings – has been wiped out. In the absence of grant or equity funding (e.g., from a government investment bank), they lack the funds to reopen. If their abandoned locations are taken over by larger companies that obtained government supports, there will be political hell to pay. There is also growing evidence that constraints in the current institutional process for restructuring debt could lead to increasing disorder, as the insolvency crisis grows (e.g., see, “Sizing up Corporate Restructuring in the COVID Crisis”, by Greenwood et al). Many employees who have lost their jobs will need reskilling to remain employable in a rapidly evolving economy. Yet in most places, these programs are woefully undeveloped and/or ineffective. Too often I read policy reports claiming that more reskilling, retraining, and liftetime learning are critical to maintaining many people’s “employability” in an age of rapid technological improvement. But I see few that get into the weeds about how hard this has been do to on the ground, where different organizations fiercely protect their turf, while ignoring the larger consequences of their actions. This does not bode well for delivering the education and productivity improvements that are critical to avoiding both deflation and high inflation. |
| “The Future of Work: Building Better Jobs in the Age of Intelligent Machines”, Final Report of the MIT Future of Work Project “Global survey: The State of AI in 2020”, by McKinsey & Co. “The Future of Work: Meaningful Integration or Jobless Future?” INET Webinar with Daron Acemoglu | SURPRISE A growing number of analyses are focusing on the implications of the gap between the rate at which AI and automation technologies are improving, and the rate at which employees’ and students’ knowledge and skills are growing. Acemoglu notes that historically the introduction of new technology has not only displaced workers, but also created new jobs requiring new knowledge and skills (what he calls “reinstatement”). He observes that historically, job displacement and reinstatement balanced out, sometimes with a time lag. However, since 1980, this process has broken down, with displacements exceeding reinstatements. Acemoglu notes that this has coincided with slower productivity growth and increasing inequality. He also highlighted how the current US tax system makes it cheaper for companies (on an after tax basis) to invest in capital (e.g., automation) rather than labor. Similarly, he noted how increasing automation may lead to increasing strife in emerging markets, where low cost, labor intensive manufacturing has been a traditional source of employment and socio-economic mobility. The final report from MIT’s Future of Work project, covers issues raised by Acemoglu (and others) in much more depth. One of its key conclusions is that “enabling workers to remain productive in a continuously evolving workplace requires empowering them with excellent skills programs at all stages of life: in primary and secondary schools, in vocational and college programs, and in ongoing adult training programs.” But MIT also concludes, that, “the distinctive U.S. system for worker training has many shortcomings.” If you’ve spent anytime trying to deal with this system that will almost certainly strike you as a gross understatement of the challenges we face with respect to continually improving labor force knowledge and skills. The good news in the MIT report is that “momentous impacts of technological change are unfolding gradually.” This was also highlighted by McKinsey, in its most recent overview of the state of AI is that deployment of advance technologies is still happening relatively slowly, because of the time it takes to change organizations to realize their full benefits. In theory, this creates the time we need to increase the rate of job reinstatement by accelerating the acquisition of requisite knowledge and skills by current and future workers, if (and it’s a big if) the challenges that entails can be overcome. On the other hand, McKinsey also found that companies at the leading edge of deploying advanced technologies are pulling away from their competitors, creating another source of inequality. |
| | |
| | |
| | |
| | |
| | |
| | |
| | |
| | |
| | |
| | |
| | |
| | |
| | |
| | |
| New National Security Information: Indicators and Surprises | Why Is This Information Valuable? |
| “The U.S. Navy’s Loss of Command of the Seas to China and How to Regain It”, by Joe Sestak | Sestak was a career Navy officer and later a member of the US House of Representatives. “For the collective good of all nations, American command of the earth’s oceans has also provided the bedrock for a globalized economy where 80 percent of the volume and 70 percent of the value of all trade transits safely on the sea. “But the U.S. Navy has now lost its assured command of the seas — for the first time in the post-World War II era — to China in the Western Pacific… “China’s pace of war is the speed of light through cyberspace, leaving U.S. forces blind and deaf, while America’s is 30 knots, taking weeks to arrive at the fight. A fundamental shift in mindset needs to be made. The focus should no longer be on the number of hulls, but on a return to the plan for a capabilities-based, more forward force posture, primarily by commanding cyberspace in order to regain command of the seas.” |
| “US-China Relations: Shooting Down Of Mock ICBM Was Warning To Beijing”, South China Morning Post, 18Nov20 | SUPRRISE The United States was sending a clear message to China on Tuesday when it shot down a mock intercontinental ballistic missile (ICBM) over the Pacific Ocean, military experts said. “The SM-3 Block IIA interceptor test could be seen as a response to China launching two ‘aircraft carrier killer’ missiles into the South China Sea,” Beijing-based military expert Zhou Chenming said |
| “A Hard Look At Hard Power: Assessing The Defense Capabilities Of Key US Allies And Security Partners”, by Gary Schmitt, published by the US Army War College Press | SURPRISE Due to constraints on the US defense budget, Schmitt writes that, “the strategic requirement for allies and partners is greater now than at any time since the end of the Cold War. This need, however, must be filled by allies and partners who can pull their weight militarily if the United States is going to be able to defend the American homeland, protect vital interests abroad, and maintain a favorable balance of power in critical regions of the world.” The book’s overarching conclusion is that, “translating American and allied economic power into military preeminence and maintaining it globally has been difficult.” And that was before COVID arrived. |
| | |
| | |
| “Moving Beyond A2/AD”, by Chris Dougherty | SUPRRISE “Chinese and Russian military thinking about fighting the United States centers on…maintaining their advantage in a given theater for long enough to seize their objectives, then terminating the conflict on favorable terms. By exploiting temporal advantage (ETA) in this way, China and Russia can plausibly seize their objectives while avoiding a fight or, if necessary, by fighting at a distinct advantage in the correlation of forces” … “Both China and Russia believe that the “initial period of war” likely determines the outcome, and therefore place a great deal of emphasis on preparatory, preemptive, or rapid actions to create a favorable correlation of forces in the combat theater. In competition (or confrontation, in their vernacular), they manipulate time, either by moving slowly or deniably to avoid provoking a response (e.g., Chinese island building in the South China Sea), or by moving quickly in areas where policies are unclear and potential responses are too slow or ineffectual (e.g., Russia’s seizure of Crimea)” … “The central aspect of time, and how to manipulate it to their benefit, is critical to the Chinese and Russian ways of war. However, with some exceptions, it remains relatively underappreciated in U.S. discourse. “Rather than thinking about countering specific systems or behaviors, the DoD should instead focus on a comprehensive set of actions to prevent China or Russia from gaining and exploiting a temporal advantage—or perceiving such an advantage—in which they could seize their objectives.” The author focused on four examples of China and Russia’s use of time. First, “information degradation and command (or cognitive) disruption (ID/CD) describes Chinese and Russian approaches toward gaining an advantage in the ability to gather, transmit, process, understand, and act on information in a timely and accurate manner. They achieve this goal largely by attacking critical systems in space, cyberspace, and the electromagnetic spectrum.” Second, “should the United States and its allies and partners choose to intervene in a potential conflict, China and Russia would seek to slow their response by contesting theater access and maneuver (CTAM). This is perhaps the line of effort most closely aligned with traditional conceptions of A2/AD, with the critical difference that CTAM makes clear that access and maneuver are contested on a spectrum of risk, rather than denied.” Third, “U.S. forces operating in Asia or Europe depend heavily on an enormous and vulnerable web of sustainment, logistics, and mobility assets to maintain their operational tempo and shift the correlation of forces to their advantage. Therefore, degrading sustainment, logistics, and mobility (DSLAM) is another critical aspect of Chinese and Russian ETA approaches.” Fourth, “China and Russia need a means to impose boundaries on a conflict or terminate it before they lose their temporal overmatch. To do this, they will use strategic actions to deter, coerce, and terminate (SADCAT). Such actions can take a wide variety of forms, including attacks on critical infrastructure, commercial assets, and employment of nuclear weapons or other forms of strategic attack. All these actions are intended to prevent the United States and its allies and partners from using escalation or their waxing temporal advantage to reverse Chinese or Russian gains. ID/CD pries the window open, CTAM and DSLAM open it further and hold it open, and then SADCAT slams it shut when China and Russia perceive that their advantage is waning.” |
| “Behind Xi Jinping’s Steely Façade, a Leadership Crisis Is Smoldering in China”, by Sarah Cooper | “Even after years of intensifying authoritarian rule under Chinese Communist Party (CCP) chief Xi Jinping, the 18-year prison term handed down in late September to real estate mogul and social media commentator Ren Zhiqiang — a de facto life sentence for the 69- year-old man — came as a shock to many inside and outside China. “Ren’s penalty was unusually harsh for a party insider with no political power or ambitions of his own, it fit a recent pattern in which the regime has lashed out with greater intensity against Xi’s perceived enemies within the ruling elite. The punitive actions and targets — particularly those in the party’s propaganda, education, and security systems — indicate that the party chief’s grip on power may not be as firm as it appears.” |
| China has launched a series of economic moves intended to put pressure on Australia, including tariffs on wine, restrictions on imports of barley, beef, and seafood, and refusal to allow ships bearing Australian coal to dock. | Reacting to these latest examples of China’s “Wolf Warrior” approach to diplomacy, the editorial board of the Financial Times noted “The worrying precedent in China’s quarrel with Australia.” “The rapid deterioration in the relationship between Beijing and Canberra is much more than a bilateral affair. It demonstrates how a more assertive China is now seeking to intimidate nations that are a long way from its shores…The treatment of Australia sets a worrying precedent since China is making demands that would impinge upon the country’s domestic system — affecting basic liberties such as freedom of speech”… China “has said further measures could be in the works, if Australia does not “correct its mistakes”. The corrections that Beijing is demanding are not simply to do with foreign policy or trade. In a 14-point memo handed to the Australian media outlining China’s grievances, Beijing also pointed to what it regards as hostile media reporting — as well as Australian government financing for think-tanks that have produced work Beijing dislikes. Unable to tolerate free speech at home, Beijing now appears intent on controlling speech overseas as well.” See also, “China sends a message with Australian crackdown: Pressure by Beijing offers a glimpse of the road map for a more illiberal order” by Richard McGregor in the FT. |
| “Continuous Purges: Xi’s Control of the Public Security Apparatus and the Changing Dynamics of CCP Elite Politics”, by Guoguang Wu | SURPRISE “This essay identifies three waves of purges in the Ministry of Public Security under the Xi Jinping leadership, and then focuses on the third wave, which, corresponding to similar measures beyond the public security system, featured the cleansing of those who rose to prominence due to their support of Xi’s earlier anti-corruption campaign. “Such a development whereby Xi turns his sword against his previous political allies indicates that continuous purges are becoming a new political dynamic in CCP elite politics. The essay finds that Xi’s prolonged tenure in power and the governance challenges he confronts are the two leading factors that have helped to shape China’s current proto- Maoist power struggles and elite politics. According to this line of reasoning, Xi’s ongoing efforts to control the public security apparatus indicates that CCP elite politics is becoming increasingly dominated by internal repression and coercive means.” |
| “Xi’s Aim To Double China’s Economy Is A Fantasy”, by Michael Pettis | SURPRISE “Every country that followed the high-savings, investment-led growth model that China adopted in the early 1990s — such as Japan in the 1970s and 1980s, or Brazil in the decade before — has gone through three distinct stages. “The first stage, characterised by heavy investment in badly-needed infrastructure, delivered many years of rapid but unbalanced growth. In that stage, debt grew in line with the economy because when debt mostly funds productive investment, gross domestic product grows faster than debt. “In the second stage, as each country sought to rebalance demand away from investment, typically with little success, growth remained fairly high, although now driven increasingly by non-productive investment. When this happens, total debt in the economy must grow faster than GDP. So the debt burden rose. “Finally in the third stage, the country either reached its debt capacity limits or a worried government took steps to prevent debt from rising further. Either way, the economy was forced finally to rebalance away from investment and towards consumption amid far slower, sometimes even negative, growth. “China today is clearly in the second stage. Between 1980 and 2010, Chinese GDP doubled four times, but debt levels were low and rose slowly. “However, between 2010 and 2020 when GDP doubled again, China did so by tripling its total debt burden to $43tn, so that it now stands, officially, at over 280 per cent of GDP. “Assume conservatively that the relationship between debt and growth doesn’t change, and China’s debt-to-GDP ratio will have to rise to over 400 per cent by 2035 if it is to double GDP again. This is a level that would be unprecedented in history. Everywhere else, growth collapsed long before debts reached levels close to this.” “China can in principle reduce its dependence on debt by shifting domestic demand from investment to consumption, as Beijing has long proposed. Yet this requires that the household income share of GDP rise from roughly 50 per cent today to at least 70 percent. “Beijing has long wanted to do this but with limited success, despite a decade of trying. “There is still little to suggest the party is willing to tackle the institutional implications of the large wealth transfer from local governments and elites to households this entails…as it will set off substantial and unpredictable political and social change.” |
| “The Wuhan Files: Leaked Documents Reveal China's Mishandling Of The Early Stages Of Covid-19”, by Nick Patton Walsh on CNN “The Party That Failed: An Insider Breaks With Beijing”, by Cai Xia in Foreign Affairs | These are both further indicators of growing domestic dissatisfaction within China, whose impact the CCP seeks to constrain through greater use of technology enabled systems of surveillance and repression. |
| One of Iran’s top nuclear scientists was assassinated. Also, Donald Trump was reported to have asked the Pentagon for a briefing on options for air strikes against Iran’s nuclear facilities. This is probably because Iran’s stockpile of enriched uranium is now reported to be 12 times the maximum allowed on the Iran nuclear accord from which the Trump administration withdrew the United States. | SURRPISE In addition to whether there will be a joint Israeli/US attack on Iran’s nuclear facilities before the Trump administration leaves office, and how Iran will retaliate for the assassination, there are two more uncertainties. The first is Iran’s willingness and ability to pursue the development of a nuclear weapon and delivery system. With a greater quantity of enriched uranium, this “time to breakout” has been reduced – pessimistic estimates have reduced it to as short a three months (when breakout is defined as having produced 25kg of weapons grade uranium, enough for one bomb). A more realistic definition of breakout would include constructing and testing a warhead and delivery system, and then constructing a number of deliverable weapons. However, the first test would almost certainly trigger aggressive retaliation by Israel, for which a nuclear-armed Iran is an existential threat that they have repeatedly said they will not tolerate. The second uncertainty is how Iran will respond to the incoming Biden administration’s expressed desire to rejoin the Iran nuclear accord, which would logically lead to lifting or relaxation of the crushing sanctions the Trump administration has imposed on the country. |
| | |
| | |
| New Health and Disease Information: Indicators and Surprises | Why Is This Information Valuable? |
| “UK Warns Of Threat From New Covid-19 Variant”, Financial Times | SURPRISE Blaming the sudden resurgence of COVID infections across Europe on nations “letting down their guard too soon” has always seemed just a bit too convenient. And now a new hypothesis has emerged. “According to Emma Hodcroft, an expert on viral genetics at the University of Bern in Switzerland, the new strain appears to have three mutations in the spike protein that the coronavirus uses to enter human cells. Two genetic letters have been deleted and another has been changed.” This is potentially a very serious development, as the mutation appears to be significant. It increases uncertainty about the efficacy of the new vaccines that have been announced, as well as the degree of immunity obtained via prior COVID infection. It also increases uncertainty about the speed at which the SARS-CoV-2 virus evolves. Up to now, the consensus seems to have been that this happens at a slower rate than the influenza virus (for which vaccine development is ongoing, and shots must be given annually to protect against new strains). In so far as this latest mutation (and the apparent increase in infections that it may have caused) is consistent with the general path of viral evolution, increased transmissibility is usually accompanied by a decrease in the severity of infections. |
| “Immunological Memory To SARS-Cov-2 Assessed For Greater Than Six Months After Infection”, by Dan et al | SURPRISE A critical uncertainty about the impact of COVID is how long immunity to it will likely last, either after recovery from infection or receipt of a vaccine. This new study of how different components of our immune system react to COVID finds that protection against SARS-CoV-2 is likely to last longer than previously thought, for six months and possibly much longer. However, immunity will also be affected by the future evolution of the SARS-CoV-2 virus. For example, because of the speed at which the influenza virus evolves, we need to get a different vaccine formulation each year. Time will tell whether that will be the case with SARS-CoV-2. |
| “Almost One in Five Americans May Have Been Infected with COVID-19” in The Economist | SURPRISE If this new analysis is true, we are closer to achieving herd immunity that previously thought, which means a vaccination program could reduce the rate of infection more quickly than expected. The herd immunity threshold is the percent of the population that has acquired immunity – either through infection or vaccination – that reduces the infection rate (reproduction number “R”) to a very low level. The simple formula for the threshold is 1-1/R. So for an R of 1.5 (i.e., each infected person infects 1.5 more people), the herd immunity threshold is 33% of the population; for R=2.0, it is 50%, and for R=2.5 it is 60%. To be sure, this simple formula is actually more complicated in practice (see references below). But in combination with last month’s news about vaccine effectiveness, the findings from the Economists’ analysis point towards a positive surprise. “COVID-19 Herd Immunity: Where Are We?” by Fontanet and Cauchemez, and “Difficult to Determine Herd Immunity Threshold for COVID-19”, by Rita Rubin. |
| “Mobility Network Models of COVID-19 Explain Inequities and Inform Reopening”, by Chang et al “Evidence of Long-Distance Droplet Transmission of SARS-CoV-2 by Direct Air Flow in a Restaurant in Korea”, by Kwon et al | These two new studies provides more evidence of the importance of careful management of HVAC and other indoor air quality variables to limit the transmission of SARS-CoV-2 in enclosed spaces. The first study combines mobile phone location data with actual infection data to better understand the spread of COVID-19 in ten large US cities. The authors find that, “a small minority of ‘superspreader’ points of interest [like indoor restaurants and fitness centers] account for a large majority of the infections, and that restricting the maximum occupancy at each point of interest is more effective than uniformly reducing mobility”… The model “also correctly predicts higher infection rates among disadvantaged racial and socioeconomic groups solely as the result of differences in mobility: we find that disadvantaged groups have not been able to reduce their mobility as sharply, and that the points of interest that they visit are more crowded and are therefore associated with higher infection risk.” The second paper focuses in great detail on infections that occurred during a short period of time in a restaurant. The authors highlight the critical importance of managing HVAC system variables to limit indoor infection spread. |
| “Naturally Occurring Indels In Multiple Coronavirus Spikes”, by Garry and Gallaher | This is the latest piece of evidence in the debate about whether SARS-CoV-2 had a natural or man-made origin. The authors argue for the former. They “compile evidence that insertion/deletion (indel) events at the S1/S2 and S2’ protease cleavage sites of the spike precursors are commonly occurring natural features of coronavirus evolution…[and] identify heretofore undescribed similarities in the S1/S2 and S2’ cleavage sites of multiple diverse coronavirus spikes that provide further evidence against a laboratory origin of SARS-CoV-2.” Considering the profoundly negative implications of man-made origin, this is good news. |
| | |
| | |
| | |
| | |
| | |
| | |
| New Social Information: Indicators and Surprises | Why Is This Information Valuable? |
| “Evaluating the Success of President Johnson’s War on Poverty: Revisiting the Historical Record Using a Full-Income Poverty Measure”, by Burkhauser et al | SURPRISE “We evaluate progress in President's Johnson's War on Poverty. We do so relative to the scientifically arbitrary but policy relevant 20 percent baseline poverty rate he established for 1963. No existing poverty measure fully captures poverty reductions based on the standard that President Johnson set. “To fill this gap, we develop a Full-income Poverty Measure with thresholds set to match the 1963 Official Poverty Rate. We include cash income, taxes, and major in-kind transfers and update poverty thresholds for inflation annually. While the Official Poverty Rate fell from 19.5 percent in 1963 to 12.3 percent in 2017, our Full-income Poverty Rate based on President Johnson’s standards fell from 19.5 percent to 2.3 percent over that period. “Today, almost all Americans have income above the inflation-adjusted thresholds established in the 1960s. Although expectations for minimum living standards evolve, this suggests substantial progress combatting absolute poverty since the War on Poverty began.” While this is a very impressive achievement, it is underreported because beyond a certain threshold (which the US has passed) poverty ceases to be measured against an absolute standard, and becomes relative. |
| “Do Family Policies Reduce Gender Inequality? Evidence From 60 Years Of Policy Experimentation”, by Kleven et al | SURPRISE And this is in Austria! “Do family policies reduce gender inequality in the labor market? We contribute to this debate by investigating the joint impact of parental leave and child care, using administrative data covering the labor market and birth histories of Austrian workers over more than half a century… “Our results show that the enormous expansions of parental leave and child care subsidies have had virtually no impact on gender convergence.” |
| “The Forest for the Trees” – Willis Krumholz review of “Billionaires in the Wilderness” by Justin Farrell | SURPRISE Farrell’s book is an anthropological study of class differences in the very affluent ski resort town of Jackson, Wyoming. It is alternately fascinating and painful – but very revealing. As Krumholz notes, “Today, the plight of the working class is not well understood, but it is well documented: families are brittle, young men are disconnected, and cities and neighborhoods have been hollowed out by the loss of industries. “But there is also a sense that America’s rich have lost something significant, too. Perhaps as a consequence of the death of the small town, the wealthy have become disconnected from healthy communities and from American civic life. As working-class problems have grown, America’s upper class has withdrawn.” In Jackson, “the middle class has already gone... In a country where modern-day feudalism is often said to be a creeping problem, Teton County [where Jackson is located] could be the closest thing America has to lords and serfs” … “The story of the lost middle class does not start—or end—with high land values caused by amorphous “market forces.” “Rather, it is the direct result of restrictions on land and housing that make only high-end homes possible in the county. “These restrictions have been put in place by the elite through a system of self-serving charities that Farrell calls “Gilded Green Philanthropy.” “Teton County is home to many tax-exempt charities, officially dedicated to environmental causes and usually backed by millions of dollars, which directly seek to restrict further development and which thereby boost existing home and land values. The wide use of tax breaks for conservation easements and land trusts means that the county suffers from a kind of nimbyism on steroids” ... “Put simply, the charity of Teton County’s elite does virtually nothing to help the poor of the area. Of Teton County’s roughly two hundred nonprofit organizations, most are focused on land conservation and the arts. “A deeper problem is the disparity in funding between different categories of organizations: of these two hundred nonprofits, some are bursting at the seams with cash, others struggle to get by. In general, nonprofits focused on social welfare are grossly underfunded or even ignored. “Elites come to Jackson Hole and “get involved”—but not in humanitarian causes. Charities that serve the interests of people in need or that work to relieve the plight of the migrants who serve the rich in the county are dismissed because of their focus on “buzzkill issues” … “Dig deep enough, and a key source of American political division comes down to disagreement over whether the great between America’s wealthy and its working class can be explained by merit alone or instead by some confluence of merit, policy, and privilege—but mostly policy and privilege. … “The way the elite of Teton County view the poor is out of touch with reality, as Farrell discovers in interview after interview. In the minds of the elite, the poor in Teton County are “ski bums” and nature lovers who have given up the pursuit of wealth in favor of outdoor adventure. If they resent the rich, goes the elite thinking, it is because they secretly wish they had made better life choices. The rich therefore feel no moral imperative to help those whom they see as ski bums who, after all, chose to be poor. “The reality of poverty in Teton County is quite different, however: the poor and working class residents of the area are disproportionately Hispanic migrant workers, whose wages have been stagnant for decades. Most work long hours at multiple jobs and still struggle to get by.” . “When the elites are asked about their own wealth, by contrast, they sometimes offer a less traditionally American answer. Instead of hard work, a handful of Farrell’s interviewees attributed their wealth to natural advantage, crediting superior intellect or even genetics. “You know, that’s just how it is, and some people are born smarter than other people and it’s not their fault … some people just don’t have the capability,” a wealthy resident told Farrell. Another resident said that the “gene pool is another element of it” … “American elites have a political ideology in common—one certainly not shared by the common folk. This ideology is a sort of “cafeteria libertarianism.” They are often liberal or agnostic on so-called social and cultural issues. On economics, they believe government should apply a light touch: it should do little to restrict immigration or trade; it should not seek to impose onerous antitrust requirements or heavily regulate corporate activity. “Yet when the stock market crashes, these same elites clamor for the Federal Reserve to step in. If their company is in trouble, they do not hesitate to turn to the government for a bailout. Of course, they also insist that such a bailout should come with as few strings attached as possible—rules that would disallow offshoring jobs, or limit CEO salaries, or grant government equity in the company—because the government should not interfere with the free market. “In other words, government intervention is bad when it is against their interests but good when it suits their interests. “In Teton County, this inconsistency of principle transfers to local government issues: self-professed libertarians who speak to Farrell are quick to justify their support for restrictions on development. They did, after all, pay a lot to live in Teton County. At a certain point, it seems pedantic to point out the inconsistency of their principles; Farrell’s superrich simply don’t bother to distinguish between principles and self-interest at all.” |
| “The Drivers of Institutional Trust and Distrust”, by Kavanagh et al from RAND | “Trust in core institutions—government, media, corporations, the military—is central to the functioning of American society. “Worryingly, polling data from multiple organizations reveal sizable decreases among the American public in trust of such institutions over the past two decades… Although these trends are well documented, they are not well understood…This report contributes to the existing understanding of trust in institutions by presenting and implementing a more comprehensive approach for assessing institutional trust… “Five dimensions—competence, integrity, performance, accuracy, and relevance of information provided—emerged from our analysis as perhaps the key drivers of trust in the institutions that we asked about… “Across institutions, survey respondents reported that perceived competence and integrity of individuals within the institutions were key drivers of their reduced trust in the institutions themselves.” See also, “Trust and the Coronavirus Pandemic: What are the Consequences of and for Trust? An Early Review of the Literature”, by Devine et al. The authors find that, on balance, COVID has led to a reduction in public trust in many institutions. |
| | |
| | |
| | |
| | |
| | |
| | |
| | |
| | |
| | |
| New Political Information: Indicators and Surprises | Why Is This Information Valuable? |
| “Did U.S. Politicians Expect the China Shock?” by Bombardini et al | SURPRISE Remember those findings about falling trust in institutions from the Social Evidence File? Here’s another example of why they exist. “In the two decades straddling China's WTO accession, the China Shock, i.e. the rapid trade integration of China in the early 2000's, has had a profound economic impact across U.S. regions. “Were its consequences unexpected? Did U.S. politicians have imperfect information about the extent of China Shock's repercussions in their district at the time when they voted on China's Normal Trade Relations status? Or did they have accurate expectations, yet placed a relatively low weight on the sub-constituencies that ended up being adversely affected? … “Overall, U.S. legislators appear to have had accurate information on the China Shock, but did not place substantial weight on its adverse consequences.” |
| “Importing Political Polarization? The Electoral Consequences of Rising Trade Exposure”, by Autor et al | Whether the legislators fully anticipated the social and political consequences that would flow from the economic effects of the China shock is another question… The authors of this paper ask, “Has rising import competition contributed to the polarization of US politics?” “Analyzing multiple measures of political expression and results of congressional and presidential elections spanning the period 2000 through 2016, we find strong though not definitive evidence of an ideological realignment in trade-exposed local labor markets that commences prior to the divisive 2016 US presidential election… trade exposed electoral districts simultaneously exhibit growing ideological polarization in some domains, meaning expanding support for both strong-left and strong-right views, and pure rightward shifts in others.” |
| As the dust settled after the US election, many beliefs that were previously held with confidence had a nasty confrontation with reality. For some people, this apparently made no difference. But others began to perceive surprising trends that few had anticipated. | One of these trends was the increased percentage of Latinos who voted for Trump. This surprised many observers given that while in 2016 Trump had run as an economic populist, he had governed as a traditional “big business Republican.” This has led some observers to conclude that, as AEI’s Ryan Streeter wrote, “Trumpism Is More About Culture Than Economics.” Put differently, many voters who were economically attracted to Biden’s economic policies still voted for Trump out of revulsion to Progressives’ positions in social issues (e.g., cancel culture, defund the police, etc.). See, for example, “Americans Strongly Dislike PC Culture”, by Uascha Mounk. This suggests that the critical battleground going forward will be for Latino, and a portion of the white working class. The Democratic/Progressive coalition’s challenge is to design, enact, and successfully implement economic policies significantly improve their lives, while muzzling the identity politics views of the Progressive left. In contrast, the challenge for the Republican/Populist coalition is to develop and advocate policies that benefit the working class, while muzzling the racist views of white nationalist right. Most importantly, both parties face the challenge of overcoming resistance to these changes by their donor class, who tend to have libertarian views (e.g., “I’m liberal socially and conservative economically”) that that are diametrically opposed to those held by a majority of voters, who would like to see more activist economic policies to improve their lives, but oppose the identity politics social views of the Progressive left. See, for example, “The Future of the Biden and Trump Coalitions”, by Ruy Teixeira, and “The Limits of the Realignment” by Aaron Sibarium. |
| | |
| | |
| | |
| | |
| | |
| | |
| | |
| | |
| | |
| | |
| New Financial Markets and Investor Behavior: Indicators and Surprises | Why Is This Information Valuable? |
| “We are all Behavioral, More or Less: A Taxonomy of Consumer Decision Making”, by Stango and Zinman | SURPRISE This important new research highlights the importance of multiple biases that affect investors’ decisions. Given the weak effects of interventions that attempt to reduce these biases, the authors provide strong evidence for the importance of using structured decision processes (e.g., forecast combination to increase predictive accuracy) to offset their impact. “Despite the growing impact of behavioral economics on social science research and applications, little is known about how the many potential behavioral biases fit into a taxonomy of consumer decision making. How common is it for people to exhibit multiple behavioral biases, and how heterogenous is the consumer-level portfolio of biases across consumers? How are biases correlated within-consumer, and how distinct are biases from other inputs to decision making?” … Our first finding is that biases are more rule than exception. The median consumer exhibits 10 of 17 potential biases. No one exhibits all 17, but almost everyone exhibits multiple biases; e.g., the 5th percentile is 6. “Our second finding is that cross-consumer heterogeneity in biases is substantial. The standard deviation of the number of biases exhibited is about 20% of its mean, and several results suggest that this variance is economically meaningful. “Our third finding is that cross-consumer heterogeneity in biases is poorly explained by even a “kitchen sink” of other consumer characteristics, including classical decision inputs, demographics, and measures of survey effort. Most strikingly, we find more bias variance within classical sub-groups widely thought to proxy for behavioral biases than across them. E.g., we find more bias variation with the highest-education group than across the highest- and lowest-education groups. “Our fourth finding is that our 17 biases are positively correlated with each other within consumer. Across all biases, the average pairwise correlation is 0.13” |
| “Volatility Expectations and Returns”, by Lochstoer and Muir | You could also substitute “uncertainty shocks” for “volatility shocks”… “We provide evidence that agents have slow-moving beliefs about stock market volatility that lead to initial underreaction to volatility shocks followed by delayed overreaction. These dynamics are mirrored in the VIX and variance risk premiums which reflect investor expectations about volatility and are also supported in surveys and in firm-level option prices.” |
| “Prospects And Challenges Of Quantum Finance”, by Bouland et al | This is an excellent analysis of how accelerating progress in the area of quantum computing, and the exponential speedup of calculation it provides, will impact Monte Carlo simulation methods, portfolio optimization, and machine learning. From a competitive perspective, it provides indicators that can be used to gauge the speed of progress in these applications. |
| | |
| | |
| | |
| | |
| | |
System Tipping Points/Critical Threshold Analysis
Like Professors Andrew Lo, Doyne Farmer and others, we regard financial markets as a complex adaptive system (CAS), that exist as part of a larger macro system comprised of other CAS between which there are multiple feedback loops. These other systems include those that produce technology innovations, and economic, environmental, national security (including cyber), social, demographic, and political outcomes.
We also find that these systems tend to operate and generate effects in a rough chronological sequence, albeit with many feedback loops between them. The following chart highlights that the changes we observe in different areas at any point in time are actually part of a much more complex evolutionary process.
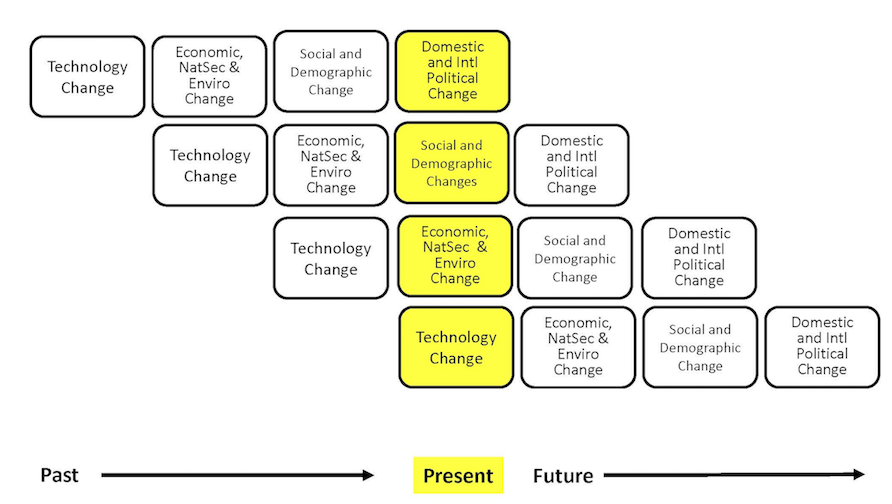
While most media coverage of these systems focused on flows (e.g., the size of the government deficit), rapid non-linear change in complex adaptive systems is often caused by a key stock (e.g., the amount of outstanding government debt) exceeding a critical threshold.
The next table highlights the key macro system stocks that we monitor.
In the next section, we will discuss information received over the past month that is related to these stocks, and which we believe is significant to our assessment of the probabilities that a critical threshold will be reached and a regime change will occur. We will conclude with our estimate, at the end of this month, of how close the macro system is to these critical thresholds, and the implications for financial market regime change probabilities.
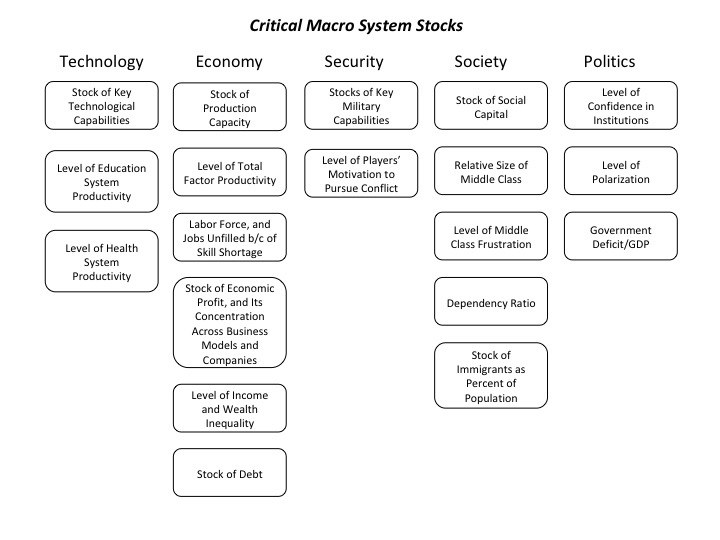
How Close is the Macro System to One or More Critical Thresholds?
As we have noted, the macro drivers of financial market regime changes typically follow a rough chronological sequence, from technology to economic, security, social, and political causes and effects. Yet there are many feedbacks loops between them, creating complex root causes for many of the critical thresholds we have identified.
Understanding the time dynamics in this complex system is critical to avoiding substantial downside investment risk.
We use the UK Met Office Warning Model to communicate our assessment of these time dynamics. We estimate the time remaining before a critical macro system threshold is reached that could trigger a regime change, which is usually accompanied by substantial changes in asset class valuations.
The model uses three increasingly serious levels of warning, from “Be Aware” (condition yellow), to “Be Prepared” (condition orange), to “Take Action” (condition red).
For our purposes, we denote as “Be Aware” (yellow) critical thresholds that we assess to be three or more years away. We estimate that “Be Prepared” (orange) thresholds could be reached within 1 to 3 years. “Take Action” thresholds are very likely to be reached within one year.
Given their nature, we also note that in our three “wildcard” areas (Environment and Energy related; Disease and Human Caused Bioevents; and Cyber and Electromagnetic Events), our forecasts have higher levels of uncertainty.
The following charts summarize our current estimate of the time remaining before different critical thresholds will be reached.
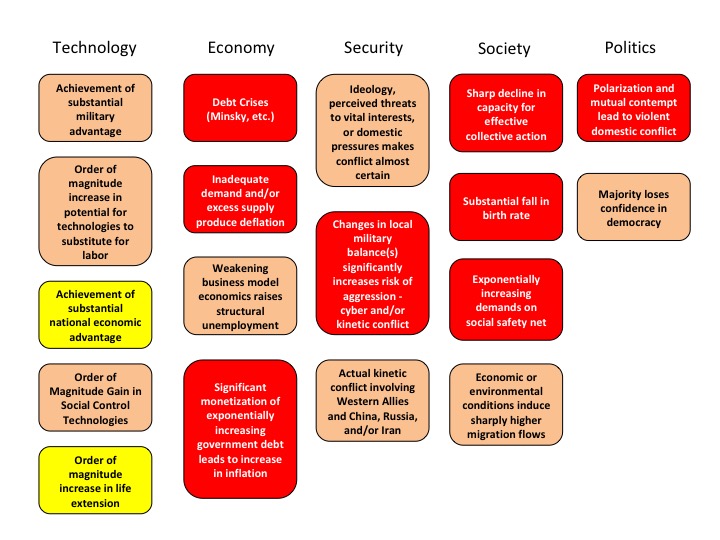
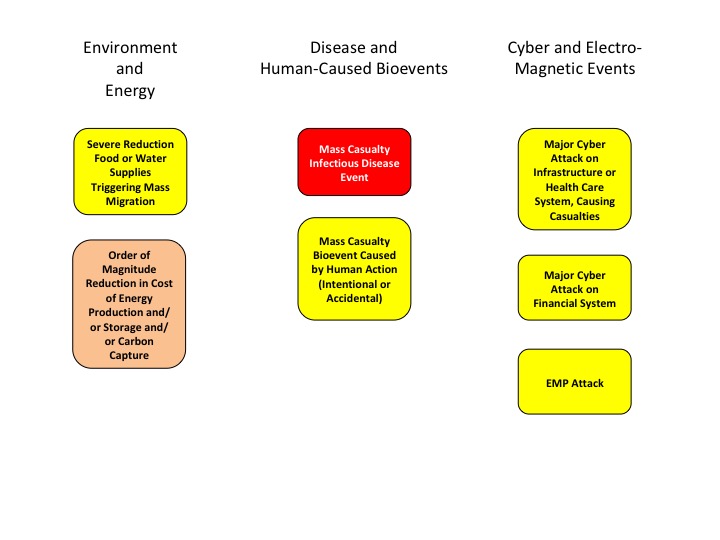
At the highest level, we believe the complex adaptive global macro system can be in one of four states, based on its degree of order versus disorder, and degree of social cooperation versus conflict. A very coarse-grained reading of history suggests that these states evolve in a predictable cycle, from ordered/cooperative, to disordered/cooperative, to disordered/conflicted, to ordered/conflicted.
We believe that the system is currently in its most uncertain state, characterized by high degrees of underlying disorder and social conflict, both domestically and internationally. Beyond some point, intensifying conflict eventually increases the degree of order in the system. That appears to be happening now, via the increasing conflict between China, Russia, and Iran and the United States and other Western nations.
If you have any questions about anything we have written in this issue, please don’t hesitate to get in touch, at contact@indexinvestor.com
Appendix: Anticipatory Thinking and Forecasting Methodologies
Our process is based on methods and tools developed over the past seven years at our affiliate, Britten Coyne Partners, which provides consulting services and education courses to executive teams and boards on strategic risk governance and management.
At The Index Investor, we engage in both anticipatory thinking to identify what could happen (e.g., different macro regimes and related events), and forecasting, to estimate the probability that events and regimes will happen, and the impact they will have if they do (e.g., on macro variables and broad asset class returns).
With respect to what could happen, we are acutely conscious of the conclusion reached by a 1983 CIA study of failed forecasts: "each involved historical discontinuity, and, in the early stages…unlikely outcomes. The basic problem was…situations in which trend continuity and precedent were of marginal, if not counterproductive value."
When it comes to forecasting, we know that in complex socio-technical systems that are constantly evolving, the accuracy of statistical or machine learning based forecasting methods declines exponentially as the time horizon lengthens, since the historical data set on which they were trained will (depending on the speed and effectiveness of any retraining cycle) bear less and less resemblance to the distribution of outcomes the system is likely to produce in the future.
Under these circumstances, forecast accuracy over longer time horizons depends on causal and counterfactual reasoning about the possible future effects of multiple interacting trends and uncertainties that are hard to quantify.
And we are acutely aware of the economist Rudi Dornbusch's famous warning: "Crises take a much longer time coming than you think, then happen much faster than you would have thought."
Our forecasting process also draws on lessons Tom Coyne learned from spending four years as a member of the Good Judgment Project team, which won the Intelligence Advanced Research Projects Activity’s forecasting tournament with forecast accuracy that was more than 50% better than the tournament's control groups (the team's experience is described in Professor Philip Tetlock's book, “Superforecasting").
Our analysis focuses on the probability of the global macro system being in four possible macro regimes 12 and 36 months from the date of our forecast: (1) Normal Times, where equity asset classes perform well; (2) a High Uncertainty regime that is usually short and transitory, where asset classes like short-term government bonds perform best and equities suffer significant declines; (3) High Inflation (which we deem 5% or more, year-on-year), where commercial property, real return bonds and other traditional hedges are favored; and (4) Persistent Deflation (a year-on-year decline in the US CPI), which up to now has only been seen in Japan, and in which the relative performance of different asset classes remains uncertain, but will likely favor high quality bonds and the consumer staples equity sector.
In response to subscriber requests, we have added a 36-month regime forecast to our existing 12 month forecast. The logic is that, in a complex evolving system like global macro, a longer forecast horizon gets beyond the “detection range” of algorithmic forecasting approaches, and therefore raises probability that a manager/investor can gain an edge in identifying emerging threats and opportunities.
That said, because evolving (i.e., “non-stationary”) complex systems populated by highly connected human agents are also capable of sudden non-linear changes (with which are hard for algorithmic approaches to predict), we are also keeping our 12 month forecast.
Our forecasting methodology starts with base rate/reference case data about the historical probability of large changes in equity and bond valuations. We then analyze the current situation from both a quantitative and qualitative perspective. In the latter, we focus on the key endogenous drivers of macro regime change, including technological, economic, national security, social, and political trends and uncertainties. We also focus on three potential sources of exogenous shocks that could also produce a macro regime change, caused by environmental, disease, and cyber related events.
While most of our attention typically focuses on various flows (e.g., economic growth, change in the price level, sales, earnings, job creation, etc.), endogenously caused regime changes result when those flows push key stocks beyond a critical threshold or tipping point, often setting off non-linear reactions across multiple areas. As noted by Hyman Minsky and others, a classic example is the steady accumulation of outstanding debt until it reaches the point where it can no longer be serviced and triggers a crisis.
Base Rate Data
Since the end of World War Two, there have been fifteen months where a downturn in the US equity market began that eventually reduced asset class value by 20% of more. That is a hazard rate of about 1.75% per month. Put differently, in any given month there is a 98.25% probability that a 20%+ downturn won’t occur, or, in a given year, an 81% probability.
However, as the time without a 20%+ downturn extends, the compound probability that one will not occur shrinks. At the end of August 2018, it is more than nine years since the last equity market decline of 20% or more. The probability of that happening is only 15%.
To estimate the base rate for a 20% fall in bond prices (which historically has been caused by a sharp increase in inflation, as we saw in the late 1970s and early 1980s), we analyzed monthly historical AAA bond yields since 1919. For consistency, we used them to calculate the price of a ten-year zero coupon bond. We then calculated the probability of a price decline of 20% or more over three different holding periods: 12, 18, and 24 months. In any month, the annualized probability of a decline of 20% or more over the subsequent 12 months is 12%; over 18 months, 20%, and over 24 months, 25%.
Market Stress Indicators Methodology
We view financial markets as a complex adaptive system. The size of changes generated by such a system follows a power law rather than a normal (Gaussian) distribution. The critical point is that large changes are much more common in complex adaptive systems than most people’s intuition leads them to believe.
While predicting the behavior of complex adaptive systems remains far more art than a science, various researchers have found that large changes in such systems are often preceded by subtle warning signs, as stress accumulates within them. While this research is not definitive, we believe that five warning signs are worth monitoring as potential indicators of growing stress within financial markets that could suddenly give rise to large changes in asset class valuations.
Our first indicator is the month-to-month autocorrelation of broad asset class returns (i.e., the relationship of this month’s returns to last month’s). A system under increasing stress loses resiliency, causing it to take longer to recover from perturbations; hence, autocorrelation increases as it approaches a critical transition (see, “Early Warning Signals for Critical Transitions” by Scheffer, et al).
The second market stress indicator we monitor is the Economic Policy Uncertainty Index published by the Federal Reserve Bank of St. Louis (via its FRED economic database), which is based on research by Baker, Bloom, and Davis (see their paper, “Measuring Economic Policy Uncertainty”). The index is based on automated text analysis of leading newspapers and magazine publications, to identify the frequency with which words and phrases are used that indicate uncertainty.
In humans’ evolutionary past, when uncertainty increased the probability of survival was enhanced by staying close to a group. All of us still have that instinct. Research has found that as uncertainty increases, we have an unconscious bias towards higher conformity of our own views with those of a larger group (i.e., reduction in cognitive diversity). Behaviorally, heightened uncertainty induces more “social copying” of others, likely due to both conformity bias and the rational belief that others may be acting on the basis of superior information. This increase in conformity and copying makes a social system more ordered as uncertainty increases, and also reduces its responsiveness to perturbations (i.e., increases autocorrelation) because of delays in the social copying process.
The key point is that increasing uncertainty induces more, not less order in social systems, and in so doing primes them for sudden non-linear change.
Our third market stress indicator is the spread between the yield on AAA rated bonds and the 10-year US Treasury. This is a proxy for the level of investor concern about financial system funding liquidity.
Our fourth market stress indicator is the yield spread between speculative BB rated bonds and the ten-year US Treasury. Throughout history, excessive credit growth has been a root cause of many financial crises. An indicator of such growth is falling credit spreads, particularly in the case of riskier borrowers. In contrast, rising BB spreads indicate growing investor concern about the consequences of such growth, and the financial distress lower rated companies could experience in an economic downturn.
Our fifth market stress indicator is what we term the “political risk premium” that is implicit in the price of gold. Our starting point for estimating this premium is the three different roles that gold plays. First, gold is a store of value in a world of fiat currencies. When the rate of money supply growth exceeds the growth of nominal GDP, gold’s price should increase to maintain its purchasing power. Between 2007 and 2017, the US money supply (M2) grew by about 86%, while nominal US GDP grew by 35%. The stock of gold grew by 18%, based on mine production over this period. We therefore infer that 33% of the increase in the price of gold represented the maximum potential gold price change that could be attributed to a desire to hedge inflation risk (86% less 35% less 18%).
Second, gold is a unit of account. We take this to mean that the annual change in GDP expressed in terms of physical gold (i.e., nominal GDP divided by the price of gold) should equal the change in real GDP calculated using the GDP price deflator to account for actual inflation over the period. A key challenge is the point at which to start this calculation.
We chose the price of gold in 1995/1996. In that period, the change in real global GDP measured using the IMF’s price deflator just about equaled the change in GDP measured in terms of physical gold. We interpret that coincidence as indicating that at that point in time, concerns about future inflation and political risk were minimal, and the change in the price of gold was mostly driven by its role as a unit of account. We calculated a subsequent series of gold prices that would produce the same change in “gold GDP” as the actual real GDP as calculated by the IMF. Between 2007 and 2017, “gold as a unit of account” warranted a 21% increase in its price.
Gold’s third role is as a hedge against inflation and what we term “political disaster” risk. We subtract the 21% estimated compensation for actual inflation from the 33% “gross” inflation risk hedge to derive an apparent 12% increase in the gold price that reflected the true risk premium to hedge against possible future inflation. However, between 2007 and 2017 the price of gold actually increased by 81%. This implies that 48% of this (81% less 21% less 12%) represented a premium for some other type of uncertainty at the end of 2017. The interesting question is the nature of the uncertainty for which gold is believed by some investors to be a superior hedge than traditional ports in a storm like short-term US government securities, or similar securities issued by other developed countries.
The logical inference is that the uncertainty in question must reflect a situation in which short term US Treasuries would be a less effective hedge than gold. This could be a world of widespread hyperinflation, capital controls, and/or radical changes in nations’ governments (of course, this would also imply a preference for investing in gold coins rather than bullion, as while the latter may be a store of value, it is far less convenient as a means of paying for transactions).
To put this in further perspective, this gold price “disaster risk” premium sharply increased from 2008 to 2012, then declined before sharply increasing again after 2016. Arguably, a significant part of the former increase reflects concerns about the potential inflationary consequences of dramatic quantitative easing by central banks. But this is not likely to be the case after 2016.