The Index Investor
April 2021
Recent Quantitative Indicators
Tactical Asset Allocation Implications of Our Forecasts
Forecast Pre-Mortem Analysis
Combining and Extremizing Forecasts to Improve Predictive Accuracy
Feature Article: Will Reskilling Work? And What Happens If It Fails?
High Value Information Observed Last Month:
- Technology
- Energy and Environment
- Health and Disease
- Economy
- National Security
- Society
- Politics
- Financial Markets and Investor Behavior
Critical System Thresholds/Tipping Points Analysis
Appendix: Anticipatory Thinking and Forecasting Methodologies
Current Macro Forecast
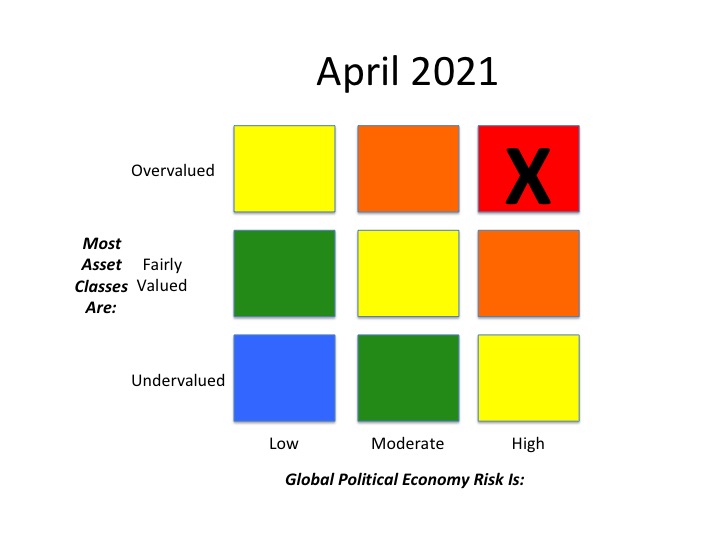
Let’s look at some highlights before turning to this month’s 12 and 36 month macro regime forecast.
“In coming years and decades, the world will face more intense and cascading global challenges ranging from disease to climate change to the disruptions from new technologies and financial crises. These challenges will repeatedly test the resilience and adaptability of communities, states, and the international system, often exceeding the capacity of existing systems and models. This looming disequilibrium between existing and future challenges and the ability of institutions and systems to respond is likely to grow and produce greater contestation at every level.
“In this more contested world, communities are increasingly fractured as people seek security with like-minded groups based on established and newly prominent identities; states of all types and in all regions are struggling to meet the needs and expectations of more connected, more urban, and more empowered populations; and the international system is more competitive—shaped in part by challenges from a rising China—and at greater risk of conflict as states and nonstate actors exploit new sources of power and erode longstanding norms and institutions that have provided some stability in past decades.
“Five themes appear throughout this report and underpin this overall analysis.
(1) Shared global challenges—including climate change, disease, financial crises, and technology disruptions—are likely to manifest more frequently and intensely in almost every region and country. These challenges—which often lack a direct human agent or perpetrator—will produce widespread strains on states and societies as well as shocks that could be catastrophic.
“The ongoing COVID-19 pandemic marks the most significant, singular global disruption since World War II, with health, economic, political, and security implications that will ripple for years to come. The effects of climate change and environmental degradation are likely to exacerbate food and water insecurity for poor countries, increase migration, precipitate new health challenges, and contribute to biodiversity losses. Novel technologies will appear and diffuse faster and faster, disrupting jobs, industries, communities, the nature of power, and what it means to be human.
“Continued pressure for global migration—as of 2020 more than 270 million persons were living in a country to which they have migrated, 100 million more than in 2000—will strain both origin and destination countries to manage the flow and effects.
These challenges will intersect and cascade, including in ways that are difficult to anticipate. National security will require not only defending against armies and arsenals but also withstanding and adapting to these shared global challenges.
(2) The difficulty of addressing these transnational challenges is compounded in part by increasing fragmentation within communities, states, and the international system. Paradoxically, as the world has grown more connected through communications technology, trade, and the movement of people, that very connectivity has divided and fragmented people and countries…
"(3) The scale of transnational challenges, and the emerging implications of fragmentation, are exceeding the capacity of existing systems and structures, highlighting the third theme: disequilibrium.
“There is an increasing mismatch at all levels between challenges and needs with the systems and organizations to deal with them. The international system—including the organizations, alliances, rules, and norms—is poorly set up to address the compounding global challenges facing populations. The COVID-19 pandemic has provided a stark example of the weaknesses in international coordination on health crises and the mismatch between existing institutions, funding levels, and future health challenges.
“Within states and societies, there is likely to be a persistent and growing gap between what people demand and what governments and corporations can deliver. From Beirut to Bogota to Brussels, people are increasingly taking to the streets to express their dissatisfaction with governments’ ability to meet a wide range of needs, agendas, and expectations. As a result of these disequilibriums, old orders—from institutions to norms to types of governance—are strained and in some cases, eroding. And actors at every level are struggling to agree on new models for how to structure civilization…
"(4) A key consequence of greater imbalance is greater contestation within communities, states, and the international community. This encompasses rising tensions, division, and competition in societies, states, and at the international level. Many societies are increasingly divided among identity affiliations and at risk of greater fracturing. Relationships between societies and governments will be under persistent strain as states struggle to meet rising demands from populations.
“As a result, politics within states are likely to grow more volatile and contentious, and no region, ideology, or governance system seems immune or to have the answers. At the international level, the geopolitical environment will be more competitive—shaped by China’s challenge to the United States and Western-led international system. Major powers are jockeying to establish and exploit new rules of the road. This contestation is playing out across domains from information and the media to trade and technological innovations.
“(5) Adaptation will be both an imperative and a key source of advantage for all actors in this world. Climate change, for example, will force almost all states and societies to adapt to a warmer planet. Some measures are as inexpensive and simple as restoring mangrove forests or increasing rainwater storage; others are as complex as building massive sea walls and planning for the relocation of large populations. Demographic shifts will also require widespread adaption. Countries with highly aged populations like China, Japan, and South Korea, as well as Europe, will face constraints on economic growth in the absence of adaptive strategies, such as automation and increased immigration.
“Technology will be a key avenue for gaining advantages through adaptation. For example, countries that are able to harness productivity boosts from artificial intelligence (AI) will have expanded economic opportunities that could allow governments to deliver more services, reduce national debt, finance some of the costs of an aging population, and help some emerging countries avoid the middle-income trap. The benefits from technology like AI will be unevenly distributed within and between states, and more broadly, adaptation is likely to reveal and exacerbate inequalities. The most effective states are likely to be those that can build societal consensus and trust toward collective action on adaptation and harness the relative expertise, capabilities, and relationships of nonstate actors to complement state capacity.”
In sum, the next twenty years will be filled with interacting uncertainties and emergent dangers for investors. Achieving your long-term financial goals will depend on the extent to which you have three edges: The ability to anticipate threats, or spot them before others; the ability to assess them more accurately; and the ability to adapt to them more quickly. Since 1997, the purpose of The Index Investor has been to help you do just that.
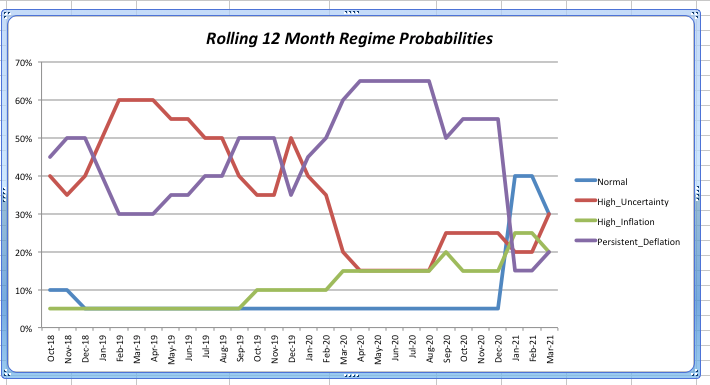
Given the rapid emergence and spread of new SARS-CoV-2 variants that in all cases are more easily transmitted, and in some more cases decrease vaccine efficacy, and given the slow rate of vaccination in many countries, we have reduced the probability of being in the Normal Regime 12 months from now from 40% to 30%. Specifically, we see the emergence and rapid spread of the P.1 (Brazil) variant in Canada is a critical uncertainty, which has the potential to sharply increase uncertainty and slow the incipient economic recovery in the United States.
For the same reason, we have reduced the 12-month probability of being in the High Inflation Regime from 25% to 20%.
A slower than expected recovery in the United States will likely lead to an increase in insolvencies, which has an even chance of causing a sharp fall in asset prices which would further accelerate the economic downturn, leading to price declines. We have thus increased the 12-month probability of the Deflation Regime from 15% to 20%.
Given uncertainty about how the race between the spread of new variants and the vaccination rate will turn out, and given that the steady increase in tensions between the US and China that shows no sign of abating, we increased the 12-month probability of the High Uncertainty Regime from 20% to 30%.
(1) An increase in inflation, and the popping credit and equity market bubbles rising rates would very likely trigger;
(2) A US sovereign debt and/or dollar crisis (though the latter would also require a more attractive new currency home for investors fleeing the dollar, which at this point seems unlikely);
(3) An LDC debt crisis, due to heavy corporate borrowing in foreign currency;
(4) A Eurozone sovereign debt crisis, most likely triggered by Italy;
(5) A severe private sector solvency crisis, as the government support that enabled many companies to survive during the pandemic is withdrawn but the economy remains weak;
(6) SARS-CoV-2 mutations that significantly reduce vaccine efficacy, forcing another return to lockdowns (as we have recently seen in the UK and EU);
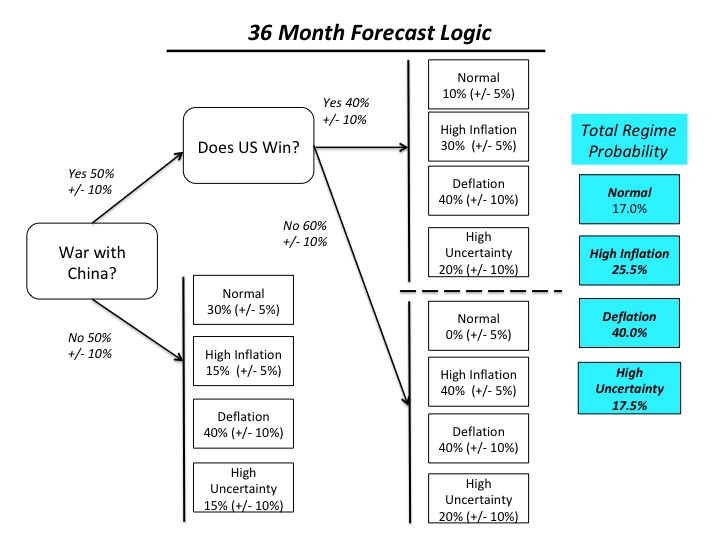
The second is likelihood that war between the US and China could break out over Taiwan at some point over the next 36 months, and the probability of different regimes if it does and one of the other side wins (for more on likely outcomes, see “The United States, China, and Taiwan: A Strategy to Prevent War”, by Blackwill and Zelikow). We estimate that the probability of a conflict with China has risen to 50% (and we remind you of the Financial Times’ John Dizard’s recent caution that “war risk is consistently underestimated by money people”).
Our 36-month forecast logic and results is shown below:
This not only slows the diffusion of new information throughout social systems like economies and financial markets, but also causes these systems to coalesce around a small number of narratives. However, as tension increases on various fault lines in the global macro system, the dominant narrative or narrative grows increasingly fragile.
Under these conditions, rapid, non-linear changes are very likely to occur, that are out of proportion to the apparent trigger that sets them off.
Forecast Logic: Quantitative Indicators
Implications of the Most Recent Three Month Asset Class Returns
Our forecasting methodology also includes quantitative analyses of asset class valuations, market stress indicators, and the level and change in three-month returns, over the most recent and previous three-month periods, for those asset classes, which should perform best under different regimes (in this sense, our regimes can be regarded as macro factors).
We assume that that the rolling three month returns reflect investors’ views regarding the relative probability that a given macro regime will develop in the future.
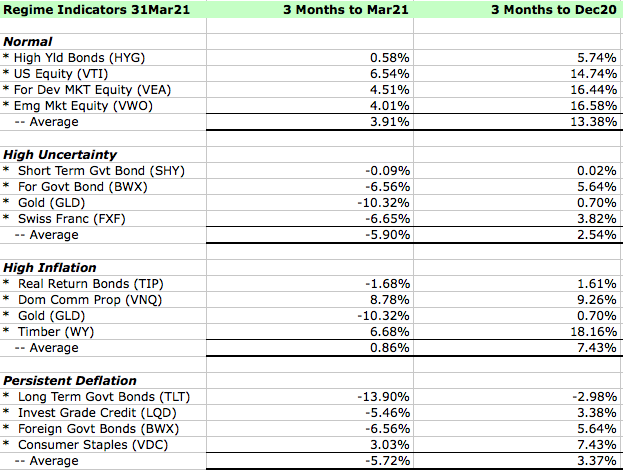
We disagree with the probability for the Normal Regime that is implied by relative returns on different asset classes in the three months to the end of March. We think it is too optimistic.
Asset Class Valuation and Momentum Indicators (@31Mar21)
| Asset Class (ETF) | Valuation | 1 Month Return | Conclusion |
| US Real Return Govt Bond (TIP) | Likely Overpriced* | (0.26%) | Decreasing Overvaluation |
| US Nom Return Govt Bond (GOVT) | Within Fairly Priced Range* | (1.40%) | Fairly Valued |
| US Investment Grade Credit (LQD) | With Fairly Priced Range* | (1.48%) | Fairly Valued |
| US High Yield Credit (HYG) | Almost Certainly Overpriced* | 1.21% | Increasing Overvaluation |
| US Commercial Property (VNQ) | Within Fairly Priced Range* | 5.14% | Fairly Valued |
| US Equity (VTI) | Almost Certainly Overpriced* | 3.64% | Increasing Overvaluation |
| Foreign Devel Mkt Equity (VEA) | Likely Overpriced* | 2.77% | Increasing Overvaluation |
| Emerging Markets Equity (VWO) | Almost Certainly Overpriced* | (0.71%) | Decreasing Overvaluation |
| Timber (WY) | Very Likely Underpriced | 5.61% | Decreasing Undervaluation |
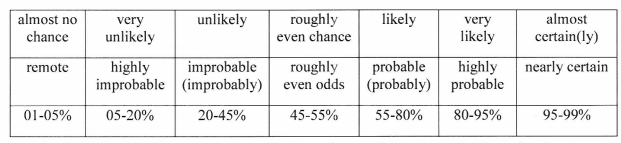
Note: The language we use to describe our estimated likelihood of asset class over or undervaluation is based on US Intelligence Community Directive 203 on Analytic Standards, which includes the following table:
Market Stress Indicators (@31Mar21)
| Market Stress Indicator | This Month vs Last Month |
| Asset Class Returns Autocorrelation (this month versus last month). Higher autocorrelation is an indicator of more tightly coupled and fragile markets. | 53 versus .19 the previous month. This indicates a rising level of market stress. |
| Economic Policy Uncertainty Index (how many days over the last 30 was index in top quartile of values since 1985?). A higher number equals more market stress. | On 20 days last month the index was in the top quartile of daily values since 1985 (the 92nd percentile of all rolling 30-day periods), a slight decrease from 21days the month before. |
| AAA Rated Bonds Spread over 10 Year Treasury Yield (month end). Higher spreads indicate rising concern about market liquidity. | 1.30% (51st percentile since 1983), down from 1.42% from last month. |
| BB Rated Bonds Spread over 10 Year Treasury Yield (month end). High spreads indicate increasing credit risk. | 2.44%, (23rd percentile) down from 2.58% (29th) last month, indicating a low level of stress. Given our Regime forecast, this is almost certainly inadequate compensation for the risk being taken with BB rated bonds. |
| Gold Price per Ounce in US Dollars (month end). Rising gold prices are an indicator of increasing market uncertainty and stress. | $1,685 versus $1,765, down (4.7%) from the previous month. At the end of 2017, we estimated the “disaster premium” in the gold price was 47% (see our methodology in the Appendix). At the end of last month it was 77%, down from 83% the previous month. Given our forecast, this seems far too low. |
Portfolio Allocation Implications of Our Forecast
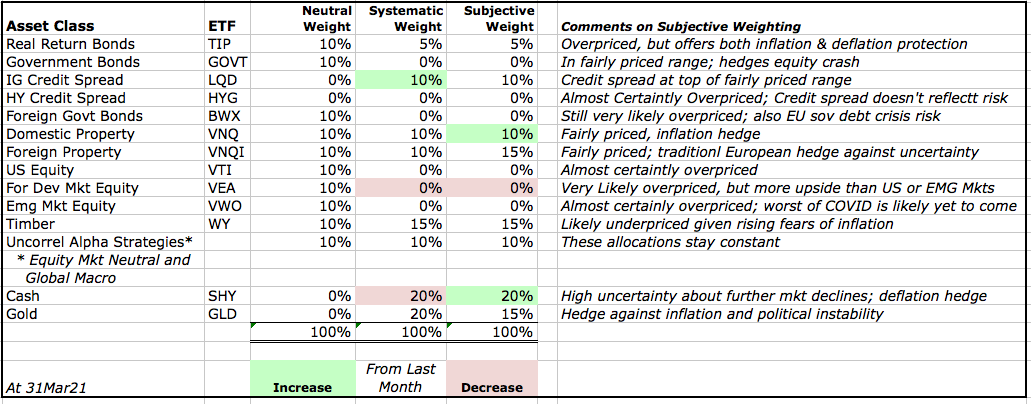
We take two approaches to deriving the tactical asset allocation implications from our analyses (i.e., deviations from our "neutral" or base case model portfolio).
The first takes a systematic approach, and is based on relative asset class valuations. Our starting point is our neutral model portfolio, which is equally weighted across nine broad asset classes, and also includes 5% allocations to alpha strategies (equity market neutral and global macro) that are designed to have a low correlation to returns on broad asset classes.
Based on asset class valuations, we systematically vary the asset class weights (but not the active strategy weight), increasing from 10% to 15% when an asset class is likely undervalued, and 15% when it is very likely undervalued. In the case of overvaluations, we go to 5% and then into cash, if there are no undervalued asset classes with room for an increase. In effect, this replicates the systematic rebalancing strategy we used for 15 years in our previous model portfolios.Based on subscriber requests, this month we are re-introducing a feature from the previous version of The Index Investor: Tactical Asset Allocation Implications from our analyses.
The second tactical approach is based on our subjective view not only of current asset class valuations, but also of the implications of the broader macro trends and uncertainties that we analyze each month. Importantly, this subjective view reflects our primary goal of avoiding large downside losses, rather than seeking large upside gains.
Three final notes: First, with respect to US fixed income, we include credit products (investment grade and high yield) in the same asset class as government debt, and will shift into the former when their valuations become attractive.
Second, we regard gold not as a separate asset class to be held long-term, but rather as a complement to cash, into which we shift in periods of substantial overvaluation across multiple asset classes.
Third, we continue to be deeply concerned by the distortion in asset class valuations that have been created by negative real interest rates on sovereign bonds, which are the foundation of most asset pricing models. In August, we decided to address this distortion by using in our asset class valuation models our estimate of the economically logical real yield on inflation protected US government bonds (TIPs). This brings our quantitative valuation conclusions much closer to those based on our qualitative analysis.
More information about our investment beliefs, including our core philosophy, approach to asset allocation (including our model portfolios and their long-term track record), and views on various approaches to active and passive management can all be found here.
Here is our latest asset allocation view:
Pre-Mortem Analysis
One of the most important forecasting disciplines is to ask yourself why your forecast could be wrong. Dr. Gary Klein’s research has shown that a very powerful and insightful way to do this is via a “pre-mortem analysis.” This method asks you to assume that it is a point in the future, and your forecast has been proven wrong (or your strategy or company has failed). You are then asked to look backward from this imagined point in the future, to explain why you failed, what you missed, and what you could have done differently to avoid your fate.
The pre-mortem method takes advantage of the fact that humans reason much more concretely and in more detail when explaining the past than they do when trying to forecast the future.
So let us assume that it is one year from now, and our current forecast has turned out to be wrong.
How did this happen? What developments did we fail to anticipate?
- Following the election of Joe Biden, the removal from office Xi Jinping could lead to a reduction in the dangerously growing conflict between the US and China. The impact of this surprise seems uncertain. To the extent that reduced external threat reduces the perceived urgency of implementing structural reforms in the US, it would increase the probability of the High Inflation Regime. Yet at the same time, it could accelerate economic and political reforms in China, which would increase economic growth there, creating a more dangerous medium term situation for the United States.
- A supply side shock of some type – beyond the disruption of global supply chains caused by COVID-19 -- could produce a sudden increase in inflation. The most likely scenario is a reduction in oil supplies due to a prolonged kinetic conflict between Iran and the US. An unlikely scenario could be major crop failures associated with the next solar cycle, which NASA forecasts will be the weakest in 200 years. McKinsey recently concluded that the probability of such a failure has increased due to changes in the environment, and now stands at about 10% over the next five years ("Will the World’s Breadbaskets Become Less Reliable?”).
Note: Combining Our Forecasts with Others From Other Sources and Extremizing the Result Should Increase Your Predictive Accuracy
Research has found that three steps can improve forecast accuracy. The first is seeking forecasts based on different forecasting methodologies, or prepared by forecasters with significantly different backgrounds (as a proxy for different mental models and information). The second is combining those forecasts (using a simple average if few are included, or the median if many are). The final step, which significantly improved the performance of the Good Judgment Project team in the IARPA forecasting tournament, is to “extremize” the average (mean) or median forecast by moving it closer to 0% or 100%.
Forecasts for binary events (e.g., the probability an event will or will not happen within a given time frame) are most useful to decision makers when they are closer to 0% or 100% than the uninformative “coin toss” 50%. As described by Baron et al in “Two Reasons to Make Aggregated Probability Forecasts More Extreme”, forecasters will often shrink their probability estimates towards 50% to take into account their subjective belief about the extent of potentially useful information that they are missing.
When you average multiple forecasters’ estimates, you are including more information, which should increase forecast confidence and push the mean estimate closer to 0% or 100%. However, this doesn’t happen when you use simple averaging. For this reason, forecast accuracy is increased when you employ a structured “extremizing” technique to move the mean estimate closer to 0% or 100%.
You can download an extremizing model from our website to use when combining the forecasts you use in your decision process.
The extremizing factors in our model are those that the Good Judgment Project found maximized the accuracy of combined forecasts. Note that the extremizing factor is lower when average forecaster expertise is higher. This is based on the assumption that a group of expert forecasters will incorporate more of the full amount of potentially useful information than will novice forecasters.
Feature Article: Will Reskilling Work? And What Happens If It Fails?
The answer to this question begins with the evolution of the 21st century economy, a process that COVID has sharply accelerated.
Organizations perform activities to achieve their goals. Performing those activities costs money. With the arrival of the industrial revolution, it became possible for some activities to be performed more effectively and efficiently through the application of new technologies, like electricity and railroads.
However, the productivity improvements, faster economic growth, and rising living standards this made possible weren’t fully realized until human capital improved (via the expansion of public education) and organizations adopted new designs to make full use of new technological and human capabilities.
That is the very short story of the Industrial Revolution.
And now we’re here again, as the Industrial Economy gives way to the Digital Economy.
Fundamentally, it’s the same story – lots of promising new technology, with benefits that will only be fully realized when human capital and organization designs both improve.
Let’s look at a more specific example. Like an organization, a “job” can be described as a set of activities (which can be further subdivided into tasks) that an individual must perform to attain an objective through the use of their knowledge, skills, and experience.
One of the key developments in the 21st century economy is exponential improvement in technologies that allow the automation of physical and cognitive activities and business processes (think robotics and artificial intelligence).
At the job level, this means that some tasks and activities previously performed by human labor can now be performed by technology. For example, artificial intelligence technologies have led to the automation of a range of information collection, analysis, prediction, and classification, and routine decision-making tasks.
For example, a 2017 McKinsey analysis concluded that, globally, 60 percent of jobs had at least 30 percent of constituent work activities that could be automated by 2030 (“Jobs Lost, Jobs Gained: Workforce Transitions In A Time Of Automation”).
In some cases automation has led to the elimination of jobs, especially those previously termed “middle management”. But in many more cases, the automation of routine activities has led to a change in the nature of the job itself, or the creation of new jobs, based on physical, social, and cognitive activities that could not be automated.
However, humans often need higher levels of knowledge and skill to perform these new sets of activities. For example, consider the work of a loan officer. Automation has eliminated the need for them to make loan decisions for routine transactions that can be handled by credit scoring and other algorithms. In so doing, it has created more time for the loan officer to spend analyzing and deciding on much more difficult credits, which require more advanced knowledge and skills.
But what happens when there is a shortage of people with the required new levels of knowledge and skill?
We can see the answer all around us today.
Because of the rapid scaling that is possible in a digital economy, companies that can attract scarce talent can adopt advanced technologies and grow much faster than their competitors, whose profit margins shrink as they fall further behind and struggle to survive.
In the labor market, this has led to both offshoring of operations to lower costs, and outsourcing of activities to temporary “gig” workers who are poorly paid and receive minimal or no employee health and retirement benefits.
At the level of the national economy, it has led to lower labor productivity and a slower rate of growth in the size of the overall economic pie.
Meanwhile, companies that can attract the scarce talent can afford to pay them more, which worsens income inequality.
And what happens to those people who lack the advanced knowledge and skills required for well-paying jobs?
In our increasingly unequal economy, spending by people at the higher end has driven the expansion of multiple service industries. These jobs have changed too, with many requiring higher levels of knowledge and skill than in the past. But because of the high degree of competition in many service businesses, revenues are always under pressure, pay is low, and benefits are often non-existent.
In sum, as we transition from the Industrial to the Digital Economy, the mismatch between the rate at which human capital and technologies are improving has led to worsening inequality, the shrinkage of the middle class, and the creation of a rapidly growing “precariat”.
In turn, this has led to rapidly rising government spending on various social safety net programs (which has crowded out spending in other areas), and rising social and political conflict.
And all these trends will only grow worse if the average quality of human capital doesn’t grow much more quickly.
This isn’t news. In 1990, the title of the final report of the Commission on the Skills of the American Workforce put it bluntly: “America’s Choice: High Skills or Low Wages!” It still is.
Broadly speaking there are four ways to meet rising demand for workers with greater knowledge and skill.
(1) Improve the Performance of the Education System. Unfortunately, with some exceptions this hasn’t happened in most countries because opposition from extremely strong interest groups (e.g., teachers unions) has prevented substantial change.
(2) Outsource Activities to Other Labor Markets. This has been happening for years. However, the pandemic has accelerated this trend, and, critically, has extended it to more cognitively demanding jobs. As the Financial Times recently noted, “if you can do your job from anywhere [because of Zoom and other technologies], then someone from anywhere can do your job. Outsourcing is a particularly acute risk for higher paid workers in English speaking countries, since English is the most common second language in the world (978 million speakers, per Ethnologue.com).
(3) Insource Talent from Other Labor Markets via Immigration. Some countries (e.g., Canada and Australia) use a points-based system to determine who can immigrate (almost always in parallel with separate systems for refugees and asylum seekers). These points-based systems focus on attracting people with knowledge and skills that are in short supply.
(4) Retrain Current Workers. Whether “reskilling” or “upskilling” is a viable solution is the subject of this analysis.
The 50,000 Foot Policy View
The first point to make is the widespread recognition of the critical importance of reskilling, at the “50,000 foot policy level”.
From the OECD’S report “Getting Skills Right: Future Ready Adult Learning Systems” to McKinsey Global Institute’s “The Future of Work After COVID-19 Report” to MIT’s report, “The Work of the Future: Building Better Jobs in the Age of Intelligent Machines”, there is near unanimous agreement on what must be done in order to avoid economic, social, and political disruption.
For example, the McKinsey report concludes that, “Our research suggests that the disruptions to work sparked by COVID‑19 will be larger than we had estimated in our pre-pandemic research, especially for the lowest-paid, least educated, and most vulnerable workers. We estimate that more than 100 million workers in the eight countries we studied may need to switch occupations, a 12 percent increase compared to before the pandemic overall and a rise of as much as 25 percent in advanced economies.
“These workers will face even greater gaps in skill requirements. Across countries, we find that job growth may concentrate more in high-wage jobs while middle- and low-wage jobs decline.”
The evidence shows that employers agree with policy analysts’ conclusions. For example, a McKinsey survey found that, “44 percent of respondents say their organizations will face skill gaps within the next five years, and another 43 percent report existing skill gaps. In other words, 87 percent say they either are experiencing gaps now or expect them within a few years” (“Beyond Hiring: How Companies Are Reskilling To Address Talent Gaps”).
Here in Colorado, a survey by the business organization Colorado Succeeds found that, “86 percent of employers said the skills gap is a threat to their business. 77 percent struggle to find workers with applied skills like critical thinking and problem solving. 62 percent have difficulty finding candidates with workplace skills like teamwork and communication.” This had led to their spending more on training and recruiting, and experiencing lower work quality, productivity losses, lost revenue, and slower business growth.”
However, there is evidence that this general agreement about the need for reskilling often breaks down when different groups involved in meeting the reskilling are asked what specifically they have in mind.
For example, a 2016 report by IBM (“Facing the Storm: Navigating the Global Skills Crisis”) found that, “industry executives ranked science, technology, engineering and mathematics (STEM) skills; basic computing skills; and fundamental core skills in reading, writing and arithmetic as the most important. However, these skills were rated lowest in priority among workforce/labor policy executives worldwide, whose top three reskilling priorities were “ability to communicate effectively in a business context; willingness to be flexible, agile, and adaptable to change, and ability to work effectively in team environments.”
The second point to make about reskilling is the scale on which it must occur.
For example, in January 2020, the World Economic Forum launched its “Reskilling Revolution” an initiative to reskill one billion people by 2030. At the time of the announcement, the WEF noted that, “Technological change, industry transitions and globalization are impacting jobs and the skills required within those jobs. The OECD estimates that 1.1 billion jobs are liable to be radically transformed by technology in the next decade. The World Economic Forum predicts an overall net positive between job growth and decline but also finds that skills instability with all jobs will mean that nearly half of core skills are set to change by 2022 alone. Additionally, if current trends continue, the outdated content of education will further exacerbate the skills mismatch in the future.”
The third point is the recognition by some, if not all advocates that very substantial obstacles must be overcome if reskilling is to succeed at the scale required.
The results for the United States from the OECD’s Program for the International Assessment of Adult Competencies (PIAAC) are grim reading. On the most recent assessment (conducted in 2017), 19% of US adults scored at the lowest level in literacy; 29% scored at the lowest level in numeracy, and a shocking 62% scored at the lowest level in problem solving in an information rich environment. For many Americans, reskilling will require a substantial investment in building basic skills that should have been learned at earlier stages of their education.
Moving from the individual to the institutional level of reskilling obstacles, in “Realism About Reskilling” Escobari et al from Brookings observe that, “The reskilling landscape today is made up of disconnected programs that, as a whole, struggle to serve low-wage workers and individuals already marginalized by other institutional structures.
“Together, the constellation of colleges, workforce programs, and other training providers form a Rube Goldberg contraption that often overwhelms individuals seeking to reskill or transition to a new job. Each program meets only some of the needs of some workers. People fall through the cracks and will continue to do so in the absence
of system redesign and better coordination across players.
“Over the past several decades, U.S. spending on reskilling has fallen dramatically. Federal funding for workforce development declined from a high of around $24 billion (in 2017 dollars) in the late 1970s to $5 billion by 2017.63 In total, Organization for Economic Co-operation and Development (OECD) data indicate that U.S. spending on labor market programs (employment incentives, training, and employment services) has declined from almost 0.24 percent of GDP in the mid-1980s to just 0.08 percent of GDP in 2017 (figure 1.3).
“Spending on training also declined, from 0.14 percent of GDP in 1985 to just 0.03 percent in 2017. Average spending on training across the OECD is more than four times higher— around 0.13 percent.
“A March 2019 Government Accountability Office (GAO) report on U.S. federal education and training programs [“Employment and Training Programs: Department of Labor Should Assess Efforts to Coordinate Services Across Programs”] found that the number of people served by the programs since 2011 declined by about 56 percent. Downward trends in financial investment and reach are compounded by noncooperation among workforce development agencies and their constituents. The GAO report identified 43 federal employment and training programs administered across nine agencies, with substantial overlap in services and fragmentation across departments.”
The US is far from alone in facing reskilling challenges. As the OECD noted in its 2019 Employment Outlook, “In a rapidly changing world of work, adult learning systems are under strain. Skill demands have been gradually, but consistently, shifting towards a more intensive use of cognitive and interpersonal skills under the combined forces of technology and globalisation. In this context, there is an urgent need to scale up and strengthen training opportunities for adults to keep their skills up to date or acquire new ones over longer working lives.
“Low-skilled adults are likely to bear the brunt of changes in skill needs unless they can engage in high-quality reskilling and upskilling programmes. Similarly, as new forms of work emerge at the border between self-employment and employee status, it is important to ensure that this does not translate into growing inequality in access to training based on employment status.
“While some countries are better prepared than others to address these changes, all face challenges – be it on participation, inclusiveness, financing or relevance and quality of the training provided. On average, two in five adults (40%) participate in job-related formal and non-formal training in any given year, and this often only involves training for only few hours, according to data from the OECD Survey of Adult Skills (PIAAC). The figure ranges from 20% or less in Greece, Italy and Turkey to just short of 60% in New Zealand and Norway, pointing to a need for a significant scaling-up in several countries to catch up with the best performers.
“If participation in training varies widely across OECD countries, what is common to all countries is that it remains very unequally distributed. Participation is especially low amongst those most in need of new or additional skills and among the rising number of workers in non-standard employment arrangements. To give a few examples, participation by low-skilled adults is a staggering 40 percentage points below that of high-skilled adults, in the OECD on average. Older adults are 25 percentage points less likely to train than 25-34 year-olds. Workers whose jobs are at high risk of automation are 30 percentage points less likely to engage in adult learning than their peers in less exposed jobs. Only 35% of own-account workers participate in training yearly compared with 57% of full-time permanent employees.”
Reskilling in the Larger Context: The Slow Emergence of a New Human Capital Ecosystem
I’ve been involved in Career and Technical Education for almost two decades, as an employer, parent, and in various volunteer roles in K-12 (secondary) education. At our affiliate, the Strategic Risk Institute, I’ve also experienced creating a course for the reskilling/upskilling market, and struggling with various government organizations. So what follows is based on personal experience, and might not be applicable in other places. But it gives
you a good idea of what the obstacles mean in practice, and why it has proven so hard to overcome them.
Reskilling is Just One Part of the Struggle to Create a New Lifetime Learning/Human Capital Ecosystem.
In the late 1970s, I graduated from university and joined Chase Manhattan Bank. I spent the next year in their credit training program. While that represented a very substantial investment by Chase in the development of its human capital, I received neither an academic degree nor any certification of the additional competencies I had acquired. At best, I received the “reflected glow” of the credit training program’s reputation, and hoped that in the future recruiters would recognize its value when they saw it on my (paper) CV.
I often think about how much some things have changed since then – and how many others have not.
I think of the reskilling and lifetime learning ecosystem challenge in terms of seven questions:
• Who defines mastery?
• Who enables the development of mastery?
• Who assesses mastery?
• Who certifies mastery?
• How does a person decide which areas of mastery to pursue?
• How is a person’s mastery communicated to potential employers in the labor market?
To varying degrees, all of these are broken, and powerful vested interests want to keep it that way.
Who Defines Mastery?
The traditional answer was accredited diploma or degree granting academic institutions. In recent years, however, traditional academic institutions’ lock on defining mastery has been supplanted by the emergence of a Wild West of certifications. For example, a 2019 survey by the US non-profit Credential Engine identified over 730,000 unique credentials (“Counting US Post Secondary Credentials”) in the United States, of widely varying specificity and marketplace value.
In the UK and Europe this is less of a problem, as both (along with Switzerland) have implemented national qualifications frameworks with consistent definitions that include both academic diplomas and degrees and industry certifications. For example, the Strategic Risk Governance and Management Course offered by our affiliate the Strategic Risk Institute, was designed to meet the UK government’s National Qualifications Framework’s standards for a Level 7 (post graduate) “Award” course (the lowest level, based on the time required to complete it, with “Certificate” and “Diploma” courses requiring more).
In the United States, Credential Engine is an effort to entice course providers to use their standardized method for defining the significance of their respective certificates of mastery. However, whereas the UK’s National Qualification Framework is relatively straightforward and easy to use, Credential Engine’s is extremely complicated for any organization trying to get their credential listed on it. And unlike the UK, Credential Engine’s customer service (at least in our experience) is terrible. Out of frustration, we gave up on it. And I’m sure we weren’t alone.
Who Enables the Development of Mastery?
Once again, in the US this has traditionally been bifurcated. Academic institutions enabled the development of mastery by paying students who took classes that led to the award of diplomas and degrees. Traditionally, this type of mastery was associated with the acquisition of a body of knowledge (and, in the case of PhD’s, its expansion).
In contrast, mastery associated with industry certifications has traditionally been more skill focused, and has been developed in multiple ways, including online courses, classroom courses at an academic institution, and in-person courses delivered on an employer’s site. These have been delivered by a range of providers, including community colleges’ “non-degree certificate programs” (which have been a growing source of revenues for them), consulting firms, specialized training firms, training affiliates of larger firms (e.g., Moody’s Credit Training courses), industry organizations (e.g., the Post-Tensioned Concrete Institute), and companies themselves.
Who Assesses a Candidate’s Attainment of Mastery?
For diploma and degree granting institutions, the answer has traditionally been relative simple: “We do.” However even they have increasingly found themselves competing with independent assessment providers, like the College Board (AP and SAT), NWEA (MAP), ACT, the Council for Aid to Education (the Collegiate Learning Assessment), and the OECD (PISA).
For other certifications, assessment of a candidate’s mastery is usually undertaken by the organization that defines it and provides the instruction and training a candidate needs to attain it. For example, the Chartered Financial Analysts (CFA) exam is offered by the CFA Institute, which also defines the mastery. More recently, however, larger organizations like Pearson VUE have begun to offer testing services in those cases where a certification has become popular, and multiple organizations are providing training.
Who Certifies Mastery?
Traditionally, the answer from accredited academic institutions is “Us”. You receive your diploma or degree from them, not a third party organization.
In the case of industry certificates of mastery, this varies widely. In some cases, it is the organization that defines the mastery, provides training to develop it, and conducts assessments. In the case of more popular certifications (e.g., in software engineering), the certification comes from the company that defined the mastery (e.g., Oracle or Adobe), even though many providers compete to help candidates develop it, and assessment may be provided by yet another organization (e.g., Pearson).
How does a person decide which areas of mastery to pursue?
Based on the most recent data (from 2018), today in the United States 64% of high school graduates immediately enroll in tertiary learning (college). However, the United States also has a relatively high dropout rate, especially in the early years. An issue for those who remain in college is the course of study to pursue. While a growing number of initiatives are trying to provide students with better information about the economic value of different majors (e.g., “What’s It Worth? The Economic Value of Different Majors” by the Georgetown University Center for Education and the Workforce), it is open to question how many students access this data and the extent to which it affects their decisions.
For students who drop out of college or never go at all, the situation is much worse. According to the National Skills Coalition, 52% of jobs in the United States require skills training beyond high school, but not a college degree. The challenge facing people pursuing these jobs is how to determine the economic value of and decide between the bewildering array of various type of certificates of mastery that are offered by an equally bewildering number of organizations and programs.
While this is widely recognized problem (e.g., see “Credential Currency: How States Can Identify and Promote Credentials of Value” by the Council of Chief State School Officers), thus far the pursuit of solutions is fragmented across states and initiatives like Skillful’s Career Coaching Corps. Our current labor market information systems are still a long way from meeting this challenge.
Another critical and hotly contested issue is the relationship between credentials and academic degree programs. In the UK, if a certificate program meets the requirements established by the National Qualifications Framework, successful participants can receive portable academic credits (under and established formula) that can be applied to degree programs at academic degree granting institutions.
This is far from the case in the United States, where academic degree granting institutions have (with a few competence-focused exceptions like Western Governors University and Southern New Hampshire University) aggressively resisted this approach. To the extent they have compromised, it is in cases where the certificate in question is earned in their classrooms (in which case, the primary result is academic credits, and the certificate is an add on).
How Is a Person’s Mastery Efficiently Communicated to Potential Employers in the Labor Market?
In the case of accredited academic institutions, the traditional answer is that you may put your degree (i.e., your Bachelors in Economics) on your CV or LinkedIn profile, perhaps with your grade point average, and we will verify this credential if anyone asks.
The body of knowledge that is signified by a BA in Economics, much less the set of skills that have been mastered, is ambiguous at best. So too is the overlap between the knowledge and skill mastery signified by different degrees (e.g., the practical English major who has taken accounting classes for her electives).
Industry certifications can be equally problematic for an employer, unless the knowledge and skill mastery they actually represent is very clear (e.g., as in the case of a CPA or CFA certificate). Unfortunately, this is not the case for most certificates, whose value is likely to be overlooked by the automated applicant management systems used by many companies today.
To be sure, there are initiatives underway to improve this situation and reduce the very substantial information frictions that exist in the labor market today.
For example, the Skillful initiative of the Markle Foundation is promoting the use of skills-focused training, job-description, and recruiting practices. The US Chamber of Commerce Foundation’s Job Data Exchange (JDX) project is on the same path. Those are encouraging. But both still have a long way to go. Today, our labor market information systems remain grossly inadequate even as the full force of the reskilling challenge draws closer at an accelerating pace.
The Current Ecosystem Has Turned Off a Surprising Number of Workers
Research by the Strada Center for Education Consumer Insights has found that 62% of American workers prefer non-degree programs and skills training to academic degree focused courses.
But 56% of American workers say they don’t have access to the education and training they want.
And 61% doubt that getting more education and training would be worth the cost.
Finally, for time squeezed workers, the current ways additional education and training is delivered don’t line up with their preferred mode of receiving it: 46% prefer online, 30% in person outside of work, and 23% during work hours.
The Bottom Line: Will Anyone Spend Scarce Financial and Political Capital to Change the Current Ecosystem to Enable Reskilling at Scale?
In her article, “Davos 2020: Unpacking the Upskilling Agenda”, London Business School Professor Lynda Gratton confronted the elephants in the room:
“Behind the public pledges to help retrain workers in this new economy, there are nagging “Why bother?” questions from all the stakeholders that threaten to derail the efforts:
“Why would a company pay for someone to be upskilled when that person could walk out of the door with the newly acquired skills — and, more important, take these skills to a competitor?”
“Why should a government pay for someone to be upskilled when it is not clear that those new skills will make a positive impact on his productivity and therefore the health of the economy — particularly at a time when there are other competing asks, such as health care, on the public purse?”
“Why would a worker be motivated to be reskilled when she doesn’t have the time or the money and when she cannot anticipate whether the skill she’s acquiring will make her more marketable?”
Conclusion and Forecast
Good forecasters start with base rate/reference case data, and then consider the extent to which they should adjust it given specific details about the focus forecast question.
In the United States, the history of government sponsored retraining programs over the past sixty years, from the Manpower Development and Training Act in the 1960s, to Comprehensive Employment and Training Act (CETA) in the 1970s to the Job Training and Partnership Act in the 1980s to the Workplace Investment Act in the 1990s to the Workforce Innovation and Opportunity Act in the 2010s is a generally a story of lofty ambitions, poor implementation, and disappointing results.
In contrast, corporate training programs have a much better track record over the years of reskilling employees. Unfortunately, most of them have been sharply cut back as intensifying global competition put downward pressure on revenues, the rise of “financialized capitalism” increased investors’ demands for high returns, and previous norms related to employee loyalty were eroded by multiple pressures (e.g., outsourcing, automation, more frequent M&A activity, etc.).
While a promising new education ecosystem is slowly emerging, it is unlikely (30% probability, +/- 10%) to achieve the maturity required to adequately respond to the sharp increase in demand for reskilling that will soon be upon us.
A critical uncertainty to monitor is the development much better labor market information systems that are a fundamental constraint on the speed at which the new ecosystem will mature.
Last but not least, what are the likely consequences of failing to meet the reskilling challenge? Economically, lower productivity and GDP growth. Socially, worsening inequality and anger at elites. Politically, more conflict and accelerating drift towards populist extremes on the left and right.
Pre-Mortem: Assume this forecast turns out to be wrong. Why could that happen?
• Intensifying conflict with China leads to increased reshoring of production to the United States, sharp increase in demand for employees with advanced skills, and stronger government and industry support for reskilling, including regulatory or legislative action to overcome obstacles to standardization of skill-based credentials and development of national labor market information system.
• Legislation or regulation that mandates the creation of tax exempt employee training accounts, the balance in which must be used each year for reskilling (e.g., similar to continuing professional education requirements for CPAs). These could be funded by a combination of employers and the government. However the success of this initiative would almost certainly also require standardization of skill-based credentials and development of national labor market information system.
High Value Information Observed In March 2021
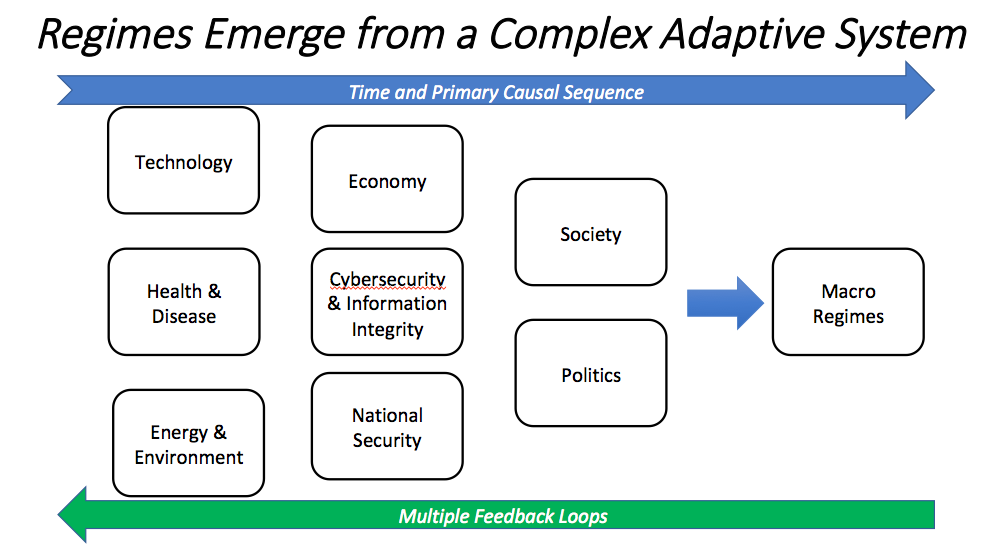
In our model of the complex global macro system, change drivers are arrayed across a roughly chronological process (albeit one with many feedback loops), in which technological, health, and environmental changes precede changes in the economy and national security, which in turn lead to changes in society and politics, all of which produce (albeit with multiple feedback loops) the effects we observe in investor behavior and financial market valuations and returns.
To generate alternative future scenarios and critical forecasting questions, we use this framework to identify multiple paths across these issue areas, including alternative outcomes for critical uncertainties.
In our methodology, we take a Bayesian approach, and classify new information as significant and highly valuable if either it (1) is an “indicator”, which reduces our uncertainty about the value of a parameter in our mental model for making sense of the dynamic macro system, or (2) it is a “surprise” which increases our uncertainty about either the range of potential values for a parameter or the structure of our model.
With respect to indicators, the higher our priori probability is for a regime, the more we look for indicators that it will not occur, and the lower our prior probability for a regime, the more we look for indicators that it will occur. Put differently, try to systematically search for high value indicators that disconfirm our prior views.
| New Technology Information: Indicators and Surprises | Why Is This Information Valuable? |
| “People Systematically Overlook Subtractive Changes”, by Adams et al | SUPRISE In his book, “The Collapse of Complex Societies”, Joseph Tainter provided evidence for his theory that as societies solve problems, they become more complex over time. However as complexity increases, it produces diminishing positive returns, and later increasing negative returns. Eventually, this process leads to collapse. In addition, we noted that growing complexity also leads to increasing uncertainty, which also has a range of negative effects, such as increased conformity, reduced investment and other social phenomena. In this paper, the authors show that the tendency towards increasing complexity has deep psychological roots, finding that, “people systematically default to searching for additive transformations [that increase complexity], and consequently overlook subtractive transformations [that decrease it].” |
| “Pervasive Label Errors in Test Sets Destabilize Machine Learning Benchmarks”, by Northcutt et al | SUPRRISE “Large labeled data sets have been critical to the success of supervised machine learning across the board in domains such as image classification, sentiment analysis, and audio classification. Yet, the processes used to construct datasets often involve some degree of automatic labeling or crowdsourcing, techniques which are inherently error-prone… “Researchers rely on benchmark test datasets to evaluate and measure progress in the state-of-the-art and to validate theoretical findings. If label errors occurred profusely, they could potentially undermine the framework by which we measure progress in machine learning … “We identify label errors in the test sets of 10 of the most commonly-used computer vision, natural language, and audio datasets, and subsequently study the potential for these label errors to affect benchmark results. Errors in test sets are numerous and widespread: we estimate an average of 3.4% errors across the 10 datasets” … As a result, “higher-capacity [machine learning] models undesirably reflect the distribution of systematic label errors in their predictions to a far greater degree than models with fewer parameters, and this effect increases with the prevalence of mislabeled test data.” |
| “Accelerating Science with Human Versus Alien Artificial Intelligences” by Sourati and Evans | SURPRISE “Research across applied science and engineering, from materials discovery to drug and vaccine development, is hampered by enormous design spaces that overwhelm researchers’ ability to evaluate the full range of potentially valuable candidate designs by simulation and experiment. “To face this challenge, researchers have initialized data-driven AI models with published scientific results to create powerful prediction engines. “These models are being used to enable discovery of novel materials with desirable properties and targeted construction of new therapies. But such efforts typically ignore the distribution of scientists and inventors—human prediction engines—who continuously alter the landscape of discovery and invention. “As a result, AI algorithms unwittingly compete with human experts, failing to complement them and augment collective advance. “As we demonstrate, incorporating knowledge of human experts and expertise can improve predictions of future discoveries by more than 100% above AI methods that ignore them. “Nevertheless, with tens of millions of active scientists and engineers around the world, is the production of artificial intelligences that mimic human capacity our most strategic or ethical investment? “By not mimicking, but rather avoiding human inferences we can design “alien” AIs that radically augment rather than replace human capacity. Identifying the bias of collective human discovery, we demonstrate how human-avoiding or alien algorithms broaden the scope of things discovered by identifying hypotheses unlikely for scientists and inventors to imagine or pursue with undiminished signs of scientific and technological promise… not only accelerating but punctuating scientific advance.” |
| “Morningstar Unleashes Robots to Write Fund Research”, by Michael Mackenzie in the Financial Times | “Morningstar has found a way to increase its written research without further taxing its army of human analysts. “The machine-generated reports that began rolling out this week set out the rationale behind Morningstar’s so-called analyst rating on a fund… Morningstar said this week that the robot ratings have performed as well as the recommendations generated by human analysts, based on three years of data.” |
| | |
| | |
| | |
| | |
| | |
| | |
| | |
| | |
| | |
| New Energy and Environment Information: Indicators and Surprises | Why Is This Information Valuable? |
| “Observational Evidence Of Increasing Global Radiative Forcing” by Kramer et al | “Climate change is a response to energy imbalances in the climate system. For example, rising greenhouse gases directly cause an initial imbalance, the radiative forcing, in the planetary radiation budget, and surface temperatures increase in response as the climate attempts to restore balance. The radiative forcing and subsequent radiative feedbacks dictate the amount of warming. “While there are well‐established observational records of greenhouse gas concentrations and surface temperatures, there is not yet a global measure of the radiative forcing, in part because current satellite observations of Earth’s radiation only measure the sum total of radiation changes that occur. “We use the radiative kernel technique to isolate radiative forcing from total radiative changes and find it has increased from 2003 through 2018, accounting for nearly all of the long‐term growth in the total top‐of‐atmosphere radiation imbalance during this period. “We confirm that rising greenhouse gas concentrations account for most of the increases in the radiative forcing, along with reductions in reflective aerosols. This serves as direct evidence that anthropogenic activity has affected Earth’ energy budget in the recent past.” |
| “India Castigates Richer Countries As Climate Tensions Heat Up”, by Leslie Hook in the Financial Times | SUPRRISE “While the US, China and the EU are broadly in agreement about the importance of cutting emissions to near zero by the middle of the century, India remains as outlier… “India wants richer countries to adopt ‘net negative’ emissions targets and launched a broadside against the climate goals of big emitters in the EU and China, in a sign of how climate negotiations are heating up ahead of a UN summit this year… “Net negative emissions refers to the absorption of more carbon dioxide from the atmosphere than a country emits — currently Bhutan is the only country in the world that is net negative because of its extensive hydropower and forests… “Indian energy minister R K Singh told a virtual gathering of the world’s climate leaders that targets set for 2050 or 2060 were just “a pie in the sky”. He said that developing countries such as India should not be forced to cut their emissions to net zero.” |
| “Reflecting Sunlight: Recommendations for Solar Geoengineering Research and Research Governance” by the National Academy of Sciences | SURPRISE “In 2015, the National Research Council published a two-volume report that provided a technical evaluation and discussion of the impacts of geoengineering climate. One volume addressed technologies for removing carbon dioxide from the atmosphere. “The other explored prospects for cooling the planet by albedo modification—increasing the reflection of solar radiation. A central conclusion from the 2015 study was that the two families of approaches for geoengineering climate differ greatly, in terms of scientific understanding, technical feasibility, risks, and societal implications… “Since 2015, the motivation for understanding the full range of options for dealing with the climate crisis has gotten even stronger. Globally, 2015–2019 were the 5 warmest years in the instrumental record. Understanding of the link between warming and extreme heat, wildfires, drought, hurricanes, and diverse socioeconomic impacts is stronger than ever… “Meeting the challenge of climate change requires a portfolio of options. The centerpiece of this portfolio should be reducing GHG emissions, removing and reliably sequestering carbon from the atmosphere, and pursuing adaptation to climate change impacts that have already occurred or will occur in the future. “Concerns that these three options together are not being pursued at the level or pace needed to avoid the worst consequences of climate change—or that even if vigorously pursued will not be sufficient to avoid the worst consequences—have led some to suggest the value of exploring additional response strategies. This includes solar geoengineering (SG), which refers to attempts to moderate warming by increasing the amount of sunlight that the atmosphere reflects back to space or by reducing the trapping of outgoing thermal radiation ... “This current study was tasked to update the 2015 assessment of the state of understanding and to provide recommendations for how to establish a research program, what to encompass in the research agenda, and what mechanisms to employ for governing this research … “SG could reduce surface temperatures and potentially ameliorate some risks posed by climate change (e.g., to avoid crossing critical climate “tipping points”; to reduce harmful impacts of weather extremes). “Yet these interventions could also introduce an array of potential new risks, for instance, related to critical atmospheric processes (e.g., loss of stratospheric ozone); important aspects of regional climate (e.g., behavior of the Indian monsoon); or numerous interacting environmental, social, political, and economic factors that can interact in complex, potentially unknowable ways… “SG research to date is ad hoc and fragmented, with substantial knowledge gaps and uncertainties in many critical areas. There is a need for greater transdisciplinary integration in research, linking physical, social, and ethical dimensions, and inclusion of robust public engagement… “Research to understand the potential magnitude and distribution of SG impacts—on ecosystems, human health, political and economic systems, and other issues of societal concern—is in a particularly nascent state. Studies published to date do not provide a sufficient basis for supporting informed decisions.” |
| Two new Gallup polls found Americans more concerned about a future energy shortage and less concerned with environmental protection. | SURPRISE In “Americans Show Elevated Concern About Energy”, Gallup reports that, “73% of Americans worry about the availability and affordability of energy, up from 54% last year”. This includes 73% of Republicans, 69% of Independents, and 73% of Democrats. In addition, “a majority (53%) says U.S. will face critical energy shortage in next five years”, up from 32% in 2016. In “Americans' Emphasis on Environmental Protection Shrinks”, Gallup finds that, “As the country continues to recover from the economic shock waves created by the coronavirus pandemic, Americans are more divided than they have been in several years about whether protecting the environment (50%) or strengthening the economy (42%).” “The split between Republicans (68% of whom say the economy should take precedence) and Democrats (71% of whom prioritize the environment) is stark.” |
| | |
| | |
| | |
| | |
| | |
| | |
| | |
| | |
| | |
| New Economic Information: Indicators and Surprises | Why Is This Information Valuable? |
| “The Corporate Erosion of Capitalism”, by Oren Cass from American Compass | SURPRISE Most of the productivity benefits to the economy from new technologies are embodied in new capital investment. If the level of investment is low, so too will be the rate at which productivity benefits appear. This critical new research “provides a systematic, firm-level study of declining business investment and the recent transformation of the typical American corporation’s business strategy to one that disgorges cash to shareholders while failing to replenish its capital base. The study uses the Standard & Poor’s Compustat database to analyze the cash flows of all companies headquartered in the United States and publicly traded on the NYSE and NASDAQ from 1971 to 2017. “Firms are placed in three categories: 1. A Grower is a firm with capital expenditures in excess of earnings before income, taxes, depreciation, and amortization (EBITDA), which taps capital markets to finance investment. 2. A Sustainer is a firm that makes capital expenditures greater than its consumption of fixed capital and also returns cash to shareholders, with EBITDA sufficient to do both. 3. An Eroder is a firm that consumes its fixed capital faster than it makes new capital expenditures, while still returning cash to shareholders, though its EBITDA would be sufficient to replenish its capital base. “In short, a Grower is the archetypical user of the financial markets. A Sustainer is the archetypical successful capitalist enterprise. An Eroder is a strange type of firm that seems to harvest its own organs for its shareholders’ short-term benefit. “While not all firms fit these categories, the vast majority do, accounting for 90% of market capitalization over the past half century. “The American economy has undergone a dramatic transition in recent decades, from one in which most large firms were Sustainers and very fe were Eroders to one in which Eroders predominate. “During 1971–85, Sustainers averaged 82% of market capitalization and Eroders 6%. By 2000, these shares had shifted to 59% and 19%, respectively. In 2009, Eroder market capitalization surpassed Sustainer market capitalization for the first time. In 2017, Sustainers accounted for 40% of market capitalization and Eroders for 49%; Growers averaged 9% of market capitalization during 1971–85 versus 3% in 2017. “The problem is not that the economy is transitioning toward more asset-light industries; this analysis evaluates companies’ investment relative to their own capital bases, not an arbitrary level of expected investment. “Further, the same pattern emerges within sectors from manufacturing to information. Within the manufacturing sector, the Eroder share rose from an average of 7% during 1971–85 to 47% during 2009–17. Within the information sector, which includes media, communications, internet and software companies, the Eroder share rose from 2% to 52% in those respective periods. “As a result of this behavior by firms, the share of GDP flowing out of the operating economy has risen steadily. Net outflows averaged 1.5% of GDP during 1971–85 and 1.8% of GDP during 1971–99, but that rate more than doubled to 4.0% during 2009–17. “The investment shortfall over this latter period is $3.1 trillion. This offers almost a mirror image of the decline in net nonresidential investment for the economy as a whole, from an average of 4.3% of GDP during 1971–85 and 3.8% of GDP during 1971–99 to an average of 2.3% during 2009–17.” |
| A number of new papers and posts focus on the changing nature of the economy and the apparent logic guiding the Biden Administration’s policies | In “Foundations of Complexity Economics”, Brian Arthur provides a succinct overview of how complexity economics differs from traditional approaches (a complex adaptive system approach is one of the foundations of our belief system at the Index Investor). Complexity economics is not based on a single “representative agent.” Instead, it assumes that agents differ, that they have imperfect information about other agents and must, therefore, try to make sense of the situation they face. Agents explore, react and constantly change their actions and strategies in response to the outcome they mutually create. “The resulting outcome may not be in equilibrium and may display patterns and emergent phenomena not visible to equilibrium analysis. The economy becomes something not given and existing but constantly forming from a developing set of actions, strategies and beliefs — something not mechanistic, static, timeless and perfect but organic, always creating itself, alive and full of messy vitality.” In the Wall Street Journal, Greg Ip describes the difference between “the Old View” and the “New View” of economics (“How Bidenomics Seeks to Remake the Economic Consensus”): “If you studied, practiced or wrote about economic policy in the past few decades you probably absorbed certain rules about how the world worked: governments should avoid deficits, liberalize trade and trust in markets. Taxes and social programs shouldn’t discourage work. “This canon came to be known globally as the ‘Washington consensus’ and in the U.S. as neoliberalism. The latter label has always been more popular with its critics than its adherents. Nonetheless, by fusing the free-market foundations of classical liberalism with some redistribution and regulation, the term broadly described the economic policy of western leaders from Ronald Reagan and Margaret Thatcher through Bill Clinton and Tony Blair to George W. Bush, Barack Obama and David Cameron. “Neoliberalism has since fallen from grace under former President Donald Trump and now President Biden. But where Mr. Trump’s populism was never grounded in economics, Mr. Biden’s embrace of bigger government is: not the economics of the establishment but of left-wing thinkers in academia and think tanks and on Twitter.” On his Grumpy Economist blog, John Cochrane summed up Ip’s central concerns: “Old View: Scarcity is the default condition of economies: the demand for goods, services, labor and capital is limitless, their supply is limited. ...faster growth requires raising potential by increasing incentives to work and invest. Macroeconomic tools—monetary and fiscal policy — are only occasionally needed to deal with recessions and inflation. “New View: Slack is the default condition of economies. Growth is held back not by supply but chronic lack of demand, calling for continuously stimulative fiscal and monetary policy. “Old View: Fiscal policy shouldn’t push unemployment below the level that causes inflation to rise, which would force the Federal Reserve to raise interest rates. “New View: Fiscal and monetary policy should push unemployment as low as they can because low unemployment doesn’t cause inflation and if eventually it does, that’s socially much less costly than persistent unemployment. “Old View: Because savings are scarce, government budget deficits push up interest rates and crowd out private investment and should be avoided except during recessions. “New view: Low interest rates globally show that savings are plentiful and demand is chronically weak, so deficits aren’t harmful and may be necessary. Larry Summers has labeled this secular stagnation. “Modern monetary theory”—which few economists, even on the left, embrace—goes further, arguing deficits never crowd out private investment or raise interest rates.” Old View: Social programs should be targeted to those who need them most because money is scarce. Aid should encourage work because that raises gross domestic product and confers dignity. New View: Because money isn’t scarce—see above—aid can and should be universal so that no one falls between the cracks. GDP and paid work are overrated because much of what makes life worthwhile, such as caregiving, is generated outside the market. This is the rationale for universal basic income and, to some extent, Mr. Biden’s expanded child tax credit.” “Old View: High tax rates on income and profits discourage work and investment while high minimum wages reduce employment for the low skilled. Market mechanisms can achieve social goals such as lower greenhouse gas emissions more cheaply than fiat regulations. “New View: Monopoly power and barriers to market entry are pervasive, enabling the rich and corporations to accumulate far more wealth and profits—and pay workers less—than a truly competitive market would permit. Higher tax rates have little effect on incentives and higher minimum wages have no effect on employment. Market mechanisms like carbon prices perpetuate existing inequities.” Ip concludes, “Bidenomics is more a political movement than a school of economic thought. The Democratic base has moved left, energized by inequality, climate change and the coronavirus pandemic, as well as by Mr. Trump and the Republican Party’s rightward shift. That base now seeks, through Mr. Biden, to reshape the economy and society for years to come. “The problem with economic policies subordinated to political imperatives is that they have no limiting principle: if $3 trillion in stimulus is OK, why not $6 trillion? If a $15 minimum wage is harmless, why not $30? “Mr. Biden can ignore limiting principles for now for one reason above all: interest rates are near zero. In fact, Fed Chairman Jerome Powell is the single most important player in Bidenomics. But low rates and the Fed’s relaxed attitude toward inflation are products of today’s circumstances, not permanent new features of the economy. The longer Bidenomics proceeds as if limits don’t exist, the more likely it is to hit them.” |
| For the past 25 years, William White, formerly of the Bank of Canada and later the Bank for International Settlements, has had an acute understanding of the problems building up in the global macroeconomy and financial system. His forecasts have been spot on, and too often ignored (such is the fate of Cassandras). He recently published a trenchant critique of the current situation. | In “The Full Case Against Low and Negative Interest Rates”, White warns that, “There are several reasons why unprecedentedly low interest rates will probably not stimulate demand and may even threaten financial stability” … “Concerns have been raised that unprecedented policy responses might increase uncertainty and suppress the “animal spirits” necessary to motivate sustained spending. Turning to the components of demand, consumption might also suffer if low rates of accumulation mean people must save more to meet retirement goals. “Perhaps more importantly, there is reason to believe that the effectiveness of monetary stimulus diminishes with extended or repeated use. Lower rates induce people to borrow and to spend today what they would otherwise have spent tomorrow. The ratio of global debt (governments plus households and corporates) to GDP had in fact risen by over 50 percentage points prior to the pandemic. “However, if the spending is used for unproductive purposes, as is often the case, then the buildup of debt eventually becomes burdensome and slows future spending. In short, there is a negative feedback loop. At first, this can be offset by ever more aggressive easing but, as the headwinds grow stronger, monetary policy eventually ceases to work at all” … “A bigger problem is that, if monetary stimulus is sustained for a long period, then undesirable side effects accumulate. The first of these is the higher debt level, which increases systemic risk… “However, debt accumulation is not the only unintended consequence of relying on monetary stimulus. “Such policies also threaten financial stability in various ways. They pose a danger to the survival of financial institutions and to pension funds by squeezing net returns on traditional assets. “Moreover, institutions subject to such threats then “reach for yield” in an attempt to compensate, often leaving themselves open to risks that they had not anticipated and have no experience of managing. A related concern is that of growing “moral hazard.” “Every time a problem materializes, the central banks or regulators create another safety net to protect the exposed, which then encourages them to behave even more badly. “Similarly, unusually easy monetary conditions over long periods can threaten the effective functioning of financial markets. In recent years, we have documented: recurrent “flash crashes”; waves of Risk-On and Risk-Off behavior; persistent “anomalies” from normal price relationships; growing evidence that normal “price discovery” has been suppressed; and finally, the near-collapse of the US Treasuries market in September 2019 and March 2020. Moreover, easy monetary conditions lead to continuing increases (bubbles?) in the prices of virtually all financial assets and often to real assets (like houses and other property) as well. “For a long while, these price increases can mask the other undesired consequences of easy monetary conditions but, as “fundamentals” eventually reassert themselves, a price collapse can easily follow.” |
| “Sovereign Debt In The 21st Century: Looking Backward, Looking Forward”, by Mitchener and Trebesch | How will sovereign debt markets evolve in the 21st century? We survey how the literature has responded to the Eurozone debt crisis, placing “lessons learned” in historical perspective. The crisis featured: (i) the return of debt problems to advanced economies; (ii) a bank- sovereign “doom-loop” and the propagation of sovereign risk to households and firms; (iii) roll-over problems and self-fulfilling crisis dynamics; (iv) severe debt distress without outright sovereign defaults; (v) large-scale “sovereign bailouts” from abroad; and (vi) creditor threats to litigate and hold out in a debt restructuring. “Many of these characteristics were already present in historical debt crises and are likely to remain relevant in the future. Looking forward, our survey points to a growing role of sovereign-bank linkages, legal risks, domestic debt and default, and of official creditors, due to new lenders such as China as well as the increasing dominance of central banks in global debt markets. “Questions of debt sustainability and default will remain acute in both developing and advanced economies. See also: “Prepare for an Emerging Markets Debt Crisis, Warns IMF Head” by Chris Giles in the Financial Times |
| “How China Lends: A Rare Look into 100 Debt Contracts with Foreign Governments”, by Gelpern et al | SUPRRISE “China is the world’s largest official creditor, but we lack basic facts about the terms and conditions of its lending. Very few contracts between Chinese lenders and their government borrowers have ever been published or studied. This paper is the first systematic analysis of the legal terms of China’s foreign lending… “Three main insights emerge. First, the Chinese contracts contain unusual confidentiality clauses that bar borrowers from revealing the terms or even the existence of the debt. Second, Chinese lenders seek advantage over other creditors, using collateral arrangements such as lender-controlled revenue accounts and promises to keep the debt out of collective restructuring (“no Paris Club” clauses). Third, cancellation, acceleration, and stabilization clauses in Chinese contracts potentially allow the lenders to influence debtors’ domestic and foreign policies.” |
| “The Economic Effects of Financing a Large and Permanent Increase in Government Spending”, by The US Congressional Budget Office | The authors “analyze the long-term economic effects of financing a large and permanent increase in government expenditures of 5 percent to 10 percent of gross domestic product (GDP) annually. This paper does not assess the economic effects of the increased government spending and focuses solely on the effects of their financing” … “The review focuses on how taxes on labor income, capital income, and consumption affect how much people work and save. The general finding is that increasing taxes leads to lower GDP and personal consumption. Of the different tax policies examined, consumption taxes are likely to have the smallest effects on saving and work decisions and hence the smallest negative consequences on future economic growth. Finally, deficit financing leads to higher interest rates, a lower capital stock, lower GDP, and a greater risk of a fiscal crisis.” |
| “2021: The Year of Another Eurozone Debt Crisis?” by Desmond Lachman from AEI | SURPRISE “Anyone who thinks that we are not on the road to another round of the Eurozone debt crisis has not been paying attention to the goings-on of the German Constitutional Court. “At the very time that key pandemic-ravaged Eurozone member countries like Italy and Spain are desperately in need of a helping hand from their Eurozone partners, the German court has chosen to throw a spanner in the works for the launching of the Eurozone Recovery Fund. “That action would seem all too likely to be but a warm-up for the German court to challenge once again the legality of the European Central Bank’s current aggressive bond-buying program aimed at keeping the Italian and Spanish economies afloat. “Last May, in an attempt to provide much-needed budget support to those highly indebted European countries like Italy and Spain, which had been laid low by the pandemic, the European Union agreed upon the need for a $750 billion European Recovery Fund. “The novelty of this fund, which was widely hailed as the Eurozone’s Hamiltonian moment, would be the placement of a bond that would be jointly guaranteed by all of the European Union’s member countries. “Judging from its ruling last Friday, the German Constitutional Court entertains serious doubts as to whether the issuing of jointly guaranteed bonds is consistent with the Lisbon Treaty. In a stunning move, it has put a temporary halt to a German law ratifying the European Recovery Fund, pending an urgent appeal against the legislation by a group of Eurosceptic German citizens. “While the court’s decision will certainly delay the recovery fund’s ratification at a time that it is sorely needed to provide a boost to the European economy, it is most unlikely that it will derail the fund. Rather, it is more likely that once again the court will find a political fudge to allow the fund to be ratified as it did in its last stand-ox with the European Central Bank. “The real significance of the German court’s recent decision is what it might mean for the very much more important issue of the European Central Bank’s (ECB) aggressive bond-buying program. This would seem to be especially the case considering that not only has the ECB substantially expanded its bond-buying program in the wake of the pandemic. It has also now directed most of its bond-buying under that program towards Italy and Spain, which have unusually large budget deficits and unusually high public debt levels. “Under Article 123 of the Lisbon Treaty, the ECB is explicitly precluded from engaging in monetary financing of a member country’s budget deficit. This must make one think that it must only be a matter of time before the German Court locks horns again with the ECB about its bond-buying program.” See also, “German Court Challenge To EU Recovery Fund Could Last Months” by Arnold et al in the Financial Times |
| “Insolvency Prospects Among Small-and-Medium-Sized Enterprises in Advanced Economies: Assessment and Policy Options”, by Diez et al from the IMF | “The COVID-19 pandemic has increased insolvency risks, especially among small and medium enterprises (SMEs), which are vastly overrepresented in hard-hit sectors. Without government intervention, even firms that are viable a priori could end up being liquidated—particularly in sectors characterized by labor-intensive technologies, threatening both macroeconomic and social stability… “Solvency support should be complemented by an effective set of insolvency and debt restructuring tools, including dedicated out-of-court restructuring mechanisms, hybrid restructuring, and stronger insolvency procedures—including simplified reorganization for smaller firms, to raise the system’s capacity. Because liquidations of a priori viable firms may occur even under adequate insolvency procedures, government incentives could be considered to tilt the balance toward restructuring.” |
| The Biden Administration announced another very large ($2.25 trillion) stimulus program (the “American Jobs Plan”) focused on “infrastructure investment.” However, a closer examination shows that the term “infrastructure” has been stretched beyond all recognition. | As Larry Summers and many others have warned (and I lived through in South American in the 1980s), government borrowing to fund transfer payments and current consumption is a dangerous strategy that eventually self-destructs when investors lose confidence in a country’s willingness and/or ability to repay its debt. It is therefore critical to ensure that borrowed funds are invested in a way that will increase long-term economic growth, to maintain investors’ confidence in a nation’s ability to service its debt. Some of the Biden proposals certainly seem to meet that test, including $621billion for highways, ports, bridges, rail and mass transit; $100 billion to upgrade the nation’s electrical grid; $100 billion to increase access to broadband; and $56 billion to upgrade water infrastructure. All in, about 40% of the proposed $2.25 trillion. Unfortunately, the proposal says nothing about how to control cost overruns and permitting/litigation delays on these projects, which will very likely blunt a significant part of their impact (e.g., see, “For Infrastructure Projects to Succeed, Think Slow and Act Fast” by Flyvbjerg and Gardner, and Edward Glaeser’s 2016 classic, “If You Build It: Myths And Realities About America’s Infrastructure Spending”). The impact of the remaining 60% of the proposed spending on long term economic growth is much more questionable (e.g., see, “Measuring Infrastructure in the BEA’s National Economic Accounts”, by Bennett et al). This includes $174 billion to boost the electric vehicle market; $213 billion for retrofitting buildings and building affordable housing (and, presumably, legal fees for zoning fights); $590 billion for R&D and job training initiatives and support for domestic manufacturing; and $400 billion “to expand home care services and provide additional support for care workers”, including higher wages and an easier route to unionization. As we’ve written before, we think it is quite a stretch to believe that large number of men who have lost their jobs (to automation our outsourcing) in traditionally “male” industries will easily transition to traditionally caring “female” industries. |
| | |
| | |
| | |
| | |
| | |
| | |
| | |
| | |
| | |
| | |
| New National Security Information: Indicators and Surprises | Why Is This Information Valuable? |
| Russia is massing troops on the Ukrainian border, and uncertainty is high about whether another invasion is imminent. | SURPRISE Seven years after Russia invaded the Crimea, Politico notes that “the same factors that led up to [Putin’s previous invasion of the Ukraine) are in place again, including domestic protests [in Russia], a struggling economy, and a desire for glory” (“Could Putin Launch Another Invasion?”). The Financial Times observes that, “after eras of prosperity and patriotism, Russia’s president is now ramping up repression to hold on to power” (“The Brutal Third Act of Vladimir Putin”, by Henry Foy). Critically, a 2016 RAND analysis wargamed a Russian invasion of the Baltic countries (Estonia, Lithuania, and Latvia), which could be a logical extension of or complement to a Russian invasion of the Ukraine. RAND’s conclusion was unambiguous: “As presently postured, NATO cannot successfully defend the territory of its most exposed members… “Across multiple games using a wide range of expert participants in and out of uniform playing both sides, the longest it has taken Russian forces to reach the outskirts of the Estonian and/or Latvian capitals of Tallinn and Riga, respectively, is 60 hours. “Such a rapid defeat would leave NATO with a limited number of options, all bad.” Clearly, a simultaneous Russian attack on Ukraine and the Baltics and Chinese move on Taiwan (and perhaps an Iranian move in the Persian Gulf region) would confront the West with a very difficult choice between a devastating strategic defeat and all the risks that accompany escalation of a conflict on multiple fronts. Unfortunately, the probability of such a scenario, while still very unlikely (5% - 20%), is increasing. |
| There is an increasing probability that next spring’s French Presidential election could be won by Marine Le Pen, leader of the right wing populist Rassemblement National party. | SURPRISE In “French Politics: Macro Faces Test of Character as Le Pen’s Popularity Grows”, the Financial Times Victor Mallet notes that “The arguments among French politicians [about a possible Le Pen victory], have become so fevered that they have sometimes even displaced the deadly Covid-19 pandemic as a topic of debate. [They] suggest there is at least the possibility of a political shock in France akin to Brexit and Trump. “’There are lots of ingredients that are the same,’ says Chloé Morin, an analyst at the Fondation Jean-Jaurès think-tank. ‘A rejection of elites. Feelings of injustice. The desire to take control of one’s country’s destiny’.” |
| “Climate, Violence, And Honduran Migration To The United States” by Bermeo and Leblang from Brookings | “Honduras is one of the poorest countries in the Western hemisphere. It has experienced one of the world’s highest homicide rates, with multiple forms of violence linked to drug trafficking groups and gangs. Over the last decade, the country has suffered from repeated droughts linked to climate change that have increased food insecurity, particularly for subsistence farmers in the Dry Corridor of Central America, where some areas have experienced seasonal crop loss greater than 70 percent.” As predicted in many studies, this combination of climate shock and the breakdown of civil order has produced an exponential increase in emigration to the United States. The authors find that “apprehensions of family units from Honduras illegally arriving at the U.S. southern border grew between 2012 and 2019, from 513 to 188,368.” |
| China and Iran signed a 25-year cooperation agreement, further formalizing the increasingly close de-facto alliance that is emerging between China, Russia, and Iran. | SURPRISE As Amin Saikal from the Australian Strategic Policy Institute notes, “The agreement is the culmination of growing economic, trade and military ties between the two countries since the advent of the Iranian Islamic regime following the revolutionary overthrow of the Shah’s pro-Western monarchy 41 years ago. “Although the contents of the deal haven’t been fully disclosed, it will certainly involve massive Chinese investment in Iran’s infrastructural, industrial, economic and petrochemical sectors. It will also strengthen military, intelligence and counterterrorism cooperation, and links Iran substantially to China’s Belt and Road Initiative as an instrument of global influence… “Underpinning this exponential elevation of relations is the two sides’ mutual interest in countering the US and its allies. “Deeper and wider cooperation between China and Iran, especially when considered in the context of their close ties with Russia and the trio’s adversarial relations with the US, carries a strong potential for changing the regional strategic landscape.” |
| “China’s Domestic-Security Agencies are Undergoing A Massive Purge” in The Economist | SURPRISE The timing of this is ominous. Why would an authoritarian leader decide to purge their domestic security and repression organizations? Very likely because said leader expects an increase in domestic opposition, say because of deteriorating economic conditions (and growing middle class frustration) and/or because of potential opposition to the leaders’ international moves, and the casualties and economic disruption they may trigger. As the Economist notes, “For many members of China’s 3m-strong domestic-security forces, these must be worrying times. On February 27th the Communist Party declared the start of a long-expected purge of their ranks. It will involve, say officials, “turning the knife-blade inward” to gouge out those deemed corrupt or insufficiently loyal to the party and its leader, Xi Jinping. More than eight years into Mr Xi’s iron rule, the party appears to wonder whether a vital bulwark of its power is entirely trustworthy.” |
| “Did China Cross A New Red Line In Cyberspace?” by Montgomery and Logan in The Guardian | SUPRRISE “Did China cause the blackouts in Mumbai last year? Nearly six months later, the answer is still unclear, but if recent reports that a Chinese cyber operation bears partial responsibility are accurate, Beijing just signalled a willingness to use its cyber power to target civilian lifeline infrastructure during a crisis. Even more worrying, the hackers used hard-to control cyberattack tools in a destructive manner against a nuclear-armed country, India. “In a report last month, threat analysts at the cybersecurity firm Recorded Future detailed their discovery of China’s systematic penetration of India’s electricity infrastructure. “Given the event’s concurrence with the border skirmishes in the disputed area of Galwan Valley, the Chinese hackers appear to have targeted nodes of India’s electric grid to demonstrate Beijing’s capabilities and to convince New Delhi that it should not oppose China’s claims over the area. “Without analysis of the malware or confirmation from Indian officials, we will not know if malware was responsible for the Mumbai blackout, if the outage was caused by operator error while responding to the malware, or if the outage was some kind of combination of these. “But the possibility that Chinese hackers planted malware in India’s grid that has no economic or espionage value suggests that Beijing had malicious intent, aiming either to coerce New Delhi by threatening the country’s critical infrastructure or to activate the malware and cripple India’s strategic capabilities.” |
| "The United States, China, and Taiwan: A Strategy to Prevent War", by Blackwill and Zelikow “A Taiwan Crisis May Mark the End of the American Empire” by Niall Ferguson “Cyberterrorism Tops List of 11 Potential Threats to US”, by Gallup | SURPRISE Both of these are must-read documents. Blackwill and Zelikow describe in detail the devastating economic and financial consequences of a war over Taiwan, and present four very detailed strategy options for either deterring or delaying it. Niall Ferguson describes the potentially devastating foreign policy and defense consequences for the US, and the broader Western Alliance if it suffers a defeat in a war with China over Taiwan. As Blackwill and Zelikow describe, a rational analysis would likely conclude that for Xi Jinping and the CCP, the foreign policy and defense benefits of defeating the US would not be worth the devastating economic and financial cost. Yet the same argument was made in the years before the First World War. Thucydides said there are three causes of war: honor, fear, and national interest. The historian Donald Kagan has argued that honor is a far more common cause than national interest. And Xi Jinping's goal of the "Great Rejuvenation of China" is first and foremost about honor. For investors to believe that the rational cost/benefit analysis of national interest described by Blackwill and Zelikow will deter war risks engaging in the "Mirror Imaging" (interpreting another nation's actions through your own frame of reference) which throughout history has been a repeated cause of intelligence and military surprises. If and when a conflict between the US and China over Taiwan breaks out, the shock to markets and economies is likely to be severe. For example, according to Gallup’s most recent polling, just 30% of Americans regard “the conflict between China and Taiwan” as a critical threat to US vital interests. |
| “The 2020s Tri-Service Modernization Crunch”, by Eaglen and Coyne from AEI | SURPRISE Developing strategy options is the easy part. Actually implementing them via new investments and changes to organizational capabilities is always much harder. This exhaustive new analysis from AEI shows that this is just as true for militaries as it is for private sector companies. As leading industry journal Defense One notes, “years of kicking the can on modernization are finally coming due for the Pentagon at a time when the Biden administration faces major pressures to draw down the defense budget, creating a nasty situation across all three of the military services. “That’s the warning of a new report from Mackenzie Eaglen and Hallie Coyne of the American Enterprise Institute, who says the DoD had best prepare for the reality of the “Terrible ’20s” ahead. “Unlike many think-tank reports, the authors say up front that they will not offer a list of programs to cut. Instead, the report goes deep on the history, current status and future plans for a myriad of Army, Navy, Marine and Air Force programs to provide an “unvarnished” view for the Biden administration about modernization challenges ahead, and how the military has ended up in its current predicament. “Policymakers and uniformed leaders are sleepwalking into strategic insolvency. If no action is taken, something will break and do so spectacularly,” the authors write. “There is no easy way out of this fiscal bind for the US military. Rather, now is the time for effective mitigation strategies, urgent worst-case scenario planning, hard choices, and political leadership.” |
| “Ransomware: A Perfect Storm”, by Sullivan and Muir from the Royal United Services Institute | SURPRISE This paper highlights how ransomware attacks are having a growing negative impact on businesses and organisations across the globe, resulting in high levels of cost and disruption. The authors, “explore the methods, impact and mitigation of ransomware attacks in detail. Case studies reveal the success and popularity of ‘double extortion’ ransomware attacks which include data theft. “The research also describes the range of attack vectors and exposed attack surface available to ransomware operators and reveals how different criminal ransomware operators collaborate and learn from each other. “In the context of a global pandemic, the paper shows how cyber criminals continue to exploit victims and cause disruption with impunity.” |
| | |
| | |
| | |
| | |
| | |
| New Health and Disease Information: Indicators and Surprises | Why Is This Information Valuable? |
| The 27Mar21 CDC report on the proportions of difference SARS-CoV-2 variants comprising newly reported infections showed that so-called “variants of concern” (VOC) now account for 65% of COVID infections in the US.” | SURPRISE The major distinguishing feature of these VOCs is that they are more easily transmitted than the original SARS-CoV-2 strains, because their spike proteins bind more efficiently to human tissue. Hence, infection can result from exposure to a smaller quantity of viral particles. VOCs include variants first identified in the UK (B.1.1.7), South Africa (B.1.351), Brazil (B.1.1.248 or “P.1”), California (B.1.427 and 429), Nigeria (B.1.525), New York (B.1.526), and India (B.1.617). A secondary concern with some of the variants (especially the South African, Brazilian, and perhaps Indian strains) is that they have increased resistance to antibodies (and perhaps the T-Cell response) produced either by previous COVID infection or vaccine. However, research has found that vaccines produce substantially more protection than infection with an earlier strain of the virus. The emergence and evolution of SARS-CoV-2 variants has led vaccine producers to prepare for the production of booster shots targeted at the emerging variants, as is the case today with the annual influenza vaccine. The critical uncertainties here are threefold: (1) The rate at which the SARS-CoV-2 virus evolves (via mutation and recombination). Vaccination should slow this; however, the rate of vaccination and the percent of the population that has been vaccinated both vary widely around the world. (2) The extent to which newly emerging variants of the SARS-CoV-2 virus will be able to evade the protection provided by previous infection and/or vaccination; (3) The future relationship between the time required for new vaccine development, production, and distribution and the rate at which dangerous new virus variants emerge and spread. Different outcomes for these uncertainties lead to a range of scenarios, from optimistic (high virus suppression and strong economic recovery) to pessimistic (low virus suppression and weak economic recovery). See also: “Emerging SARS-CoV-2 Variants and Impact in Global Vaccination Programs against SARS-CoV-2/COVID-19” by Gomez et al |
| In Canada, infections with the Brazilian P.1 variant are rapidly spreading beyond the original infection site at the Whistler ski resort in British Columbia. Recent research has found the P.1 is 1.7 to 2.4 times as infectious as the original Wuhan strain of the SARS-CoV-2 virus. See: “Genomics and epidemiology of the P.1 SARS-CoV-2 lineage in Manaus, Brazil”, by Faria et al, and “Model-Based Estimation Of Transmissibility And Reinfection Of SARS-Cov-2 P.1 Variant”, by Coutinho et al. | SURPRISE If Canada fails to suppress the emerging P.1 variant outbreak and allows it to rage across the country, the negative impact on market and economic confidence will very likely be substantial. |
| After extended negotiations with China the preceded its investigation team’s visit to Wuhan, the WHO published its report on the origin of the SARS-CoV-2 virus, which minimized the “lab leak” theory. The report drew a storm of criticism. For example, see: “The Scientists Who Say The Lab-Leak Hypothesis For SARS-Cov-2 Shouldn't Be Ruled Out” in the MIT Technology Review “Theory That COVID Came From A Chinese Lab Takes On New Life In Wake Of WHO Report” on NPR Radio “An Avalanche of Misdirection”, by Tim Raub in City Journal “A Joint WHO-China Study Of Covid-19’sorigins Leaves Much Unclear” in The Economist | In two previous reports, Professor Limeng Yan, formerly of the University of Hong Kong, has presented evidence that SARS-CoV-2 originated in and escaped from the Wuhan Virology Laboratory. In March, she and her team published their third report, which not only provided evidence calling into question previous attempts to discredit the first two reports, but also evidence supporting Yan’s contention that SARS-CoV-2 was created as part of a Chinese biological warfare program (which does contradict the lab escape hypothesis). She noted this passage from a 2015 book by a group of CCP’s military virologists/scientists headed by professor and Major General Dezhong Xu “that described an ideal ‘contemporary genetic weapon’. The key features of it include: “It would be created in a way that it is practically indistinguishable from a naturally occurring pathogen. This way, “even if scientific, virological, and/or animal evidence were in place (to support the accusation), (one can) deny, prevent, and suppress the accusation of bioweapon usage, rendering international organizations and the justice side helpless and unable to make the conviction”. “Its use is not restricted for military battles, but is for non-military settings where it would be ‘causing terror (in) and gaining political and strategic advantage, regionally or internationally, (over the enemy state)’.” Clearly, there is a potentially very strong feedback loop here between the results of continuing investigation of the origins of SARS-CoV-2 and the rapidly worsening relationship between China and the United States. |
| More evidence has been published on the effects of “Long COVID”. | In “Post-Covid Syndrome In Individuals Admitted To Hospital With Covid-19: Retrospective Cohort Study”, Ayoubkhani et al report on the results of a follow up study of previously hospitalized COVID patients. “Over a mean follow-up of 140 days, nearly a third of individuals who were discharged from hospital after acute covid-19 were readmitted (14,060 of 47,780) and more than 1 in 10 (5,875) died after discharge, with these events occurring at rates four and eight times greater, respectively, than in the matched control group. Rates of respiratory disease, diabetes, and cardiovascular disease were also significantly raised in patients with COVID-19.” In “6-Month Neurological And Psychiatric Outcomes In 236 379 Survivors Of COVID-19: A Retrospective Cohort Study”, Taquet et al found that, “Among 236,379 patients diagnosed with COVID-19, the estimated incidence of a neurological or psychiatric diagnosis in the following 6 months was 34% with 13% (receiving their first such diagnosis.” |
| | |
| | |
| | |
| | |
| | |
| | |
| | |
| New Social Information: Indicators and Surprises | Why Is This Information Valuable? |
| “Lessons From Denmark About Inequality And Social Mobility”, Heckman and Landersø | SURPRISE “Many American policy analysts point to Denmark as a model welfare state with low levels of income inequality and high levels of income mobility across generations. It has in place many social policies now advocated for adoption in the U.S. “Despite generous Danish social policies, family influence on important child outcomes in Denmark is about as strong as it is in the United States. More advantaged families are better able to access, utilize, and influence universally available programs. Purposive sorting by levels of family advantage create neighborhood effects. “Powerful forces not easily mitigated by Danish-style welfare state programs operate in both countries.” |
| “Vanishing Size Of Critical Mass For Tipping Points In Social Convention”, by Iacopini et al | SURPRISE “How can minorities of regular individuals overturn social conventions? Theoretical and empirical studies have proposed that when a committed minority reaches a critical group size, ranging from 10% of the population up to 40%, a cascade of behaviour change rapidly increases the acceptance of the minority view and apparently stable social norms can be overturned. “However, several observations suggest that much smaller groups may be sufficient to bring the system to a tipping point. “Here, we generalise a model previously used for both theoretical and empirical investigations of tipping points in social convention and find that the critical mass necessary to trigger behaviour change is dramatically reduced if individuals are less prone to change their views, i.e., are more resistant to social influence. “We show that groups smaller than 3% of the population are effective on different kinds of social networks, both when pairwise or group interactions are considered, and in a broad region of the parameter space. “In some cases, even groups as small as 0.3% may overturn the current social norm. Our findings reconcile the numerous observational accounts of rapid change in social convention triggered by committed minorities with the apparent difficulty of establishing such large minorities in the first place.” |
| “Exposure to Psychosocial Risk Factors in the Gig Economy: A Systematic Review”, by Pierre Berastegui | “The ‘gig economy’ refers to a market system in which companies or individual requesters hire workers to perform short assignments. These transactions are mediated through online labour platforms, either outsourcing work to a geographically dispersed crowd or allocating work to individuals in a specific area. “Over the last decade, the diversity of activities mediated through online labour platforms has increased dramatically… The author finds gig workers experience increasing stress due to: (1) Physical and social isolation; (2) Algorithmic management and digital surveillance; and (3) Work transience. |
| “Are Recent Cohorts Getting Worse? Trends in U.S. Adult Physiological Status, Mental Health, and Health Behaviors across a Century of Birth Cohorts”, by Hui and Echave | SURPRISE “Morbidity and mortality have been increasing among middle-aged and young-old Americans since the turn of the century. We investigate whether these unfavorable trends extend to younger cohorts and their underlying physiological, psychological, and behavioral mechanisms… We find that for all gender and racial groups, physiological dysregulation has increased continuously from Baby Boomers through late-Gen X and Gen Y. The magnitude of the increase is higher for White men than other groups… “In addition, Whites undergo distinctive increases in anxiety, depression, and heavy drinking, and have a higher level than Blacks and Hispanics of smoking and drug use in recent cohorts... “The worsening physiological and mental health profiles among younger generations imply a challenging morbidity and mortality prospect for the United States, one that may be particularly inauspicious for Whites.” |
| “Are Superstar Employees About To Be Offshored?” by Simon Kuper in the Financial Times | SURPRISE “To quote the scary new mantra: If you can do your job from anywhere, someone anywhere can do your job” … “There has been endless talk of remote workers moving from New York or London to Florida or Sussex. In fact, something more radical is happening: high-skilled jobs are being offshored out of superstar cities to the rest of the world. “Like so many changes in this pandemic, what began as an emergency response may solidify into permanence… “The victims of global remote work could be major business hubs such as New York, London, San Francisco and Toronto. “Anglophone cities are the most at risk because so many highly skilled people around the world can work in English. Now companies in these places can tap a global talent pool while also reducing wages…For US companies it would help out with healthcare too… “The biggest economic winners of the last 40 years were highly skilled natives living in superstar cities. They risk becoming the biggest losers of the next era.” |
| “Will Women Catch Up to Their Fertility Expectations?” by Chen and Gok | SURPRISE Economic growth is a function of the rate of population growth, the percent of working age adults who are actually employed, and the rate at which their productivity grows over time. This research reaches a depressing conclusion about the future rate of natural population growth (i.e., from births rather than immigration). “In 2019, the total fertility rate in the United States dipped to 1.71 children per woman, an all-time low and far below the replacement rate of 2.10 children. “However, data on “fertility expectations” suggest no cause for concern. Women in their early 30s today, when first asked about their childbearing expectations in their early 20s, said they intended to have more than two children, similar to previous cohorts. Even considering that “completed” fertility has historically fallen short of expectations by about 0.30 children, women currently in their childbearing years would still end up with around two children. “But it turns out that today’s 30-year-olds are much farther from their original expectations than previous cohorts… “Adjusting for the changing influence of the various factors over time produces a completed fertility rate of 1.96 children for the younger cohort. “This finding means that the gap between expected and completed fertility will increase to 0.48, which is much larger than that of earlier cohorts… “Moreover, COVID-19 will likely place downward pressure on fertility, which would increase the gap between expectations and reality. Thus, projected completed fertility, especially for younger cohorts, may not be as high as the estimated 1.96.” |
| “Reproductive Problems in Both Men and Women Are Rising at an Alarming Rate”, by Swan and Colino | SURPRISE “The whole spectrum of reproductive problems in males are increasing by about 1 percent per year in Western countries. This “1 percent effect” includes the rates of declining sperm counts, decreasing testosterone levels and increasing rates of testicular cancer, as well as a rise in the prevalence of erectile dysfunction. “On the female side of the equation, miscarriage rates are also increasing by about 1 percent per year in the U.S., and so is the rate of gestational surrogacy. Meanwhile, the total fertility rate worldwide has dropped by nearly 1 percent per year from 1960 to 2018… “We continue to wonder: Where is the outrage on this issue? The annual 1 percent decline in reproductive health is faster than the rate of global warming (thankfully!)—and yet people are up in arms about global warming (and rightly so) but not about these reproductive health effects. “To put the 1 percent effect in perspective, consider this: scientific data show a 1.1 percent per year increase in the number of children diagnosed with autism spectrum disorder between 2000 and 2016, according to the Centers for Disease Control and Prevention. People have been rightly unnerved about this. “Why aren’t people equally troubled by reproductive damage to males and females? Maybe it’s because many don’t realize that these worrisome changes are happening, or that they’re marching along at the same rate. But everyone should. After all, these reproductive changes can hardly be a coincidence. They’re just too synchronous for that to be possible. “The truth is, these reproductive health effects are interconnected, and they are largely driven by a common cause: the presence of hormone-altering chemicals (a.k.a., endocrine-disrupting chemicals, or EDCs) in our world. “These hormone-hijacking chemicals, which include phthalates, bisphenol A, and flame retardants, among others, have become ubiquitous in modern life. They’re in water bottles and food packaging, electronic devices, personal-care products, cleaning supplies and many other items we use regularly. And they began being produced in increasing numbers after 1950, when sperm counts and fertility began their decline.” |
| “Social Class, Not Income Inequality, Predicts Social and Institutional Trust”, by Kim et al | SURPRISE “Trust is the social glue that holds society together. The academic consensus is that trust is weaker among lower-class individuals and in unequal regions/countries, which is often considered a threat to a healthy society. However, existing studies are inconsistent and have two limitations: (i) variability in the measurement of social class and (ii) small numbers of higher-level units (regions and countries). “We addressed these problems using large-scale (cross-)national representative surveys (encompassing 560,000+ participants from 1,500+ regional/national units). Multilevel analysis led to two consistent sets of findings. “First, the effects of social class on social trust were systematically positive, whereas the effects on institutional trust depended on the way social class was measured. “Second, the effects of income inequality on social and institutional trust were systematically nonsignificant. “Social class—not income inequality—predicts trust.” |
| | |
| | |
| | |
| | |
| | |
| New Political Information: Indicators and Surprises | Why Is This Information Valuable? |
| In the US, the potential size of the US immigration crisis is summed up in the headline from a new Gallup poll of people in Latin America and the Caribbean: “42 Million Want to Migrate to the US.” | As Gallup CEO Jim Clifton bluntly states, “Here are questions every leader should be able to answer regardless of their politics: How many more people are coming to the southern border? And what is the plan? ... 330 million U.S. citizens are wondering. So are 42 million Latin Americans.” |
| “How Democrats Became Stuck on Immigration”, by Alex Samuels | “In 2019 when more than two dozen Democrats were vying for the party’s presidential nomination, they all seemed to agree on one thing: They opposed former President Donald Trump’s draconian immigration policies “Beyond that, though, it got messy. One camp of more progressive Democrats, helmed by former San Antonio mayor and housing secretary Julián Castro, advocated for repealing a law that makes unauthorized border crossings a crime “Other candidates expressed unease with the idea, raising concerns about what that would mean for human traffickers or drug smugglers crossing the border. “But the fact that Democratic presidential candidates were discussing decriminalizing border crossings still represented a significant break. “Over the years, Democrats have moved to the left on immigration, and Democratic voters now hold more progressive views on immigration than both their Republican equivalents and one-time Democratic Party leaders like former President Barack Obama. “But as the 2019 presidential primary debate shows, there’s still a lot of debate in the party on just how far left to go… “Members of the progressive wing, meanwhile, do want a more humanitarian-based immigration system focused less on border enforcement. Many want to abolish or dramatically restructure U.S. Immigration and Customs Enforcement — a rallying cry that became popular among some Democrats amid some of Trump’s most stringent immigration policies —and they want the federal government to stop deporting immigrants. They also want to broaden immigrants’ access to social safety net programs.” |
| “Biden’s Muddle on Immigration” in The Economist | “A crisis is rapidly building on the southern border with Mexico, as hundreds of thousands of migrants seek entry into the United States, fuelled by the hope that the new president will be more welcoming than his predecessor was. “In January and February the number of unaccompanied minors apprehended along the border started to surge above previous peaks. Illegal border crossings in general are soaring, amid predictions that this year they may be the highest for two decades… “For Mr Biden this poses a threat. Immigration, for years the most polarising issue in American politics and one that has become ever harder to solve, could soon dominate the agenda. “To the president’s right, Republicans are on the rampage. To his left, meanwhile, progressive Democrats are out of step with wider American opinion, championing impractical demands (such as stopping deportations) while labour unions oppose sensible policies such as issuing more work visas. “Mr Biden may want to avoid a confrontation with progressives, whose support he needs for other legislation. Yet he finds himself in a bind that could yet cost his party control of Congress in the mid-term elections next year.” |
| “Vested Interests in a Time of Crisis” by Terry Moe | Terry Moe has written a very cogent essay about how (as predicted years ago by Mancur Olson in The Rise and Decline of Nations) powerful vested interests can block critically important collective responses to a crisis. “All government institutions across all areas of public policy inevitably generate vested interests. This happens because they supply certain people and groups with highly valued benefits, including the public services these institutions provide but also the government jobs they fund, the contracts they enter into, and more. “The beneficiaries then have incentives to try to organize and invest in political power to protect their benefits and the institutions providing them. “Mass constituencies — the vested interests that are the usual recipients of public services — face daunting collective-action problems and often can’t become organized and powerful. But concentrated interests with large material stakes typically can. And they do. “The power of vested interests is legendary. Not surprisingly, they typically oppose efforts at major reform because they see them as threatening to their benefits. They do that, moreover, even if the institutions are performing poorly and desperately need to be reformed for the good of society. “This willingness to defend failing institutions applies with special force when vested interests arise from jobs or profits —interests represented by unions and businesses, respectively — because such groups can continue to hold onto their jobs and profits as long as the institutions, however abysmal their performance, simply survive and continue to obtain funding… Moe uses police and teachers unions as examples of vested interests that have stymied reform, even in the face of powerful forces like the killing of George Floyd and in some areas the extended closure of schools during the pandemic. Moe’s conclusion is grim: “Why are the prospects for reform so grim, even in the face of disasters and social shocks that might seem so liberating? “The answer is that, while the coronavirus pandemic and the unrest in the wake of George Floyd’s death have opened up possibilities for reform, the disasters have left a crucial box unchecked: They have failed to undermine the power of the vested interests, leaving them just as dominant as they were before 2020. As a result, police unions will continue to make reforms of police departments exceedingly difficult, and teachers’ unions will continue to stand in the way of education reform… “The problem of better government is a problem of power — and it can’t be solved unless we see it for what it is.” |
| “Many in US, Western Europe Say Their Political System Needs Major Reform”, by Pew Research | SURPRISE “A four-nation Pew Research Center survey conducted in November and December of 2020 finds that roughly two thirds of adults in France and the U.S., as well as about half in the United Kingdom, believe their political system needs major changes or needs to be completely reformed. Calls for significant reform are less common in Germany, where about four-in-ten express this view… “Some of the frustrations people feel about their political systems are tied to their opinions about political elites. In the U.S., concerns about political corruption are especially widespread, with two-in-three Americans agreeing the phrase “most politicians are corrupt” describes country well. Nearly half say the same in France and the UK. Young people, in particular, generally tend to see politicians as corrupt. And those who say most politicians are corrupt are much more likely to think their political systems need serious reform. |
| | |
| | |
| | |
| | |
| | |
| | |
| | |
| | |
| New Financial Markets and Investor Behavior: Indicators and Surprises | Why Is This Information Valuable? |
| Under pressure from activist investors frustrated by the company’s disappointing returns, Danone sacked its CEO, Emmanuel Faber, who had been a strong proponent of responsible, “stakeholder capitalism”, and darling of ESG focused investors. | SURPRISE As the Financial Times noted, “It turns out investors, like CEOs, care about environmental, social and governance issues, but not when it affects their bottom line” (“Culture Wars: Danone Board Sours On CEO After Activist Pressure”). Other CEOs are sure to take note. As the FT said in another article, “Faber’s fall comes at a critical point. A backlash against purpose-driven capitalism was overdue. Activists of the Friedman school are now doing battle with a new tribe of campaigning ESG investors, who believe their companies face extinction if they do not pursue environmental and social goals” (“Danone: A Case Study In The Pitfalls Of Purpose”). |
| “The Role of Cryptocurrencies in Investor Portfolios”, by Czasonis, Kritzman et al | SURPRISE I’ve always found Mark Kritzman to be a very smart guy and a very clear thinker and writer. So I read this new paper with interest. The authors ask an important question: “The role of cryptocurrencies as a vehicle for speculation has been well established. However, it is less clear if cryptocurrencies can also serve to manage risk.” They start with this critical, but too often overlooked observation: “Even if an asset class displays a favorable correlation profile based on short-term returns, most investors care as much, if not more, about how asset classes interact over long horizons. “An asset class that moves independently or even inversely with a portfolio’s main growth engine on a daily or monthly basis, but which also drifts in the same direction over the course of the investor’s investment horizon, does little to mitigate adverse long-term performance.” However Kritzman and his fellow authors also recognize the challenges to addressing this issue: “Unfortunately, the longer-horizon interaction of asset classes is difficult to measure for two reasons. “First, if the autocorrelations of either asset class or the cross-correlations between them are non-zero at any lag [i.e., annual returns are not independent and identically distributed over time], correlations based on shorter-interval returns will misestimate the correlation of longer-interval returns. “Second, the correlation of longer interval returns, whether they are estimated as independent observations or overlapping observations, vary through time… “Our focus therefore is to measure the extent to which other asset classes offer diversification when US stocks perform poorly and unification when they perform well”… “After controlling for bias, we observe that when US stocks have negative returns, Treasury Bonds and Gold offer greater diversification benefits” than crytocurrencies. “The larger the loss in US stocks, the greater the co-movement between stocks and cryptocurrencies.” However, “Though the average correlation between US stocks and cryptocurrencies is positive across all three return intervals [monthly, yearly, and 3 year], there are individual periods with highly divergent returns between the two assets. Moreover, the relationship between their three-year returns experienced a structural shift in 2018. “Prior to 2018, their long-term co-movement was consistently positive; since then, it has often been negative, including over the most recent three-year period ended December 2020” … The authors conclude that, “cryptocurrencies do not offer protection for investors with short horizons. Regarding the diversification potential of cryptocurrencies for investors with long horizons, the authors find that investors without a (lottery) preference for speculative returns would require expected annual returns on cryptocurrencies of 30% or more to support any portfolio allocation to them. |
| “Real and Private Value Assets”, by Goetzmann et al | “Financial assets are contractual claims to benefits that flow from ownership or promises from income-producing entities. By contrast, the owner of a real asset has the right to possess and personally enjoy a particular piece of durable physical property that is typically unique (or at least in limited supply and subject to heterogeneity in quality). “Ownership also gives the right to contract over the use of this property. The most well-known real asset type is of course real estate, be it residential, commercial, or agricultural. Other important real asset categories are physical infrastructure, and collectibles such as artworks… “When can durable physical objects be considered assets? Commercial real estate and infrastructure projects yield cashflows, and acquirers’ intention is clearly to earn a return commensurate with the risks they are taking. “By contrast, one might treat a cabin in the woods or an oil painting as simply a consumption good for which one pays a price and then enjoys a service flow. “However, when a residential structure or a collectible is purchased with an expectation of a (possible) future resale—when there is an anticipated dimension of time with attendant concern for the object’s financial risk and return—then it becomes an asset… “Real and private-value assets—defined here as the sum of real estate, infrastructure, collectibles, and non-corporate business equity—is an investment class worth an estimated $85 trillion in the U.S. alone… “The price formation and trading process of real assets is unlike that for publicly traded equities. “Real assets are characterized by infrequent trading in search and auction markets, market values that are hard to pin down exactly, and investment returns that can only be estimated with noise. “Moreover, for assets such as owner-occupied housing and works of art, the use value derived from ownership is non-monetary and non-tradable, and is private in the sense that it depends on the identity of the owner. “For private-value assets, any two potential buyers will be willing to pay different amounts—reflecting differences in preferences and relative wealth—even when they have identical resale strategies and agree on future monetary cashflows. “Because of the illiquidity of the markets in which these assets are traded, variation in private values can translate into systematic differences in transaction prices and thus financial returns between market participants. “Heterogeneity in beliefs about the future dynamics of private preferences—driving potential resale revenues and thus the common-value component of an asset—can further amplify the price uncertainty at any point in time.” |
| The country weights in the MSCI Emerging Markets Index “ain’t what they used to be.” | Back in 1995, the top 5 country weights were Malaysia (17%), South Africa (16%), Brazil (11%), Thailand (10%), and Mexico (8%). Today they are China (38%), Taiwan (14%), South Korea (13%), India (10%), and Brazil (4%). We’ve come a very long way from when the IFC’s Antoine van Agtmael coined the term “emerging markets” and created the first index to track their equity market returns back in the early 1980s. |
| “Institutional Investors and Infrastructure Investing”, by Andonov, Kraussl, and Rauh | SURPRISE “There is a commonly heard explanation for why institutional investor demand for infrastructure has risen so much and continues to increase: that infrastructure is a new asset class with attractive attributes such as low sensitivity to swings in the business cycle, little correlation with equity markets, and long-lasting, inflation-linked cash flows. “The underlying assets – in sectors such as renewable energy, traditional energy, transportation, utilities, information and communication technology (ICT), schools and hospitals – have long duration, are more tangible, belong to highly regulated industries, and in some cases are even backed by long concession agreements. “As such, many institutional investors consider infrastructure a natural fit with their long-duration liabilities. The financial industry tends to support this presentation of the benefits of infrastructure investment, regulators are increasingly treating infrastructure more favorably than other private assets, and many institutional investors echo these views in their own statements of why they invest in infrastructure. “But is infrastructure delivering cash flows and returns that would be consistent with this story? “Infrastructure investing is organized primarily through four structures: closed private funds, direct deals, listed funds, and open-ended funds. Of these, closed private funds, which reached $486 billion of assets under management (AUM) as of 2019, represent the lion’s share of investor commitments, and also the majority of the dollar value of deals. “The second most relevant structure is the direct deal. Direct deals are implemented by a small number of deep-pocketed investors, and not currently applicable to the majority of institutional investors as they require very large commitment to a single asset as well as specialized human capital to select and monitor these assets… “We analyze the risk and return characteristics of infrastructure investments, as well as the drivers of their payout policy and performance. We test and reject the hypothesis that infrastructure investing through closed private funds on average delivers more stable and diversifying cash flows than other alternative asset classes. “Instead, we find that infrastructure investment, as institutional investors primarily practice it, has pro-cyclical cash flows generated largely by quick deal exits. Despite the fact that infrastructure covers long-lived tangible assets, the business model of closed funds does not translate any potential differences in the underlying assets into different risk-return properties” … “Despite weak risk-adjusted performance and failure to match the supposed characteristics of infrastructure assets, closed funds have received more commitments over time.” |
| | |
| | |
| | |
System Tipping Points/Critical Threshold Analysis
Like Professors Andrew Lo, Doyne Farmer and others, we regard financial markets as a complex adaptive system (CAS), that exist as part of a larger macro system comprised of other CAS between which there are multiple feedback loops. These other systems include those that produce technology innovations, and economic, environmental, national security (including cyber), social, demographic, and political outcomes.
We also find that these systems tend to operate and generate effects in a rough chronological sequence, albeit with many feedback loops between them. The following chart highlights that the changes we observe in different areas at any point in time are actually part of a much more complex evolutionary process.
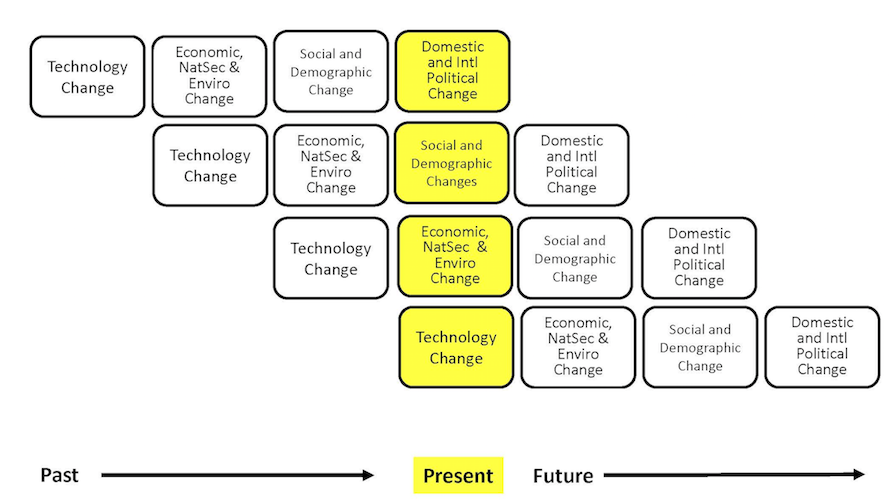
While most media coverage of these systems focused on flows (e.g., the size of the government deficit), rapid non-linear change in complex adaptive systems is often caused by a key stock (e.g., the amount of outstanding government debt) exceeding a critical threshold.
The next table highlights the key macro system stocks that we monitor.
In the next section, we will discuss information received over the past month that is related to these stocks, and which we believe is significant to our assessment of the probabilities that a critical threshold will be reached and a regime change will occur. We will conclude with our estimate, at the end of this month, of how close the macro system is to these critical thresholds, and the implications for financial market regime change probabilities.
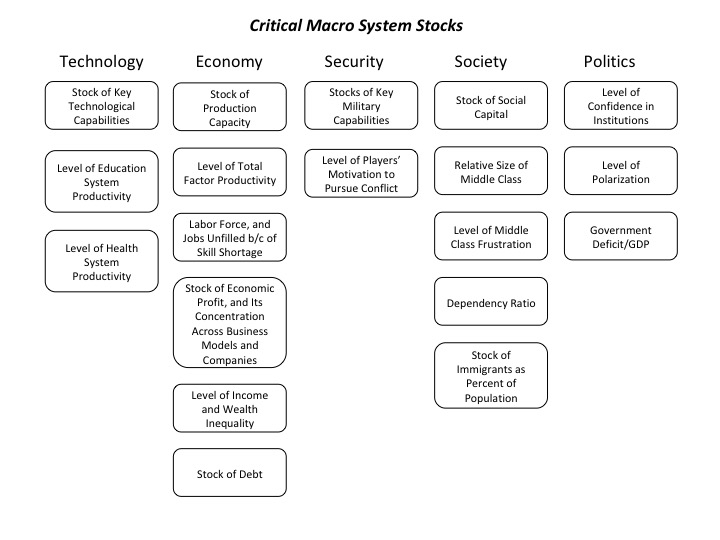
How Close is the Macro System to One or More Critical Thresholds?
As we have noted, the macro drivers of financial market regime changes typically follow a rough chronological sequence, from technology to economic, security, social, and political causes and effects. Yet there are many feedbacks loops between them, creating complex root causes for many of the critical thresholds we have identified.
Understanding the time dynamics in this complex system is critical to avoiding substantial downside investment risk.
We use the UK Met Office Warning Model to communicate our assessment of these time dynamics. We estimate the time remaining before a critical macro system threshold is reached that could trigger a regime change, which is usually accompanied by substantial changes in asset class valuations.
The model uses three increasingly serious levels of warning, from “Be Aware” (condition yellow), to “Be Prepared” (condition orange), to “Take Action” (condition red).
For our purposes, we denote as “Be Aware” (yellow) critical thresholds that we assess to be three or more years away. We estimate that “Be Prepared” (orange) thresholds could be reached within 1 to 3 years. “Take Action” thresholds are very likely to be reached within one year.
Given their nature, we also note that in our three “wildcard” areas (Environment and Energy related; Disease and Human Caused Bioevents; and Cyber and Electromagnetic Events), our forecasts have higher levels of uncertainty.
The following charts summarize our current estimate of the time remaining before different critical thresholds will be reached.
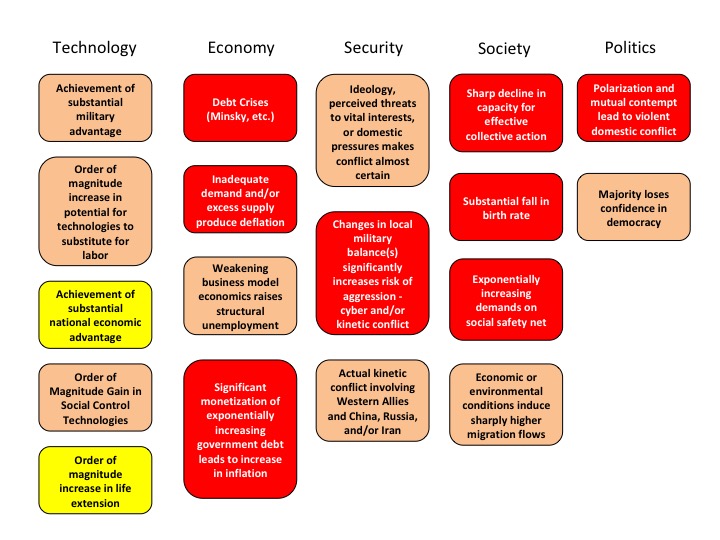
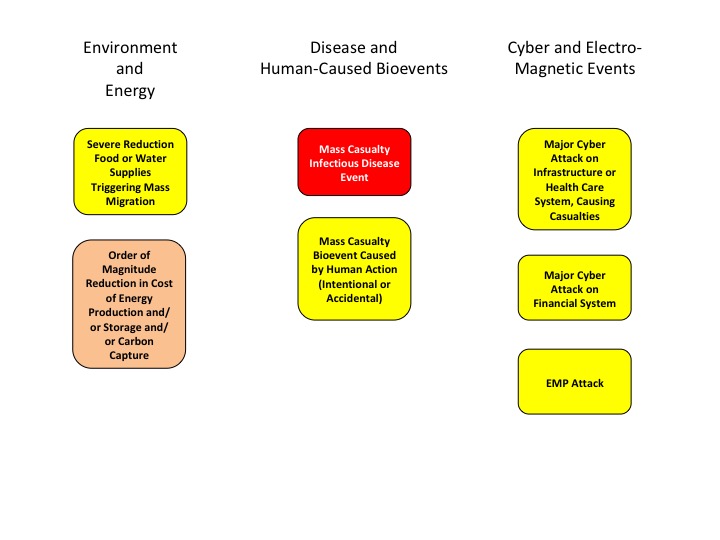
At the highest level, we believe the complex adaptive global macro system can be in one of four states, based on its degree of order versus disorder, and degree of social cooperation versus conflict. A very coarse-grained reading of history suggests that these states evolve in a predictable cycle, from ordered/cooperative, to disordered/cooperative, to disordered/conflicted, to ordered/conflicted.
We believe that the system is currently in its most uncertain state, characterized by high degrees of underlying disorder and social conflict, both domestically and internationally. Beyond some point, intensifying conflict eventually increases the degree of order in the system. That appears to be happening now, via the increasing conflict between China, Russia, and Iran and the United States and other Western nations.
If you have any questions about anything we have written in this issue, please don’t hesitate to get in touch, at contact@indexinvestor.com
Appendix: Anticipatory Thinking and Forecasting Methodologies
Our process is based on methods and tools developed over the past seven years at our affiliate, Britten Coyne Partners, which provides consulting services and education courses to executive teams and boards on strategic risk governance and management.
At The Index Investor, we engage in both anticipatory thinking to identify what could happen (e.g., different macro regimes and related events), and forecasting, to estimate the probability that events and regimes will happen, and the impact they will have if they do (e.g., on macro variables and broad asset class returns).
With respect to what could happen, we are acutely conscious of the conclusion reached by a 1983 CIA study of failed forecasts: "each involved historical discontinuity, and, in the early stages…unlikely outcomes. The basic problem was…situations in which trend continuity and precedent were of marginal, if not counterproductive value."
When it comes to forecasting, we know that in complex socio-technical systems that are constantly evolving, the accuracy of statistical or machine learning based forecasting methods declines exponentially as the time horizon lengthens, since the historical data set on which they were trained will (depending on the speed and effectiveness of any retraining cycle) bear less and less resemblance to the distribution of outcomes the system is likely to produce in the future.
Under these circumstances, forecast accuracy over longer time horizons depends on causal and counterfactual reasoning about the possible future effects of multiple interacting trends and uncertainties that are hard to quantify.
And we are acutely aware of the economist Rudi Dornbusch's famous warning: "Crises take a much longer time coming than you think, then happen much faster than you would have thought."
Our forecasting process also draws on lessons Tom Coyne learned from spending four years as a member of the Good Judgment Project team, which won the Intelligence Advanced Research Projects Activity’s forecasting tournament with forecast accuracy that was more than 50% better than the tournament's control groups (the team's experience is described in Professor Philip Tetlock's book, “Superforecasting").
Our analysis focuses on the probability of the global macro system being in four possible macro regimes 12 and 36 months from the date of our forecast: (1) Normal Times, where equity asset classes perform well; (2) a High Uncertainty regime that is usually short and transitory, where asset classes like short-term government bonds perform best and equities suffer significant declines; (3) High Inflation (which we deem 5% or more, year-on-year), where commercial property, real return bonds and other traditional hedges are favored; and (4) Persistent Deflation (a year-on-year decline in the US CPI), which up to now has only been seen in Japan, and in which the relative performance of different asset classes remains uncertain, but will likely favor high quality bonds and the consumer staples equity sector.
In response to subscriber requests, we have added a 36-month regime forecast to our existing 12 month forecast. The logic is that, in a complex evolving system like global macro, a longer forecast horizon gets beyond the “detection range” of algorithmic forecasting approaches, and therefore raises probability that a manager/investor can gain an edge in identifying emerging threats and opportunities.
That said, because evolving (i.e., “non-stationary”) complex systems populated by highly connected human agents are also capable of sudden non-linear changes (with which are hard for algorithmic approaches to predict), we are also keeping our 12 month forecast.
Our forecasting methodology starts with base rate/reference case data about the historical probability of large changes in equity and bond valuations. We then analyze the current situation from both a quantitative and qualitative perspective. In the latter, we focus on the key endogenous drivers of macro regime change, including technological, economic, national security, social, and political trends and uncertainties. We also focus on three potential sources of exogenous shocks that could also produce a macro regime change, caused by environmental, disease, and cyber related events.
While most of our attention typically focuses on various flows (e.g., economic growth, change in the price level, sales, earnings, job creation, etc.), endogenously caused regime changes result when those flows push key stocks beyond a critical threshold or tipping point, often setting off non-linear reactions across multiple areas. As noted by Hyman Minsky and others, a classic example is the steady accumulation of outstanding debt until it reaches the point where it can no longer be serviced and triggers a crisis.
Base Rate Data
Since the end of World War Two, there have been fifteen months where a downturn in the US equity market began that eventually reduced asset class value by 20% of more. That is a hazard rate of about 1.75% per month. Put differently, in any given month there is a 98.25% probability that a 20%+ downturn won’t occur, or, in a given year, an 81% probability.
However, as the time without a 20%+ downturn extends, the compound probability that one will not occur shrinks. At the end of August 2018, it is more than nine years since the last equity market decline of 20% or more. The probability of that happening is only 15%.
To estimate the base rate for a 20% fall in bond prices (which historically has been caused by a sharp increase in inflation, as we saw in the late 1970s and early 1980s), we analyzed monthly historical AAA bond yields since 1919. For consistency, we used them to calculate the price of a ten-year zero coupon bond. We then calculated the probability of a price decline of 20% or more over three different holding periods: 12, 18, and 24 months. In any month, the annualized probability of a decline of 20% or more over the subsequent 12 months is 12%; over 18 months, 20%, and over 24 months, 25%.
Market Stress Indicators Methodology
We view financial markets as a complex adaptive system. The size of changes generated by such a system follows a power law rather than a normal (Gaussian) distribution. The critical point is that large changes are much more common in complex adaptive systems than most people’s intuition leads them to believe.
While predicting the behavior of complex adaptive systems remains far more art than a science, various researchers have found that large changes in such systems are often preceded by subtle warning signs, as stress accumulates within them. While this research is not definitive, we believe that five warning signs are worth monitoring as potential indicators of growing stress within financial markets that could suddenly give rise to large changes in asset class valuations.
Our first indicator is the month-to-month autocorrelation of broad asset class returns (i.e., the relationship of this month’s returns to last month’s). A system under increasing stress loses resiliency, causing it to take longer to recover from perturbations; hence, autocorrelation increases as it approaches a critical transition (see, “Early Warning Signals for Critical Transitions” by Scheffer, et al).
The second market stress indicator we monitor is the Economic Policy Uncertainty Index published by the Federal Reserve Bank of St. Louis (via its FRED economic database), which is based on research by Baker, Bloom, and Davis (see their paper, “Measuring Economic Policy Uncertainty”). The index is based on automated text analysis of leading newspapers and magazine publications, to identify the frequency with which words and phrases are used that indicate uncertainty.
In humans’ evolutionary past, when uncertainty increased the probability of survival was enhanced by staying close to a group. All of us still have that instinct. Research has found that as uncertainty increases, we have an unconscious bias towards higher conformity of our own views with those of a larger group (i.e., reduction in cognitive diversity). Behaviorally, heightened uncertainty induces more “social copying” of others, likely due to both conformity bias and the rational belief that others may be acting on the basis of superior information. This increase in conformity and copying makes a social system more ordered as uncertainty increases, and also reduces its responsiveness to perturbations (i.e., increases autocorrelation) because of delays in the social copying process.
The key point is that increasing uncertainty induces more, not less order in social systems, and in so doing primes them for sudden non-linear change.
Our third market stress indicator is the spread between the yield on AAA rated bonds and the 10-year US Treasury. This is a proxy for the level of investor concern about financial system funding liquidity.
Our fourth market stress indicator is the yield spread between speculative BB rated bonds and the ten-year US Treasury. Throughout history, excessive credit growth has been a root cause of many financial crises. An indicator of such growth is falling credit spreads, particularly in the case of riskier borrowers. In contrast, rising BB spreads indicate growing investor concern about the consequences of such growth, and the financial distress lower rated companies could experience in an economic downturn.
Our fifth market stress indicator is what we term the “political risk premium” that is implicit in the price of gold. Our starting point for estimating this premium is the three different roles that gold plays. First, gold is a store of value in a world of fiat currencies. When the rate of money supply growth exceeds the growth of nominal GDP, gold’s price should increase to maintain its purchasing power. Between 2007 and 2017, the US money supply (M2) grew by about 86%, while nominal US GDP grew by 35%. The stock of gold grew by 18%, based on mine production over this period. We therefore infer that 33% of the increase in the price of gold represented the maximum potential gold price change that could be attributed to a desire to hedge inflation risk (86% less 35% less 18%).
Second, gold is a unit of account. We take this to mean that the annual change in GDP expressed in terms of physical gold (i.e., nominal GDP divided by the price of gold) should equal the change in real GDP calculated using the GDP price deflator to account for actual inflation over the period. A key challenge is the point at which to start this calculation.
We chose the price of gold in 1995/1996. In that period, the change in real global GDP measured using the IMF’s price deflator just about equaled the change in GDP measured in terms of physical gold. We interpret that coincidence as indicating that at that point in time, concerns about future inflation and political risk were minimal, and the change in the price of gold was mostly driven by its role as a unit of account. We calculated a subsequent series of gold prices that would produce the same change in “gold GDP” as the actual real GDP as calculated by the IMF. Between 2007 and 2017, “gold as a unit of account” warranted a 21% increase in its price.
Gold’s third role is as a hedge against inflation and what we term “political disaster” risk. We subtract the 21% estimated compensation for actual inflation from the 33% “gross” inflation risk hedge to derive an apparent 12% increase in the gold price that reflected the true risk premium to hedge against possible future inflation. However, between 2007 and 2017 the price of gold actually increased by 81%. This implies that 48% of this (81% less 21% less 12%) represented a premium for some other type of uncertainty at the end of 2017. The interesting question is the nature of the uncertainty for which gold is believed by some investors to be a superior hedge than traditional ports in a storm like short-term US government securities, or similar securities issued by other developed countries.
The logical inference is that the uncertainty in question must reflect a situation in which short term US Treasuries would be a less effective hedge than gold. This could be a world of widespread hyperinflation, capital controls, and/or radical changes in nations’ governments (of course, this would also imply a preference for investing in gold coins rather than bullion, as while the latter may be a store of value, it is far less convenient as a means of paying for transactions).
To put this in further perspective, this gold price “disaster risk” premium sharply increased from 2008 to 2012, then declined before sharply increasing again after 2016. Arguably, a significant part of the former increase reflects concerns about the potential inflationary consequences of dramatic quantitative easing by central banks. But this is not likely to be the case after 2016.